DEC 19, 2022
www.angelone.in
Technical & Derivatives Report
xOOOOOOOO
Nifty Bank Outlook (43219)
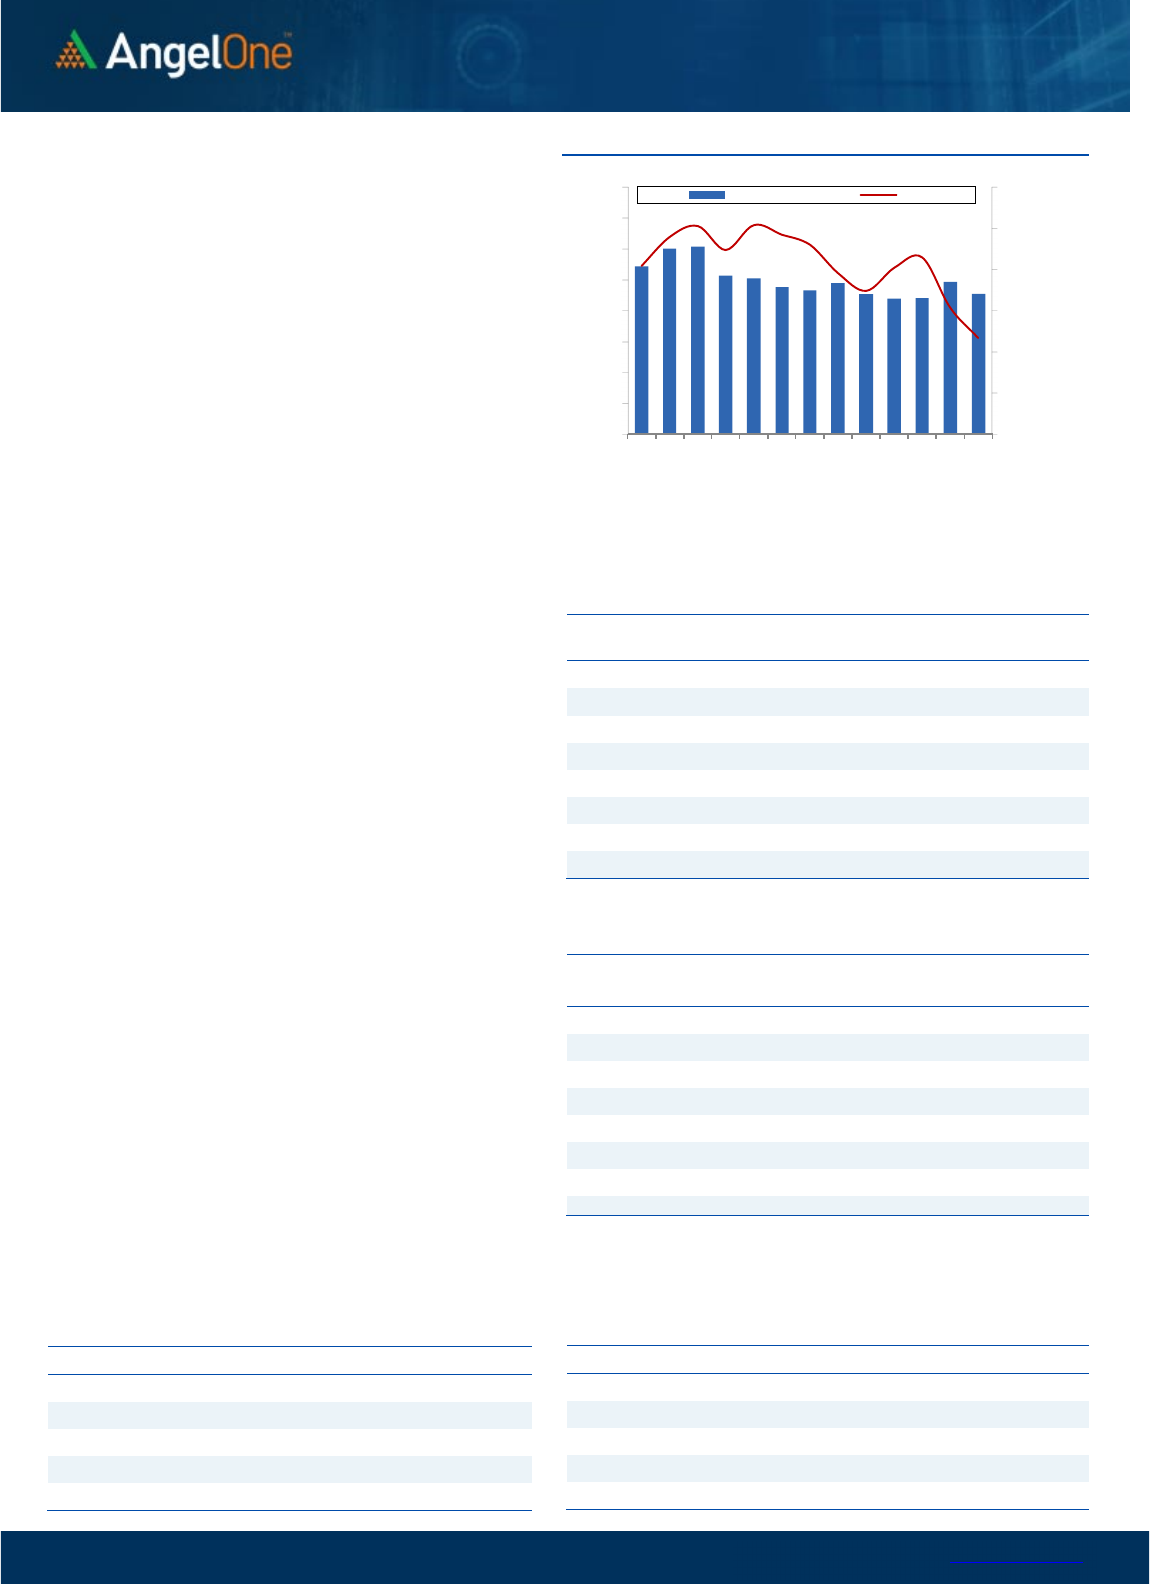
The stellar up move in the banking space has come to a halt post
ten weeks of consecutive rally. The sell-off in the last two trading
sessions has led the Bank Nifty index to plunge towards the 20
DEMA on the daily chart and snapped its winning streak. The index
concluded the week with a cut of nearly a percent and settled a tad
above 43200 levels.
On the technical front, the cycle of higher highs – higher lows is still
intact, but the narrowing down of the momentum signifies the
tiredness in the bulls. As far as levels are concerned, 43000-42800
is the intermediate support, followed by the sacrosanct support of
the unfilled gap placed around 42550-42500. On the flip side,
43650-43700 is likely to act as immediate resistance, breaching
which the index is expected to reclaim its lifetime high zone in the
comparable period. The index is placed at a crucial level and one
needs to keep a close tab of the mentioned levels for the time
being.
Key Levels
Support 1 – 43000 Resistance 1 – 43650
Support 2 – 42800 Resistance 2 – 43700
Exhibit 1: Nifty
Daily
Chart
Exhibit 2: Nifty Bank
Daily
Chart
Sensex (61338) / Nifty (18269)
On Friday, we had a nervous start in line with the weak global cues.
Subsequently, there was recovery during the mid-session to recover
all the lost ground. However, during the penultimate hour there was
one more round of sell-off that remained towards the end to
eventually end with loss of 0.79%
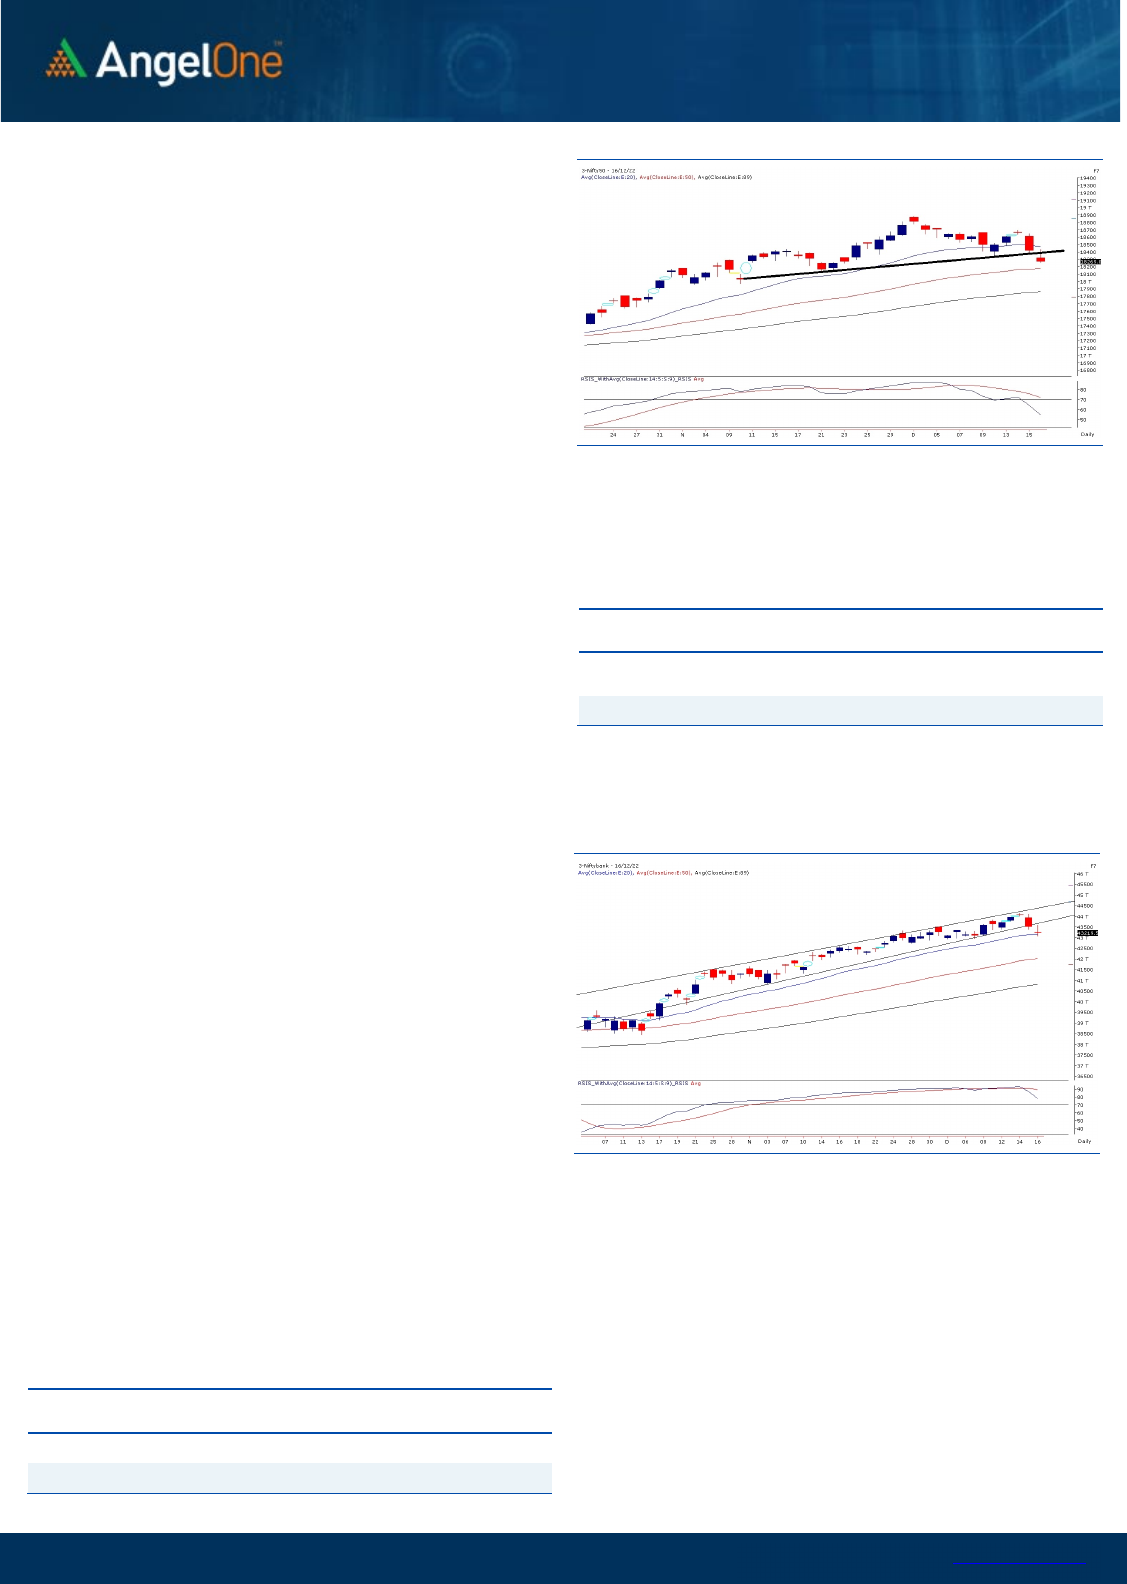
The benchmark index Nifty has now sneaked below the key swing
low of 18350 on a closing basis. Ideally looking at the price structure,
the development does not augur well for the bulls. A close below
this support opens the possibility of extended correction in this
week. We may be biased, but we are still not convinced with this
close. Only a follow through selling may lead to further weakness
towards 18130 - 18000 - 17900 in coming sessions. Even if this
scenario pans out, we do not expect the correction to aggravate
below the lower end of this support range. The higher degree up
trend remains intact as long as we manage to hold this. Since market
was deeply overbought, we must consider this as a running
correction. On the flipside, 18450 - 18600 are to be treated as
immediate hurdles. If bulls have to regain their strength, 18450
needs to be surpassed with some authority, which will negate the
breakdown from small ‘Head and Shoulder’ pattern on daily time
frame chart.
Traders are advised to stay light for a while. Let either market
complete its correction first or reclaim key levels on the upside
to resume the bullish trend. First half of this week would be quite
crucial for our markets. Let’s see how global market behaves and
hopefully, there is no major aberration on the global front.
Key
Levels
Support 1 – 18130 Resistance 1 – 18450
Support 2 – 18000 Resistance 2 – 18500
www.angelone.in
Technical & Derivatives Report
DEC 19, 2022
View
Our market tumbled over the weak global cues,
wherein the benchmark index Nifty50 witnessed a
strong sell-off in the last two trading sessions and
settled the week with a cut of 1.23%, a tad below 18300
level.
FIIs were net sellers in the cash market segment to
the tune of Rs. 1975 crores. Simultaneously, in Index
futures, they bought worth Rs. 514 crores with a
decrease in open interest, indicating a short covering.
Looking at the F&O data, we witnessed long
unwinding in both indices on a weekly basis. On the
options front, the piling up of OI is seen at 18100-
18000 put strikes, indicating downward shift in the
support base. On the flip side, the maximum OI
concentration is seen at the 18400-18600 call strike,
signifying a stiff resistance for the Nifty. Meanwhile,
the stronger hands have covered their longs and
added a few in the short side, contracting the ‘Long
Short Ratio’ to 55% from 58%, on a weekly basis.
Considering the recent price action, we would
advocate to avoid undue risk and also to stay
abreast with global developments in the near
period.
Comments
The Nifty futures open interest has decreased by
2.91% and Bank Nifty futures open interest has
decreased by 6.80% as the market closed at 18269.
The Nifty December future closed with a premium of
59.65 point against a premium of 52.10 point in the
last trading session. The January series closed at a
premium of 174.40 point.
The INDIA VIX increased from 13.73 to 14.07. At the
same time, the PCR-OI of Nifty has increased from
0.76 to 0.81.
Few of the liquid counters where we have seen high
cost of carry are POLYCAB, DRREDDY, GLENMARK,
MCDOWELL-N and PNB.
Historical Volatility
SCRIP HV
IDEA 72.81
IBULHSGFIN 69.12
RBLBANK 67.68
GNFC 58.41
HINDCOPPER 58.16
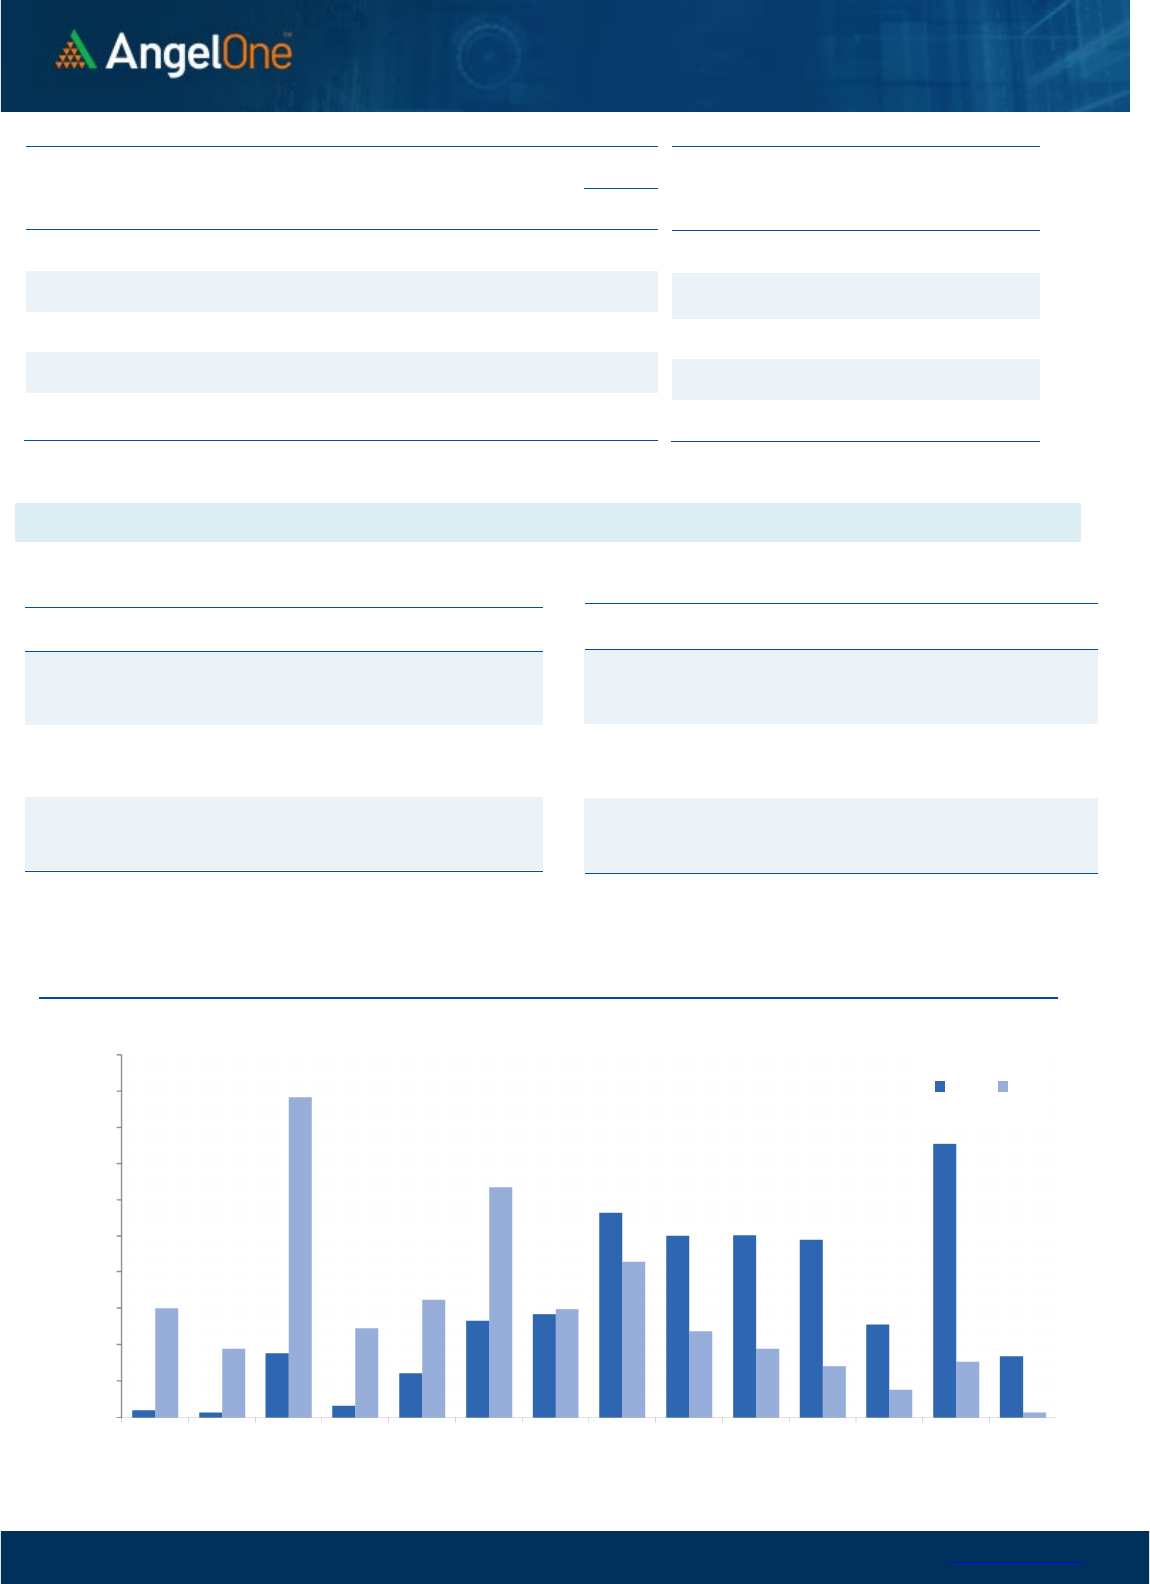
Nifty Vs OI
17800
18000
18200
18400
18600
18800
19000
8,000
9,000
10,000
11,000
12,000
13,000
14,000
15,000
16,000
11/29 12/1 12/5 12/8 12/12 12/14 12/16
Openinterest Nifty
OI Gainers
SCRIP OI
OI
CHG. (%)
PRICE
PRICE
CHG. (%)
DRREDDY 2438875 37.07 4309.10 -3.16
BALRAMCHIN 11185600 25.24 393.90 2.50
TATAMOTORS 82897950 12.26 421.60 0.39
MPHASIS 2699750 7.75 1913.25 -2.31
HDFCAMC 1767900 6.43 2238.55 -1.24
BEL 116519400 6.20 99.45 -3.86
NAVINFLUOR 477600 5.24 4143.40 -3.47
TCS 9398975 4.85 3240.25 -1.71
OI Losers
SCRIP OI
OI
CHG. (%)
PRICE
PRICE
CHG. (%)
PNB 218000000 -8.16 56.75 -4.61
COLPAL 2621150 -7.37 1581.80 1.24
CONCOR 7794000 -4.68 741.30 -3.28
APOLLOTYRE 14507500 -4.38 323.05 -0.06
BHEL 92683500 -4.15 80.80 -3.97
MOTHERSON 95951250 -4.11 70.55 -1.40
IRCTC 20811875 -3.99 672.15 -2.38
GUJGASLTD 4690000 -3.70 521.00 -1.99
Put-Call Ratio
SCRIP PCR (OI) PCR (VOL)
NIFTY 0.81 0.94
BANKNIFTY 0.76 1.04
RELIANCE 0.39 0.41
ICICIBANK 0.43 0.56
INFY 0.40 0.61
www.angelone.in
Technical & Derivatives Report
DEC 19, 2022
Note: Above mentioned Bullish or Bearish Spreads in Nifty (Dec Series) are given as an information and not as a recommendation.
Nifty Spot =
1
8
269
.
0
0
FII Statistics for
December
1
6
, 2022
Detail Buy
Contracts
Open
Interest
Value
(in Cr.)
Sell
Net
CHANGE
INDEX
FUTURES
5504.23 4990.45 513.78
168995 16312.02 (3.10)
INDEX
OPTIONS
1184737.61 1182902.79 1834.82
1906081 182231.38 33.18
STOCK
FUTURES
11060.68 10794.10 266.58
1987646 135752.94 1.38
STOCK
OPTIONS
14077.29 14057.16 20.13
166964 11673.00 0.41
Total 1215379.81
1212744.50
2635.31
4229686
345969.34
13.32
Turnover on
December
1
6
, 2022
Instrument
No. of
Contracts
Turnover
( in Cr. )
Change
(%)
Index
Futures
415365 4108425.50
33.17
Index
Options
137240588 5232714.33
15.48
Stock
Futures
873235 6074902.56
24.31
Stock
Options
4071127 345510.42 9.11
Total
40,71,127 345510.42 22.95
Bull-Call Spreads
Action Strike Price Risk Reward BEP
Buy
18300 185.85
52.20
47.80
18352.20
Sell
18400 133.65
Buy
18300 185.85
92.15
107.85
18392.15
Sell
18500 93.70
Buy
18400 133.65
39.95 60.05 18439.95
Sell 18500 93.70
Bear
-
Put Spreads
Action Strike Price Risk Reward BEP
Buy 18300 157.70
41.25
58.75
18258.75
Sell
18200 116.45
Buy 18300 157.70
70.30
129.70
18229.70
Sell 18100 87.40
Buy
18200 116.45
29.05 70.95 18170.95
Sell 18100 87.40
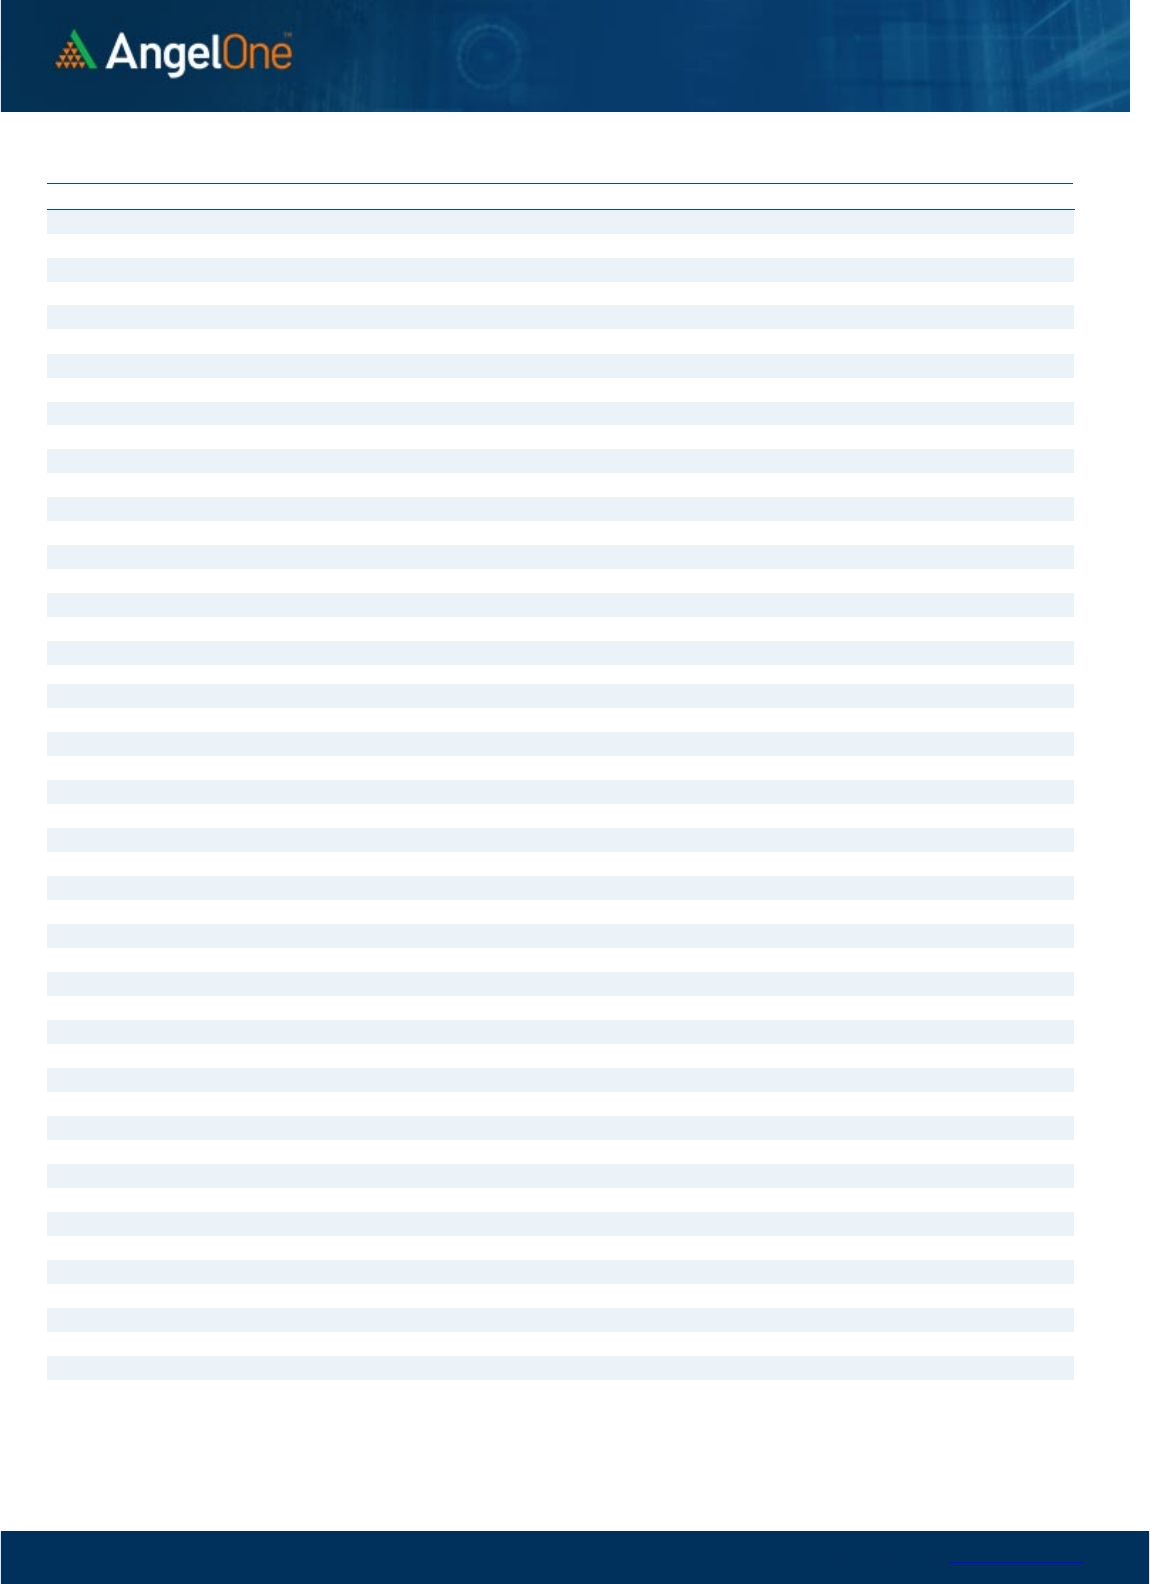
Nifty Put
-
Call Analysis
,0
500,000
1000,000
1500,000
2000,000
2500,000
3000,000
3500,000
4000,000
4500,000
5000,000
17800 17900 18000 18100 18200 18300 18400 18500 18600 18700 18800 18900 19000 19100
Call Put
www.angelone.in
Technical & Derivatives Report
DEC 19, 2022
`
Daily Pivot Levels for Nifty Constituents
Scrips
S2
S1
PIVOT
R1 R2
ADANIENT 3,887 3,934
3,991
4,038
4,095
ADANIPORTS
832
846
869
883
905
APOLLOHOSP 4,499 4,532
4,585
4,618
4,671
ASIANPAINT 3,008 3,032
3,074 3,099
3,141
AXISBANK
920
928
936
944
953
BAJAJ-AUTO 3,483 3,516
3,572
3,605
3,661
BAJFINANCE 6,482 6,540
6,617
6,675
6,753
BAJAJFINSV
1,564
1,576
1,593
1,604
1,622
BPCL
334
338
345
348
355
BHARTIARTL 812 818
825
830
838
BRITANNIA 4,386 4,415
4,446
4,476
4,507
CIPLA
1,073
1,081
1,095
1,103
1,116
COALINDIA
219
222
226
229
233
DIVISLAB
3,272
3,300
3,340
3,367
3,407
DRREDDY
4,145
4,227
4,343
4,425
4,541
EICHERMOT
3,239
3,265
3,306 3,333 3,374
GRASIM
1,728
1,742
1,766
1,780
1,804
HCLTECH
1,009
1,019
1,033
1,043
1,057
HDFCBANK
1,595
1,617
1,631 1,654
1,667
HDFCLIFE
566
571
578
583
590
HDFC
2,613
2,640
2,659
2,686 2,705
HEROMOTOCO 2,686 2,705
2,737
2,756
2,787
HINDALCO
447
452
457
462
468
HINDUNILVR
2,636
2,654
2,671
2,688 2,705
ICICIBANK 891 897
905
911
919
INDUSINDBK 1,188 1,209
1,229
1,250
1,269
INFY
1,490
1,506
1,528
1,544
1,565
ITC
328
331
335
339
343
JSW STEEL 729 736
742
749
755
KOTAKBANK
1,822
1,832
1,844
1,853
1,866
LT
2,132
2,153
2,183
2,204
2,233
M&M
1,226
1,239
1,263
1,276
1,300
MARUTI 8,365 8,425
8,507 8,567 8,649
NESTLEIND
19,433
19,586
19,723
19,876
20,013
NTPC
167
168
171
172
175
ONGC 145 146
148 149
152
POWERGRID
209
211
215
217
220
RELIANCE 2,520 2,543
2,581
2,604 2,642
SBILIFE
1,233
1,244
1,261 1,272
1,289
SBIN
594
598
607
612
621
SUNPHARMA
978
986
995
1,003
1,013
TCS
3,186
3,213
3,252 3,280
3,319
TATACONSUM
791
796
801 806 810
TATAMOTORS
406
414
421 429
436
TATASTEEL 108 110
111 112
114
TECHM 999 1,010
1,022
1,033
1,044
TITAN 2,454 2,469
2,494 2,509 2,534
ULTRACEMCO 6,886 6,950
7,057
7,122
7,229
UPL
753
762
768
777
783
WIPRO
384
387
391
394
398
www.angelone.in
Technical & Derivatives Report
DEC 19, 2022
*
Technical and Derivatives Team:
Sameet Chavan Chief Analyst – Technical & Derivatives sameet.chavan@angelone.in
Sneha Seth Senior Analyst – Technical & Derivatives sneha.seth@angelone.in
Rajesh Bhosale Technical Analyst rajesh.bhosle@angelone.in
Osho Krishan Senior Analyst – Technical & Derivatives osho.krishan@angelone.in
Research Team Tel: 022 – 39357600 Website: www.angelone.in
For Technical Queries E-mail: technicalresearch-cso@angelone.in
For Derivatives Queries E-mail: derivatives.desk@angelone.in
DISCLAIMER
Angel One Limited (hereinafter referred to as “Angel”) is a registered Member of National Stock Exchange of India Limited, Bombay
Stock Exchange Limited and Metropolitan Stock Exchange Limited. It is also registered as a Depository Participant with CDSL and
Portfolio Manager and investment advisor with SEBI. It also has registration with AMFI as a Mutual Fund Distributor. Angel One
Limited is a registered entity with SEBI for Research Analyst in terms of SEBI (Research Analyst) Regulations, 2014 vide registration
number INH000000164. Angel or its associates has not been debarred/ suspended by SEBI or any other regulatory authority for
accessing /dealing in securities Market.
This document is solely for the personal information of the recipient, and must not be singularly used as the basis of any investment
decision. Nothing in this document should be construed as investment or financial advice. Each recipient of this document should
make such investigations as they deem necessary to arrive at an independent evaluation of an investment in the securities of the
companies referred to in this document (including the merits and risks involved), and should consult their own advisors to determine
the merits and risks of such an investment.
Angel or its associates or research analyst or his relative may have actual/beneficial ownership of 1% or more in the securities of
the subject company at the end of the month immediately preceding the date of publication of the research report. Neither Angel or
its associates nor Research Analysts or his relative has any material conflict of interest at the time of publication of research report.
Angel or its associates might have received any compensation from the companies mentioned in the report during the period
preceding twelve months from the date of this report for services in respect of managing or co-managing public offerings, corporate
finance, investment banking or merchant banking, brokerage services or other advisory service in a merger or specific transaction
in the normal course of business. Angel or its associates did not receive any compensation or other benefits from the companies
mentioned in the report or third party in connection with the research report. Neither Angel nor its research analyst entity has been
engaged in market making activity for the subject company.
Reports based on technical and derivative analysis center on studying charts of a stock's price movement, outstanding positions and
trading volume, as opposed to focusing on a company's fundamentals and, as such, may not match with a report on a company's
fundamentals. Investors are advised to refer the Fundamental and Technical Research Reports available on our website to evaluate
the contrary view, if any.
The information in this document has been printed on the basis of publicly available information, internal data and other reliable
sources believed to be true, but we do not represent that it is accurate or complete and it should not be relied on as such, as this
document is for general guidance only. Angel One Limited or any of its affiliates/ group companies shall not be in any way responsible
for any loss or damage that may arise to any person from any inadvertent error in the information contained in this report. Angel One
Limited has not independently verified all the information contained within this document. Accordingly, we cannot testify, nor make
any representation or warranty, express or implied, to the accuracy, contents or data contained within this document. While Angel
One Limited endeavors to update on a reasonable basis the information discussed in this material, there may be regulatory,
compliance, or other reasons that prevent us from doing so.
This document is being supplied to you solely for your information, and its contents, information or data may not be reproduced,
redistributed or passed on, directly or indirectly.
Neither Angel One Limited, nor its directors, employees or affiliates shall be liable for any loss or damage that may arise from or in
connection with the use of this information. Angel or its associates or Research Analyst or his relative might have financial interest
in the subject company. Research analyst has not served as an officer, director or employee of the subject company.
