OCT 19, 2022
www.angelone.in
Technical & Derivatives Report
xOOOOOOOO
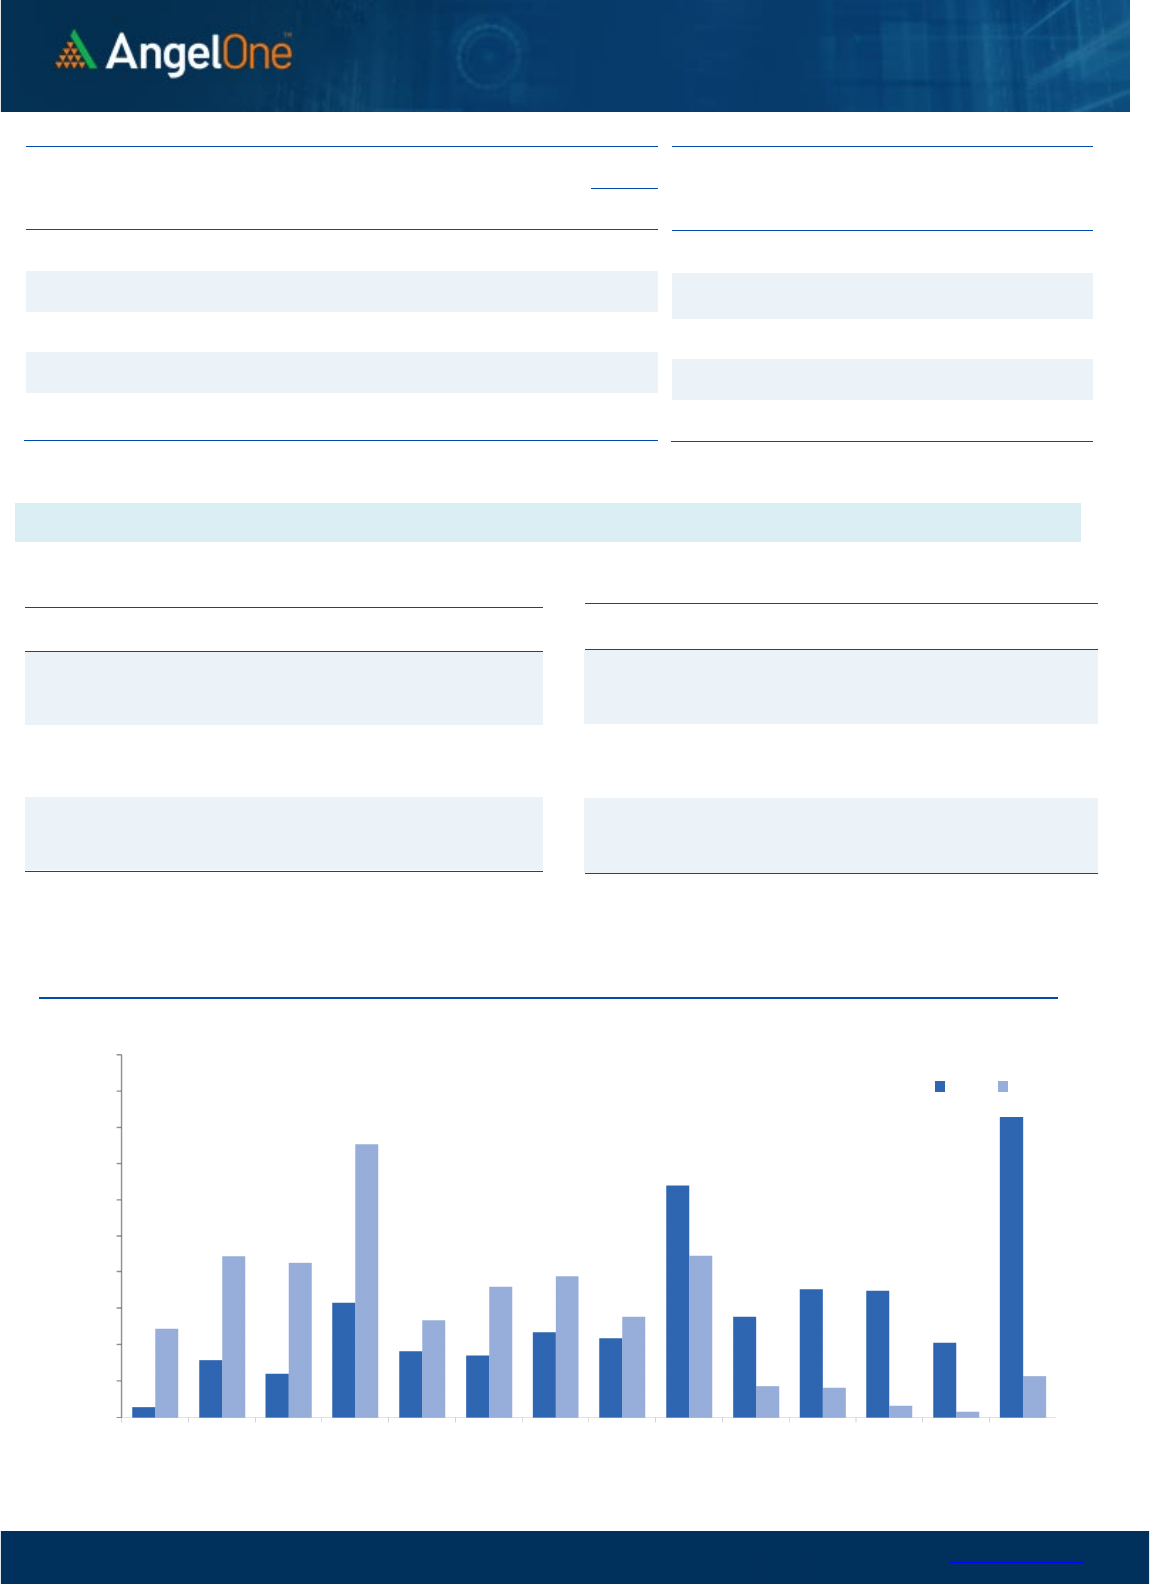
Nifty Bank Outlook (40319)
Bank Nifty started with a gap-up opening and post that there was
no major traction on the index front. The bank index oscillated
within a thin range of 200 points throughout the day and ended
with precise one percent gains a tad above 40300.
On the daily chart, the bank index has now crossed the 61.8%
retracement of the recent fall and by doing so technically it means
the uptrend has resumed. We have been upbeat since last week
and expect further leg of up move ahead of the festive days.
However, after the last few sessions of the smooth run, the action
has shifted towards stock-specific trades and the PSU Banking
space continued to remain in buzz. Traders are hence advised to
remain positive and focus on such opportunities, that can give
strong outperforming moves. As far as levels are concerned,
immediate support is placed at 40000 followed by 39800 levels. On
the flip side, 40650 and 40890 are the immediate resistance zone.
Key Levels
Support 1 – 40000 Resistance 1 – 40650
Support 2 – 39800 Resistance 2 – 40890
Exhibit 1: Nifty
Daily
Chart
Exhibit 2: Nifty Bank
Daily
Chart
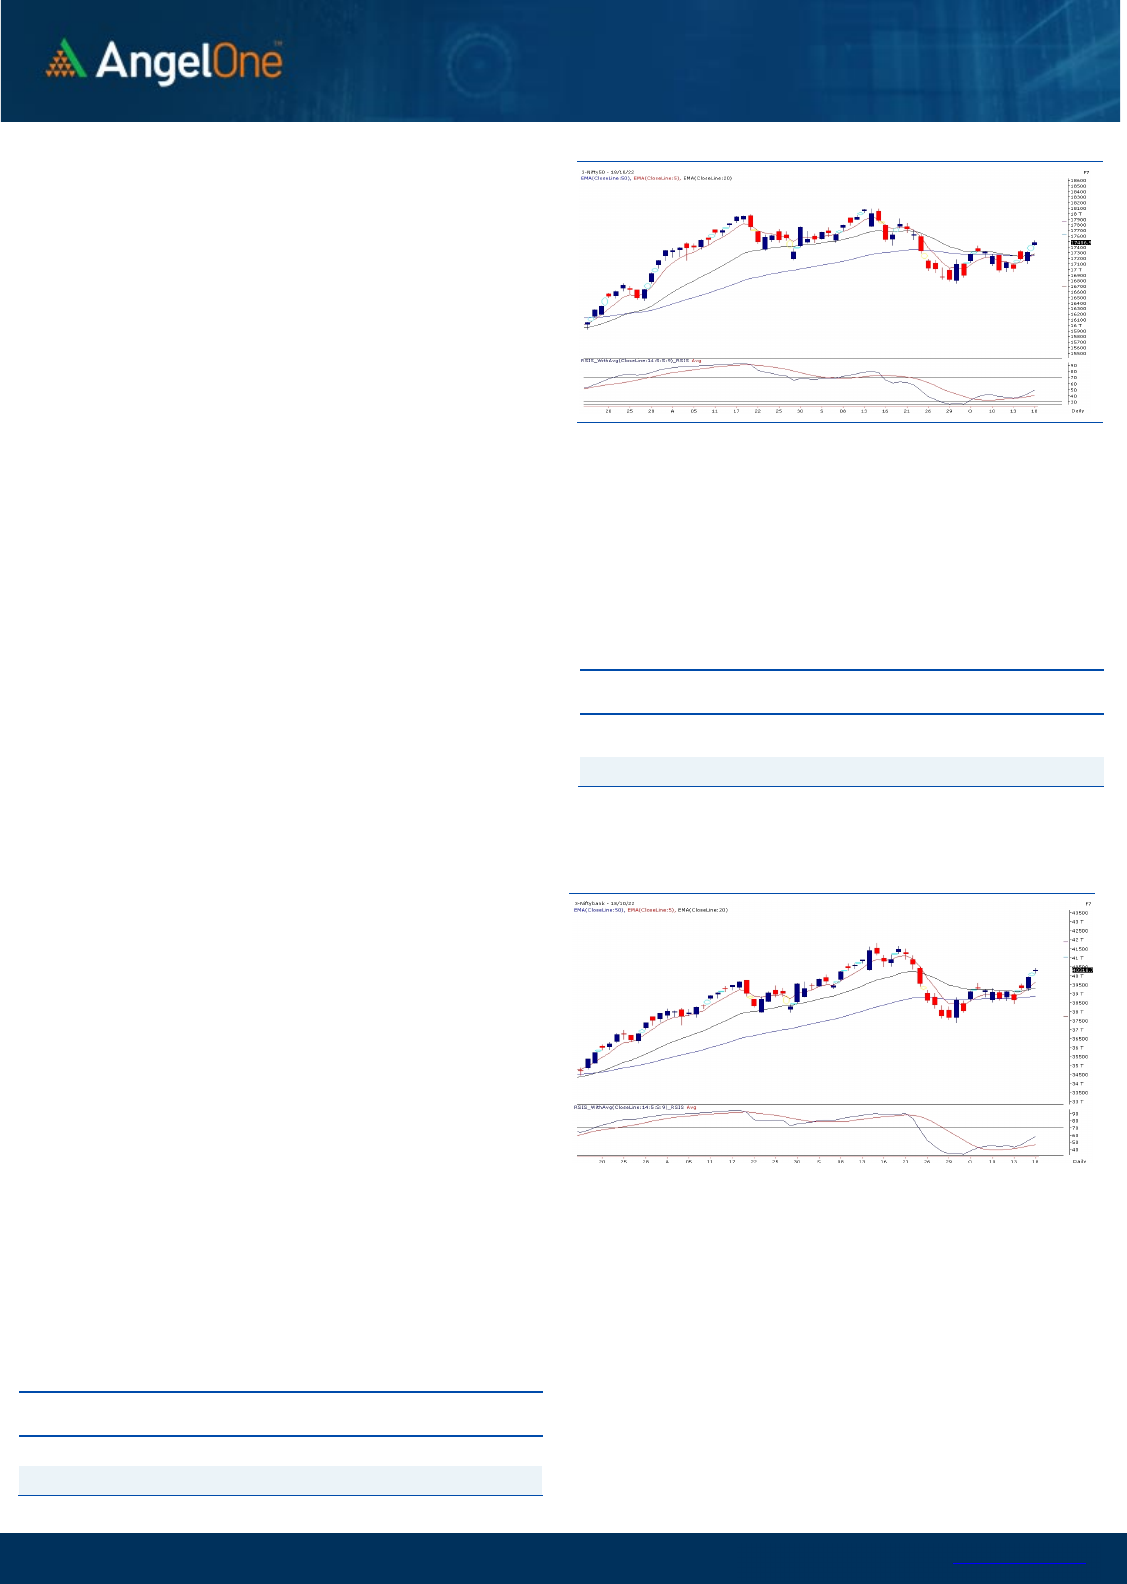
Sensex (58961) / Nifty (17487)
Globally, the tide seems to have turned upwards and hence, we
being the stronger markets, have started reaping the benefits of the
improved sentiments. Our benchmark index started the session
with a decent bump up above the 17400 mark. In the initial hour,
the gains extended to surpass 17500 by a small margin. Thereafter,
we witnessed consolidation for the remaining part of the session as
Nifty kept oscillating within the range of opening hour candle i.e.
merely 90 points. Eventually, Nifty concluded the session tad below
17500 by adding a percent to the previous close.
Our recent stance of staying hopeful around 17000 – 16800 has
played out well and with global markets rebounding in last couple
of sessions, has provided the much needed push for our markets to
elevate towards 17500 in merely two days. Now, since Nifty has
now crossed recent swing high of 17428 on a closing basis, we can
see confirmation of ‘1-2-3’ pattern on daily time frame chart. It’s a
sign of market coming out of the recent challenging phase and from
hereon, the bias should ideally be remained on the positive side
(which we have already maintained in anticipation).
If we meticulously observe the hourly chart, we can see prices
maintaining its position convincingly above 17400. Hence, going
ahead, the immediate support now should be considered
at 17400 – 17300 and any intraday decline should ideally be used
as a buying opportunity. On the flipside, 17650 and beyond levels
are clearly on cards. Traders are advised to remain sanguine and
try to identify the appropriate themes which are likely to
participate in the rally.
Key Levels
Support 1 – 17400 Resistance 1 – 17580
Support 2 – 17300 Resistance 2 – 17650

www.angelone.in
Technical & Derivatives Report
OCT 19, 2022
View
We had a positive start for the day which was then
followed by a range bound session for the index.
Nifty eventually ended tad below 17500.
FIIs were net sellers in the cash market segment to
the tune of Rs. 153 crores. Simultaneously, in Index
futures, they bought worth Rs. 2421 crores with a
decrease in open interest; indicating short covering in
yesterday’s session.
In derivatives front, we observed short covering in
both the key indices in yesterday’s consolidation. FIIs
as well covered some of their shorts as the ‘Long
Short Ratio has improved from 24% to 30%. As the
Index moved higher we witnessed call writers run for
cover now the next resistance is seen between 17600
– 17700 range whereas on the PUT side good amount
of buildup is seen at 17400 strike indicating an
immediate support. Going ahead we remain positive
however we sense outperforming opportunities are
likely to be seen outside the index and traders should
focus on the same.
Comments
The Nifty futures open interest has decreased by
7.83%. and Bank Nifty futures open interest has
decreased by 5.82% as the market closed at 17486.95.
The Nifty October future closed with a premium of
15.05 point against a premium of 11.50 point in the last
trading session. The November series closed at a
premium of 52 point.
The INDIA VIX decreased from 18.41 to 17.45. At the
same time, the PCR-OI of Nifty has increased from
1.11 to 1.19.
Few of the liquid counters where we have seen high
cost of carry are IDEA, WHIRLPOOL, ALKEM, FSL
AND RECLTD
Historical Volatility
SCRIP HV
MOTHERSON 51.01
BHEL 56.59
AARTIIND 42.91
POLYCAB 40.71
TVSMOTOR 38.74
Nifty Vs OI
16400
16600
16800
17000
17200
17400
17600
,0
2,000
4,000
6,000
8,000
10,000
12,000
14,000
16,000
18,000
9/29 10/3 10/6 10/10 10/12 10/14 10/18
Openinterest Nifty
OI Gainers
SCRIP OI
OI
CHG. (%)
PRICE
PRICE
CHG. (%)
MOTHERSON 101439000 37.82 63.90 -7.43
BHEL 161889000 19.17 68.20 8.31
INDIAMART 365550 15.33 4508.95 3.78
GUJGASLTD 8696250 13.45 476.30 1.22
TVSMOTOR 6753600 12.95 1129.05 4.64
HONAUT 21960 11.84 39871.80 4.13
MGL 3743200 9.81 796.35 0.38
LICHSGFIN 11974000 9.33 415.15 2.08
OI Losers
SCRIP OI
OI
CHG. (%)
PRICE
PRICE
CHG. (%)
AARTIIND 867850 -68.60 744.90 -5.85
CANFINHOME 6162000 -20.95 524.35 4.49
INFY 36802200 -6.59 1503.70 1.01
TATAMOTORS 78282375 -6.02 404.25 2.07
AUBANK 6155000 -5.68 625.60 1.99
BAJAJ-AUTO 2467500 -4.85 3611.15 -0.31
WHIRLPOOL 663950 -4.77 1600.65 3.22
LTI 1326450 -4.33 4722.40 1.93
Put-Call Ratio
SCRIP PCR (OI) PCR (VOL)
NIFTY 1.19 0.99
BANKNIFTY 1.19 1.00
RELIANCE 0.58 0.46
ICICIBANK 0.57 0.36
INFY 0.49 0.47
www.angelone.in
Technical & Derivatives Report
OCT 19, 2022
Note: Above mentioned Bullish or Bearish Spreads in Nifty (Oct Series) are given as an information and not as a recommendation.
Nifty Spot =
1
7
486.95
FII Statistics for
October
1
8
,
2022
Detail Buy
Contracts
Open
Interest
Value
(in Cr.)
Sell
Net
CHANGE
INDEX
FUTURES
5452.73 3031.28 2421.45
148637 13462.55 (10.76)
INDEX
OPTIONS
752095.39 753491.89 (1396.50) 1769931 161899.84 (2.12)
STOCK
FUTURES
17699.41 17103.93 595.48
2147907 147095.30 0.21
STOCK
OPTIONS
10527.85 10583.37 (55.52) 150310 10752.27 3.40
Total 785775.38
784210.47
1564.91
4216785
333209.96
(1.10)
Turnover on
October
1
7
, 2022
Instrument
No. of
Contracts
Turnover
( in Cr. )
Change
(%)
Index Futures
409340 37995.42 -18.15
Index Options
110242718 10213416.30
30.53
Stock Futures
833565 58322.29 -3.55
Stock Options
3118245 228087.99 -5.70
Total
31,18,245 228087.99 28.93
*Turnover data as per 17
th
Oct Closing
Bull-Call Spreads
Action Strike Price Risk Reward BEP
Buy
17500 176.80
51.65 48.35 17551.65
Sell
17600 125.15
Buy
17500 176.80
93.15 106.85 17593.15
Sell
17700 83.65
Buy
17600 125.15
41.50 58.50 17641.50
Sell 17700 83.65
Bear
-
Put Spreads
Action Strike Price Risk Reward BEP
Buy 17500 177.10
40.35 59.65 17459.65
Sell
17400 136.75
Buy 17500 177.10
73.80 126.20 17426.20
Sell 17300 103.30
Buy
17400 136.75
33.45 66.55 17366.55
Sell 17300 103.30
Nifty Put
-
Call Analysis
,0
500,000
1000,000
1500,000
2000,000
2500,000
3000,000
3500,000
4000,000
4500,000
5000,000
16700 16800 16900 17000 17100 17200 17300 17400 17500 17600 17700 17800 17900 18000
Call Put

www.angelone.in
Technical & Derivatives Report
OCT 19, 2022
`
Daily Pivot Levels for Nifty Constituents
Scrips
S2
S1
PIVOT
R1 R2
ADANIENT
3,198
3,241
3,269
3,313
3,341
ADANIPORTS 781 795
805
820
830
APOLLOHOSP
4,215
4,290
4,334
4,409
4,453
ASIANPAINT 3,191 3,209
3,229
3,247
3,267
AXISBANK
806
811
817 822
828
BAJAJ-AUTO 3,563 3,587
3,626
3,650 3,689
BAJFINANCE
7,271
7,331
7,380 7,440 7,489
BAJAJFINSV 1,701 1,713
1,725
1,738
1,749
BPCL 292 294
296
298
300
BHARTIARTL 762 773
779
790
796
BRITANNIA
3,717
3,742
3,773
3,798
3,830
CIPLA 1,102 1,114
1,122 1,134
1,142
COALINDIA
235
238
240
244
246
DIVISLAB 3,543 3,558
3,578 3,593
3,613
DRREDDY
4,317
4,337
4,355 4,375
4,394
EICHERMOT 3,496 3,554
3,588
3,646 3,680
GRASIM
1,669
1,679
1,690
1,699
1,710
HCLTECH 993 1,001
1,007
1,016
1,022
HDFCBANK
1,426
1,435
1,449
1,458
1,472
HDFCLIFE
520
526
529
535
538
HDFC
2,295
2,314
2,340 2,358 2,385
HEROMOTOCO 2,502 2,532
2,564 2,594
2,627
HINDALCO
387
390
394
397 401
HINDUNILVR
2,569
2,586
2,614
2,631
2,659
ICICIBANK
887
892
896
901
906
INDUSINDBK 1,193 1,208
1,218
1,234
1,244
INFY
1,490
1,497
1,504
1,511
1,518
ITC
331
336
338
343
346
JSW STEEL
628
632
635
640
643
KOTAKBANK
1,843
1,851
1,864
1,872
1,884
LT
1,876
1,897
1,914
1,935
1,952
M&M 1,218 1,236
1,252
1,270
1,285
MARUTI 8,680 8,744
8,816
8,880 8,952
NESTLEIND
18,830
19,109
19,269
19,548
19,708
NTPC
165
166
168
169
171
ONGC
127
128
128
129
130
POWERGRID 210 211
213
214
216
RELIANCE 2,402 2,427
2,445
2,469
2,488
SBILIFE 1,180 1,199
1,213 1,232
1,246
SBIN 541 552
558
568
574
SUNPHARMA 966 972
979
985
991
TCS 3,116 3,130
3,143
3,157
3,170
TATACONSUM
759 767
771
779
784
TATAMOTORS
398
401
404
407 410
TATASTEEL 99 100
100 101 102
TECHM
1,003
1,011
1,022
1,031
1,042
TITAN
2,601
2,621
2,643
2,663
2,685
ULTRACEMCO
6,207
6,277
6,360 6,430
6,514
UPL 675 678
684
687
693
WIPRO
375
377
381 383
387

www.angelone.in
Technical & Derivatives Report
OCT 19, 2022
*
Technical and Derivatives Team:
Sameet Chavan Chief Analyst – Technical & Derivatives sameet.chavan@angelone.in
Sneha Seth Senior Analyst – Technical & Derivatives sneha.seth@angelone.in
Rajesh Bhosale Technical Analyst rajesh.bhosle@angelone.in
Osho Krishan Senior Analyst – Technical & Derivatives osho.krishan@angelone.in
Research Team Tel: 022 – 39357600 Website: www.angelone.in
For Technical Queries E-mail: technicalresearch-cso@angelone.in
For Derivatives Queries E-mail: derivatives.desk@angelone.in
DISCLAIMER
Angel One Limited (hereinafter referred to as “Angel”) is a registered Member of National Stock Exchange of India Limited, Bombay
Stock Exchange Limited and Metropolitan Stock Exchange Limited. It is also registered as a Depository Participant with CDSL and
Portfolio Manager and investment advisor with SEBI. It also has registration with AMFI as a Mutual Fund Distributor. Angel One
Limited is a registered entity with SEBI for Research Analyst in terms of SEBI (Research Analyst) Regulations, 2014 vide registration
number INH000000164. Angel or its associates has not been debarred/ suspended by SEBI or any other regulatory authority for
accessing /dealing in securities Market.
This document is solely for the personal information of the recipient, and must not be singularly used as the basis of any investment
decision. Nothing in this document should be construed as investment or financial advice. Each recipient of this document should
make such investigations as they deem necessary to arrive at an independent evaluation of an investment in the securities of the
companies referred to in this document (including the merits and risks involved), and should consult their own advisors to determine
the merits and risks of such an investment.
Angel or its associates or research analyst or his relative may have actual/beneficial ownership of 1% or more in the securities of
the subject company at the end of the month immediately preceding the date of publication of the research report. Neither Angel or
its associates nor Research Analysts or his relative has any material conflict of interest at the time of publication of research report.
Angel or its associates might have received any compensation from the companies mentioned in the report during the period
preceding twelve months from the date of this report for services in respect of managing or co-managing public offerings, corporate
finance, investment banking or merchant banking, brokerage services or other advisory service in a merger or specific transaction
in the normal course of business. Angel or its associates did not receive any compensation or other benefits from the companies
mentioned in the report or third party in connection with the research report. Neither Angel nor its research analyst entity has been
engaged in market making activity for the subject company.
Reports based on technical and derivative analysis center on studying charts of a stock's price movement, outstanding positions and
trading volume, as opposed to focusing on a company's fundamentals and, as such, may not match with a report on a company's
fundamentals. Investors are advised to refer the Fundamental and Technical Research Reports available on our website to evaluate
the contrary view, if any.
The information in this document has been printed on the basis of publicly available information, internal data and other reliable
sources believed to be true, but we do not represent that it is accurate or complete and it should not be relied on as such, as this
document is for general guidance only. Angel One Limited or any of its affiliates/ group companies shall not be in any way responsible
for any loss or damage that may arise to any person from any inadvertent error in the information contained in this report. Angel One
Limited has not independently verified all the information contained within this document. Accordingly, we cannot testify, nor make
any representation or warranty, express or implied, to the accuracy, contents or data contained within this document. While Angel
One Limited endeavors to update on a reasonable basis the information discussed in this material, there may be regulatory,
compliance, or other reasons that prevent us from doing so.
This document is being supplied to you solely for your information, and its contents, information or data may not be reproduced,
redistributed or passed on, directly or indirectly.
Neither Angel One Limited, nor its directors, employees or affiliates shall be liable for any loss or damage that may arise from or in
connection with the use of this information. Angel or its associates or Research Analyst or his relative might have financial interest
in the subject company. Research analyst has not served as an officer, director or employee of the subject company.
