SEPT 19, 2022
www.angelone.in
Technical & Derivatives Report
xOOOOOOOO
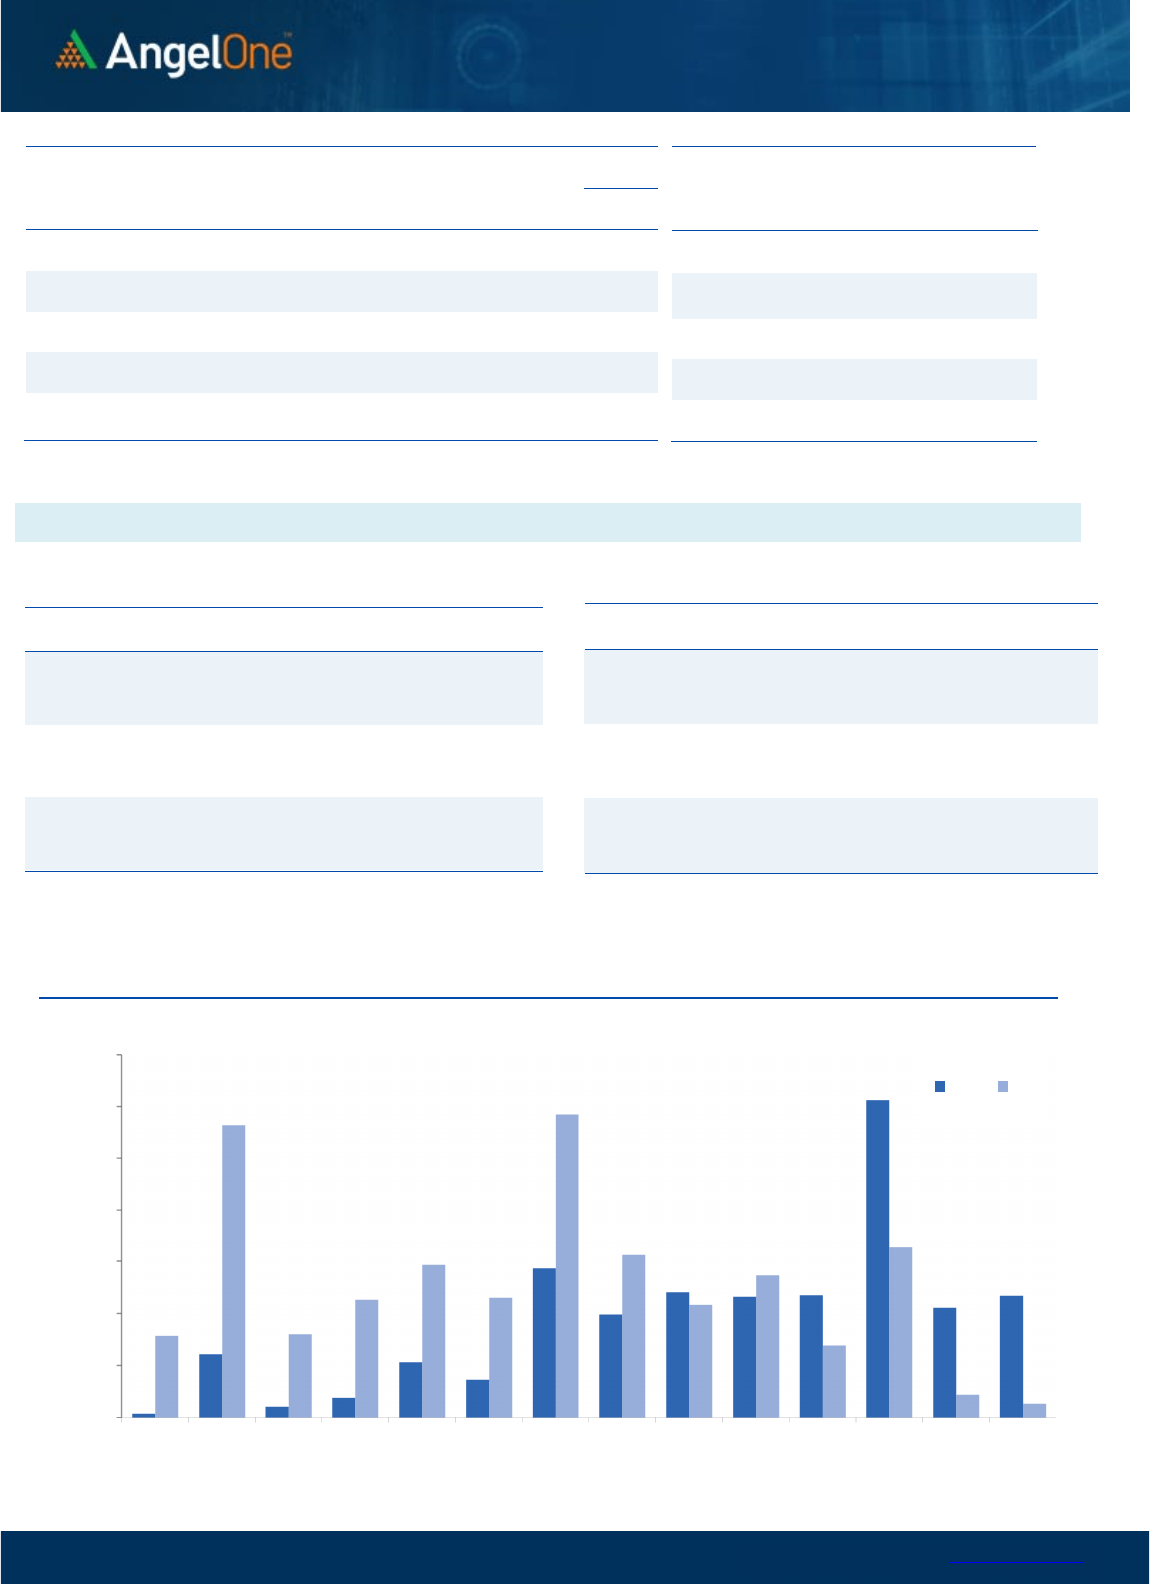
Nifty Bank Outlook (40777)
The banking space has witnessed an action-packed move during
the last week, wherein the spectacular start of the week pared
down in the last two trading sessions. However, on the weekly
basis, the Bank Nifty index managed to continue its positive stature
and even outperformed the benchmark index. The index concluded
the week with a gain of 0.89 percent and settled at 40777 levels.
On the technical aspect, though, the banking index has maintained
its uptrend for the fourth consecutive week, with last two days’ of
a profit booking, the weekly chart now depicts a ‘Shooting Star’
Japanese candlestick pattern. Since it has formed exactly at record
highs, it would be unfair to overlook it. At this juncture, we are
hoping for this pattern to not get activated, so that we can certainly
be spared from the real repercussions of it. As far as levels are
concerned, 40200 – 40000 are to be considered as key levels. A
weekly close below this would certainly damage the recent bullish
structure. On the flip side, until we witness a decisive breach above
the 41800 zone, a range-bound move could be seen in the
comparable period.
Key Levels
Support 1 – 40200 Resistance 1 – 41000
Support 2 – 40000 Resistance 2 – 41800
Exhibit 1: Nifty
Daily
Chart
Exhibit 2: Nifty Bank
Weekly
Chart
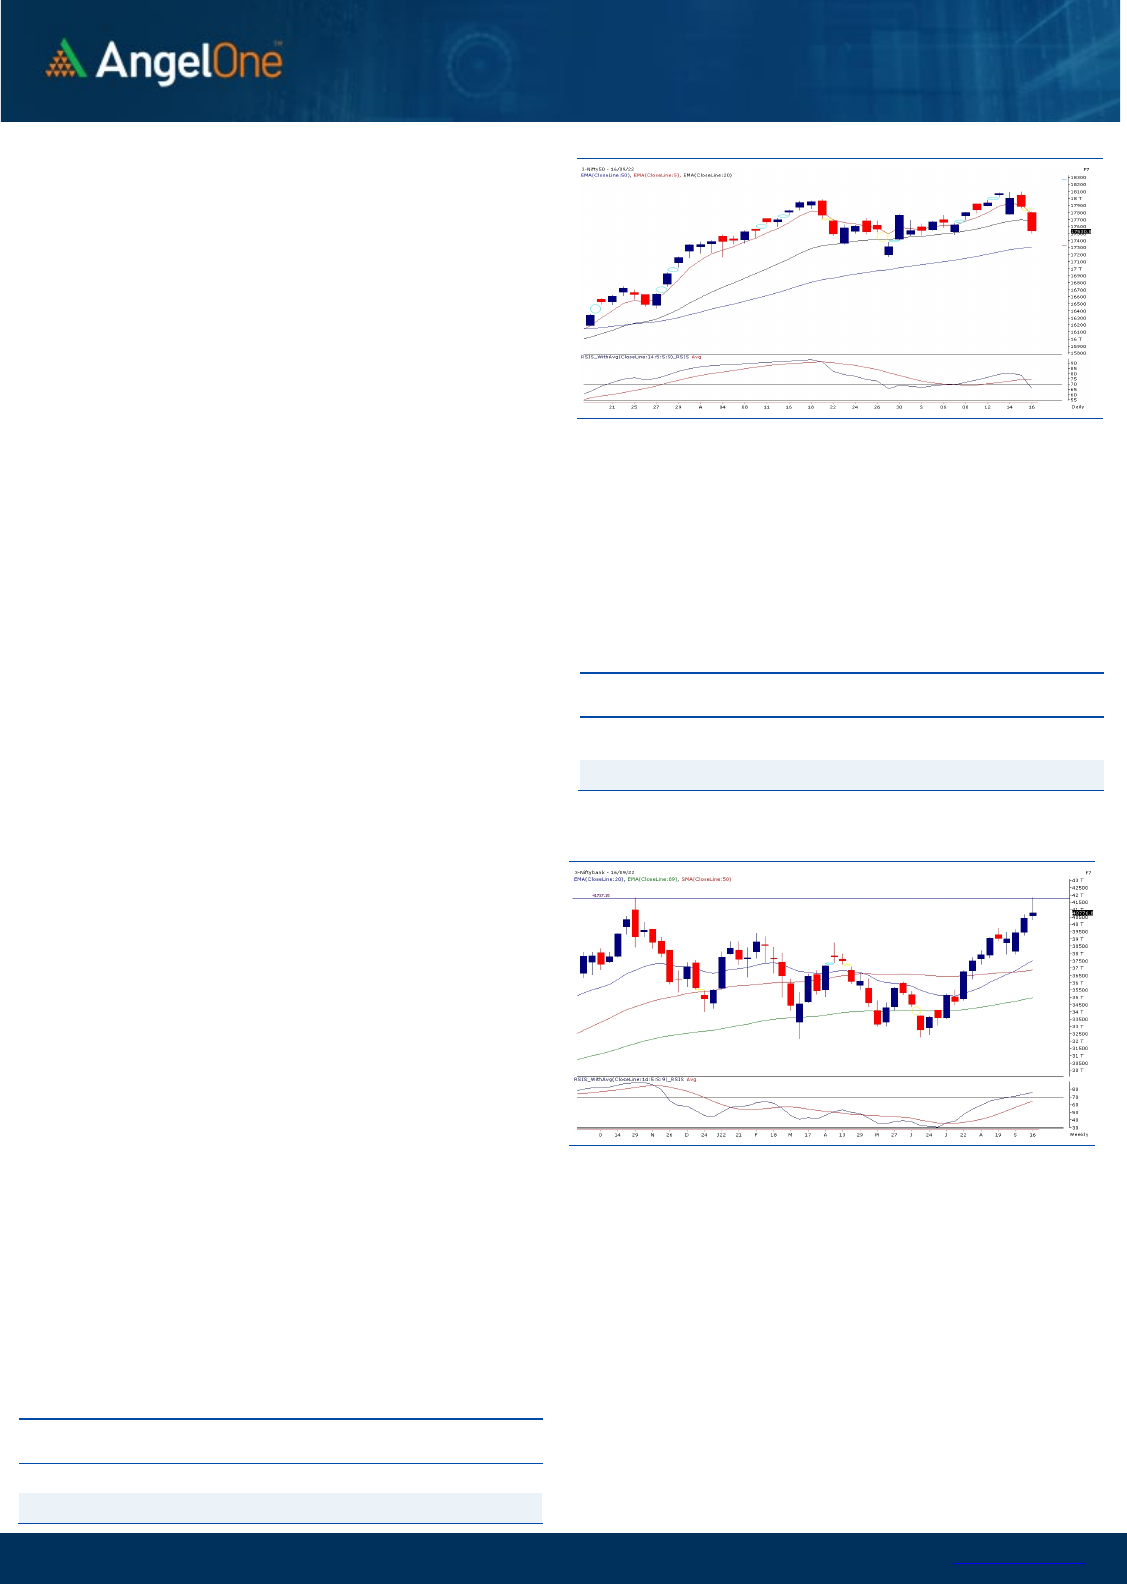
Sensex (58841) / Nifty (17531)
Friday’s session turned out to be a nightmare as after a gap down
opening, we witnessed a sustained selling throughout the session to
conclude the week with 1.70% cut, marginally above 17500.
Generally, we say ‘All’s well that ends well’ but this time it’s the
exact opposite. We had a perfect start of the week, but the end was
certainly not everyone would have wished for. The broader
structure remains bullish but with Nifty closing convincingly below
17600 has dented the intermediate structure for sure. Pricewise, it
resembles a ‘Head and Shoulder’ pattern on daily time frame chart,
which does not augur well for the bulls. If this pattern proves its
significance, we may see further correction towards 17200 – 17000
in this week. But as of now, we do not want to fall into this camp.
We would rather reassess the situation in the first half of this week.
As far as support is concerned, 17400 we are seeing as a key
support. The moment we see Nifty sliding below it, we may see
correction getting extended in the market. On the flipside, if Nifty
has to find its mojo back, it needs to go beyond Friday’s high of
17820 on a closing basis. So meanwhile, any minor bounce back
towards 17650 – 17750 should ideally be used to exit longs.
After Friday’s close, we would like to adopt a wait and watch
approach and let’s see how global market perform from hereon.
Traders are advised not to get intimidated by Friday’s correction,
rather keep a close tab on above mentioned scenarios. Also, one
should avoid trading aggressively till the time market stabilizes
from this turbulence. Sectorally, the recent leader, BANKNIFTY is
placed at an interesting juncture. Hopefully, it manages to lift the
overall sentiments in this week.
Key Levels
Support 1 – 17400 Resistance 1 – 17650
Support 2 – 17200 Resistance 2 – 17750

www.angelone.in
Technical & Derivatives Report
SEPT 19, 2022
View
The Indian equity market has seen a roller coaster
week, wherein the pleasant start pared down in the
latter half. Eventually, the selloff aggravated in the last
trading session, and the benchmark index slipped into
red to settle near the 17500 zone.
FIIs were net sellers in the cash market segment to
the tune of Rs. 3260 crores. Simultaneously, in Index
futures, they bought worth Rs. 837 crores with a mere
increase in open interest, indicating long formation.
There have been mixed positions in the F&O space
throughout the week, as we witnessed strong long
formation followed by unwinding by the weekend. On
the options front, piling up of positions is visible in the
17500-17400 put strikes, indicating nearby support
formation, while any further breach could disrupt the
sentiments. While on the higher end, 17800 call strike
have seen piling up of positions, followed by maximum
OI concentration at 18000 call strike. Meanwhile, the
stronger hands expanded their ‘Long Short Ratio’,
which surged to 28% from 22% WoW. Considering the
recent price action, it is advisable to keep a close tab
on the mentioned levels and stay abreast with global
developments.
Comments
The Nifty futures open interest has decreased by
4.74%. and Bank Nifty futures open interest has
decreased by 8.21% as the market closed at 17530.85.
The Nifty Sep future closed with a premium of 35.30
point against a premium of 14.40 point in the last
trading session. The Oct series closed at a premium
of 92.45 point.
The INDIA VIX increased from 18.39 to 19.82. At the
same time, the PCR-OI of Nifty has decreased from
0.95 to 0.76.
Few of the liquid counters where we have seen high
cost of carry are MRF, COLPAL, BALKRISIND,
AMARAJABAT and TATACONSUM.
Historical Volatility
SCRIP HV
IDEA 81.66
RBLBANK 72.83
IBULHSGFIN 73.12
ZEEL 64.13
HINDCOPPER 62.91
Nifty Vs OI
17300
17400
17500
17600
17700
17800
17900
18000
18100
18200
8,000
9,000
10,000
11,000
12,000
13,000
14,000
15,000
16,000
17,000
18,000
9/1 9/5 9/7 9/9 9/13 9/15
Openinterest Nifty
OI Gainers
SCRIP OI
OI
CHG. (%)
PRICE
PRICE
CHG. (%)
INDIACEM 19676500 30.51 266.10 -1.43
DELTACORP 19814500 12.51 225.55 1.82
MUTHOOTFIN 6947250 9.27 1033.40 -3.01
ULTRACEMCO 2384500 7.79 6481.40 -4.61
CHOLAFIN 7428750 6.70 768.60 -3.07
HONAUT 14865 5.99 40415.80 -3.51
GODREJCP 6031000 5.18 890.15 -4.00
IOC 108020250 4.96 69.95 -2.44
OI Losers
SCRIP OI
OI
CHG. (%)
PRICE
PRICE
CHG. (%)
VEDL 29990950 -16.15 290.75 -7.51
ACC 4706000 -10.97 2611.60 -4.91
COROMANDEL 1397900 -9.68 1013.75 -1.54
ONGC 47231800 -8.36 131.25 -1.09
EICHERMOT 3414250 -7.27 3549.05 -1.78
POWERGRID 42446700 -7.10 235.65 -0.76
NTPC 74898000 -6.83 172.80 -1.34
IBULHSGFIN 39440000 -6.69 127.25 -7.12
Put-Call Ratio
SCRIP PCR (OI) PCR (VOL)
NIFTY 0.76 0.83
BANKNIFTY 0.79 1.07
RELIANCE 0.46 0.41
ICICIBANK 0.68 0.85
INFY 0.34 0.47
www.angelone.in
Technical & Derivatives Report
SEPT 19, 2022
Note: Above mentioned Bullish or Bearish Spreads in Nifty (Sep Series) are given as an information and not as a recommendation.
Nifty Spot =
1
7
,
530
.
85
FII Statistics for
September
1
6
, 2022
Detail Buy
Contracts
Open
Interest
Value
(in Cr.)
Sell
Net
CHANGE
INDEX
FUTURES
6199.45 5361.80 837.65
133422 12308.49 4.09
INDEX
OPTIONS
739031.71 732168.28 6863.43
1487004 135083.93 44.62
STOCK
FUTURES
16933.64 20400.43 (3466.79) 2183607 152289.28 1.05
STOCK
OPTIONS
13769.97 13659.03 110.94
206977 14823.60 3.06
Total 775934.77
771589.54
4345.23
4011010
314505.30
14.01
Turnover on
September
1
6
, 2022
Instrument
No. of
Contracts
Turnover
( in Cr. )
Change
(%)
Index
Futures
524718 49303.69 10.71
Index
Options
92541081
8884099.42 -73.70
Stock
Futures
1320798 96451.16 31.18
Stock
Options
4816673 374350.14 17.81
Total
48,16,673
374350.14 -72.52
Bull-Call Spreads
Action Strike Price Risk Reward BEP
Buy
17500 293.70
51.35
48.65
17551.35
Sell
17600 242.35
Buy
17500 293.70
98.90
101.10
17598.90
Sell
17700 194.80
Buy
17600 242.35
47.55 52.45 17647.55
Sell 17700 194.80
Bear
-
Put Spreads
Action Strike Price Risk Reward BEP
Buy 17500 229.00
41.90
58.10
17458.10
Sell
17400 187.10
Buy 17500 229.00
75.60
124.40
17424.40
Sell 17300 153.40
Buy
17400 187.10
33.70 66.30 17366.30
Sell 17300 153.40
Nifty Put
-
Call Analysis
,0
500,000
1000,000
1500,000
2000,000
2500,000
3000,000
3500,000
16900 17000 17100 17200 17300 17400 17500 17600 17700 17800 17900 18000 18100 18200
Call Put

www.angelone.in
Technical & Derivatives Report
SEPT 19, 2022
`
Daily Pivot Levels for Nifty Constituents
Scrips
S2
S1
PIVOT
R1 R2
ADANIPORTS
897
917
947
968
997
APOLLOHOSP
4,194
4,237
4,300
4,343
4,406
ASIANPAINT 3,240 3,281
3,351
3,392
3,461
AXISBANK 770 779
786
796
803
BAJAJ-AUTO 3,598 3,644
3,722
3,768
3,846
BAJFINANCE 7,030 7,152
7,316
7,438
7,602
BAJAJFINSV 1,671 1,703
1,744
1,776
1,818
BPCL
313
317
324
329
336
BHARTIARTL 770 775
781 786
793
BRITANNIA 3,547 3,593
3,667
3,714 3,788
CIPLA
1,020
1,032
1,046
1,058
1,072
COALINDIA 227 229
232
234
236
DIVISLAB 3,525 3,549
3,585 3,609
3,644
DRREDDY 3,984 4,030
4,108
4,155
4,232
EICHERMOT 3,463 3,506
3,573 3,616 3,683
GRASIM
1,679
1,712
1,759
1,792
1,839
HCLTECH
878
888
903
912
927
HDFCBANK
1,465
1,479
1,497
1,511
1,529
HDFCLIFE
530
538
554
562
577
HDFC
2,363
2,383
2,414
2,435 2,465
HEROMOTOCO 2,586 2,635
2,720
2,770
2,854
HINDALCO 396 404
414 423
433
HINDUNILVR 2,492 2,510
2,537
2,555 2,582
ICICIBANK
898
904
911
916
923
INDUSINDBK 1,155 1,191
1,221 1,257
1,287
INFY
1,333
1,355
1,390
1,412
1,447
ITC 327 329
332
334
337
JSW STEEL
671
678
686
694
702
KOTAKBANK
1,870
1,900
1,940
1,970
2,010
LT
1,889
1,904
1,931 1,946
1,973
M&M 1,198 1,224
1,261 1,287
1,323
MARUTI 8,879 9,035
9,175
9,330
9,471
NESTLEIND 17,916 18,160
18,585
18,829
19,253
NTPC
170
171
173
175
176
ONGC
129
130
131
132
133
POWERGRID
231
233
236
238 241
RELIANCE 2,452 2,476
2,514
2,538
2,576
SBILIFE
1,243
1,258
1,280
1,295
1,317
SHREECEM
22,676
22,997
23,532 23,853
24,388
SBIN
552
557
565
570
579
SUNPHARMA
850
859
875
884
899
TCS 2,940 2,974
3,034 3,069
3,129
TATACONSUM
760
778
809
826
857
TATAMOTORS 419 426
436
443
453
TATASTEEL 104 105
106
107
109
TECHM 999 1,016
1,045
1,062
1,091
TITAN 2,558 2,585
2,631
2,658 2,705
ULTRACEMCO
6,216
6,349
6,584
6,716
6,951
UPL
664
684
719
738
773
WIPRO 392 397
405
410 417

www.angelone.in
Technical & Derivatives Report
SEPT 19, 2022
*
Technical and Derivatives Team:
Sameet Chavan Chief Analyst – Technical & Derivatives sameet.chavan@angelone.in
Sneha Seth Senior Analyst – Technical & Derivatives sneha.seth@angelone.in
Rajesh Bhosale Technical Analyst rajesh.bhosle@angelone.in
Osho Krishan Senior Analyst – Technical & Derivatives osho.krishan@angelone.in
Research Team Tel: 022 – 39357600 Website: www.angelone.in
For Technical Queries E-mail: technicalresearch-cso@angelone.in
For Derivatives Queries E-mail: derivatives.desk@angelone.in
DISCLAIMER
Angel One Limited (hereinafter referred to as “Angel”) is a registered Member of National Stock Exchange of India Limited, Bombay
Stock Exchange Limited and Metropolitan Stock Exchange Limited. It is also registered as a Depository Participant with CDSL and
Portfolio Manager and investment advisor with SEBI. It also has registration with AMFI as a Mutual Fund Distributor. Angel One
Limited is a registered entity with SEBI for Research Analyst in terms of SEBI (Research Analyst) Regulations, 2014 vide registration
number INH000000164. Angel or its associates has not been debarred/ suspended by SEBI or any other regulatory authority for
accessing /dealing in securities Market.
This document is solely for the personal information of the recipient, and must not be singularly used as the basis of any investment
decision. Nothing in this document should be construed as investment or financial advice. Each recipient of this document should
make such investigations as they deem necessary to arrive at an independent evaluation of an investment in the securities of the
companies referred to in this document (including the merits and risks involved), and should consult their own advisors to determine
the merits and risks of such an investment.
Angel or its associates or research analyst or his relative may have actual/beneficial ownership of 1% or more in the securities of
the subject company at the end of the month immediately preceding the date of publication of the research report. Neither Angel or
its associates nor Research Analysts or his relative has any material conflict of interest at the time of publication of research report.
Angel or its associates might have received any compensation from the companies mentioned in the report during the period
preceding twelve months from the date of this report for services in respect of managing or co-managing public offerings, corporate
finance, investment banking or merchant banking, brokerage services or other advisory service in a merger or specific transaction
in the normal course of business. Angel or its associates did not receive any compensation or other benefits from the companies
mentioned in the report or third party in connection with the research report. Neither Angel nor its research analyst entity has been
engaged in market making activity for the subject company.
Reports based on technical and derivative analysis center on studying charts of a stock's price movement, outstanding positions and
trading volume, as opposed to focusing on a company's fundamentals and, as such, may not match with a report on a company's
fundamentals. Investors are advised to refer the Fundamental and Technical Research Reports available on our website to evaluate
the contrary view, if any.
The information in this document has been printed on the basis of publicly available information, internal data and other reliable
sources believed to be true, but we do not represent that it is accurate or complete and it should not be relied on as such, as this
document is for general guidance only. Angel One Limited or any of its affiliates/ group companies shall not be in any way responsible
for any loss or damage that may arise to any person from any inadvertent error in the information contained in this report. Angel One
Limited has not independently verified all the information contained within this document. Accordingly, we cannot testify, nor make
any representation or warranty, express or implied, to the accuracy, contents or data contained within this document. While Angel
One Limited endeavors to update on a reasonable basis the information discussed in this material, there may be regulatory,
compliance, or other reasons that prevent us from doing so.
This document is being supplied to you solely for your information, and its contents, information or data may not be reproduced,
redistributed or passed on, directly or indirectly.
Neither Angel One Limited, nor its directors, employees or affiliates shall be liable for any loss or damage that may arise from or in
connection with the use of this information. Angel or its associates or Research Analyst or his relative might have financial interest
in the subject company. Research analyst has not served as an officer, director or employee of the subject company.
