May 19, 2022
www.angelone.in
Technical & Derivatives Report
Nifty Bank Outlook
-
(34164)
Following the rub-off effect of Tuesday's strong upmove, the
bank nifty started on a positive note and then went on to make
an intraday high of 34655 during the first hour. However, a
follow-up move was missing that resulted bank index to pared-
down all morning gains. Eventually, after trading with choppy
moves in a range, the bank nifty finally ended with a loss of
0.40% at 34164.
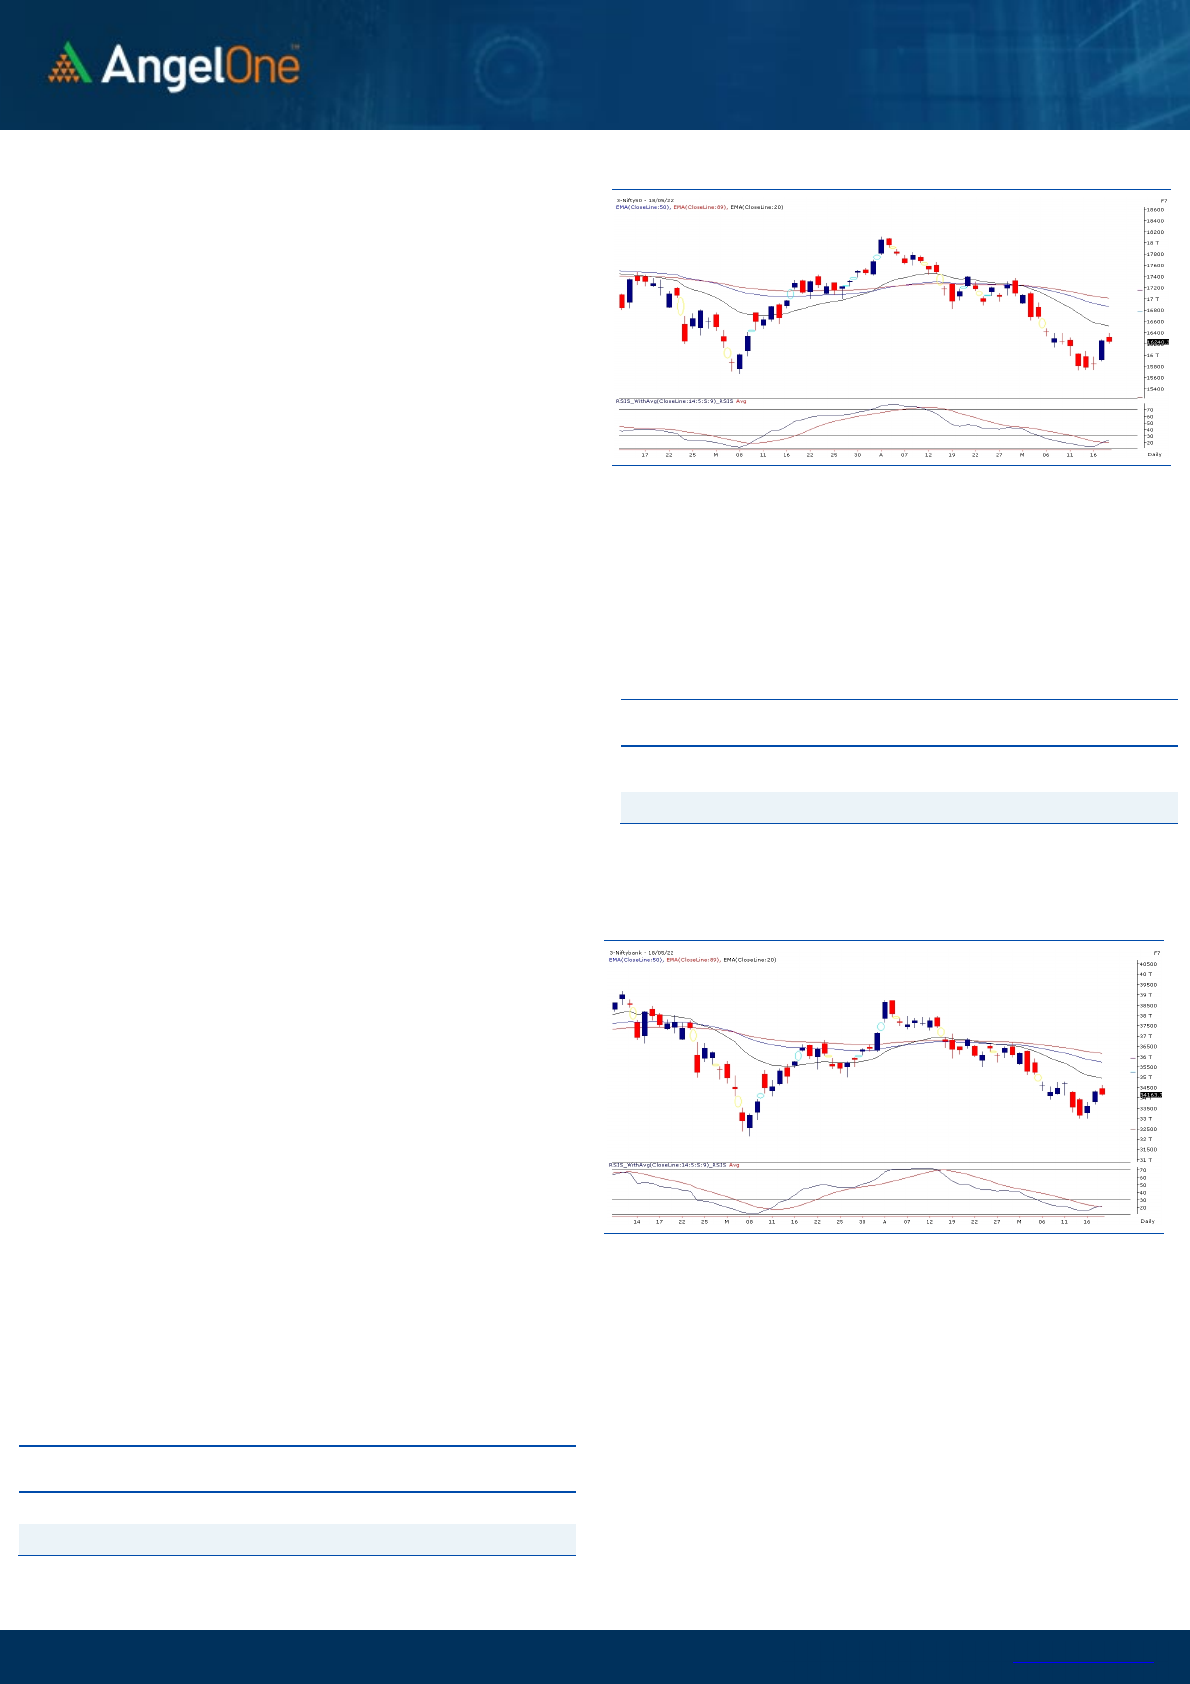
On the daily chart, price wise there's no major change however
if we observe the RSI Smoothed then we can observe a buy
crossover with the indicator still in the oversold zone. This
augurs well for the bull and hence we remain positive to suggest
traders to use intraday dips on the weekly expiry as a buying
opportunity. As far as levels are concerned, immediate support
is seen at 34000 followed by 33600 levels on the flip side, 34600
- 34800 seems like a key intermediate hurdle.
Key Levels
Support 1 – 34000 Resistance 1 – 34800
Support 2 – 33800 Resistance 2 – 35000
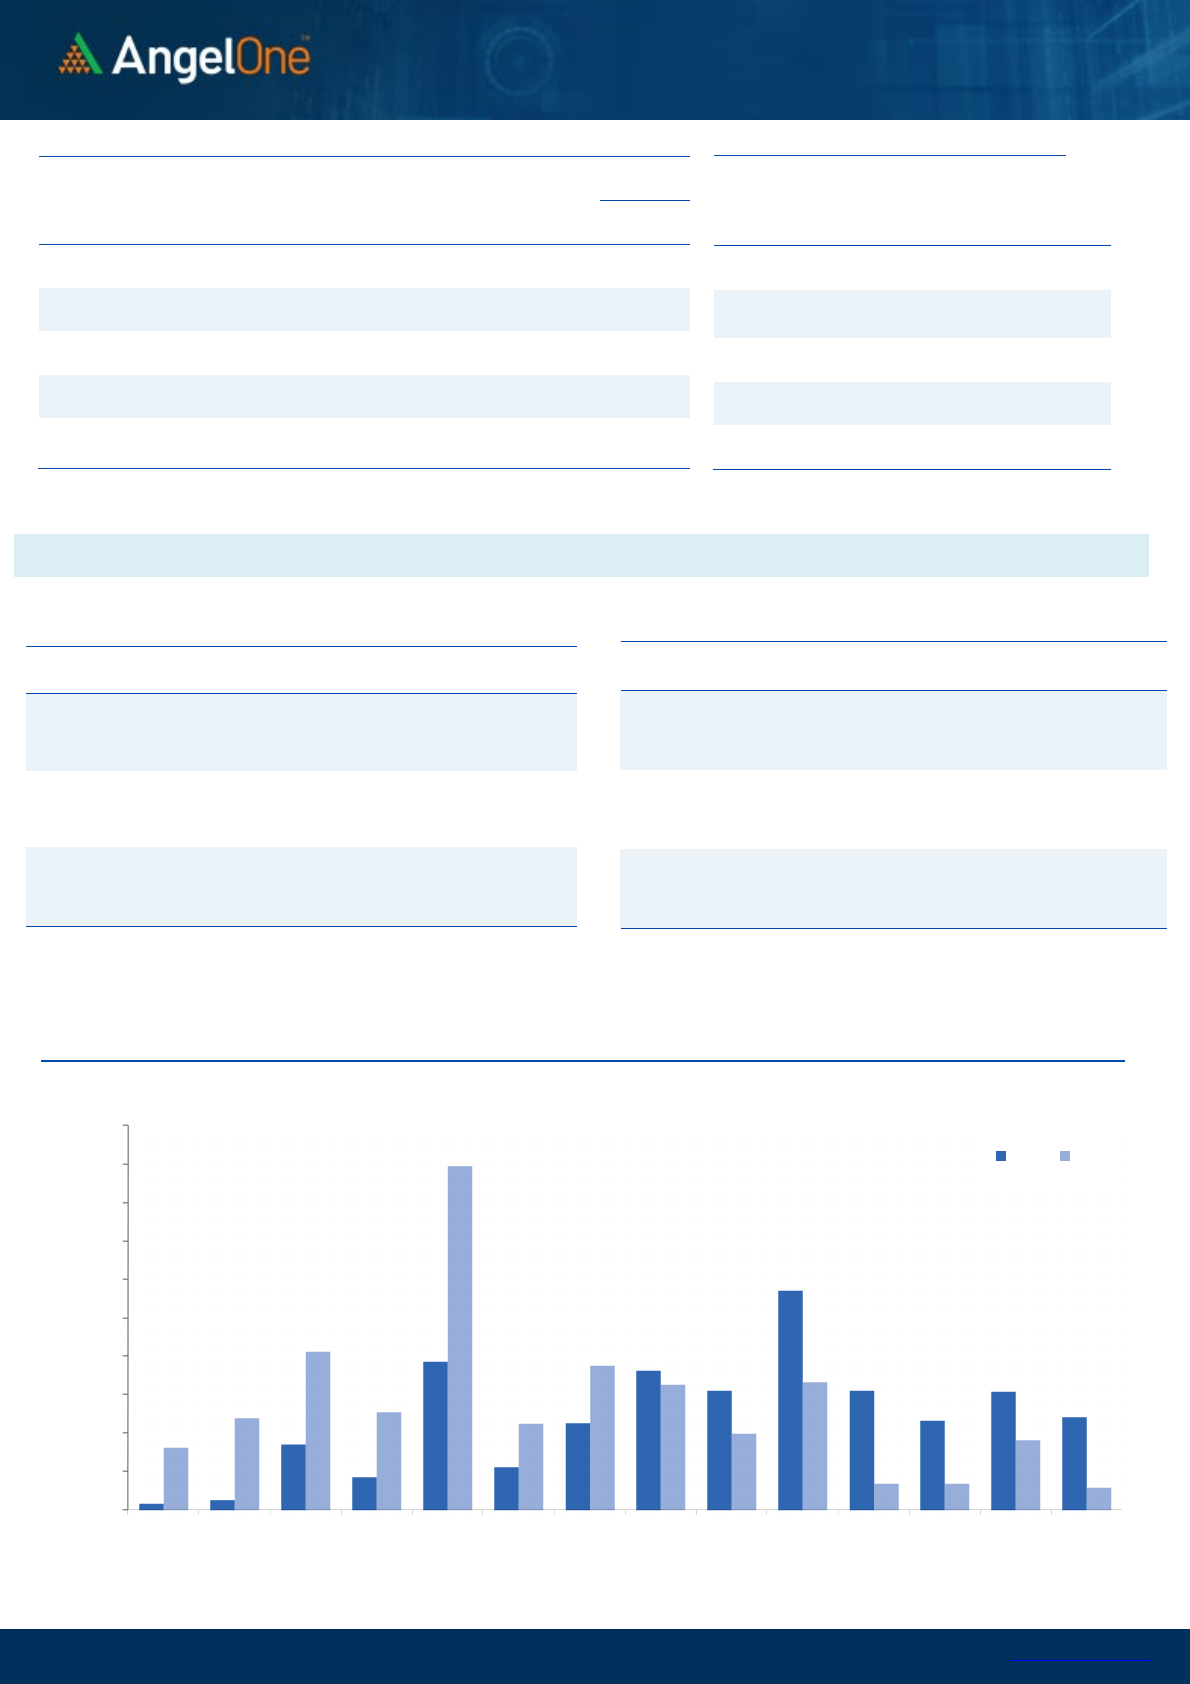
Exhibit 1: Nifty Daily Chart
Exhibit 2: Nifty Bank Daily Chart
Sensex (54209) / Nifty (16240)
Tuesday’s massive rally was followed by yet another gap up
opening with modest gains. We clearly shrugged off the global
cues as the SGX Nifty was indicating a sluggish start in the
morning. In the initial trades, Nifty extended its gains towards
16400, but failed to sustain at higher levels. Around the
midsession, Key indices pared down all gains and slipped
marginally in the red. Fortunately, a smart recovery immediately
post the midsession pulled Nifty back to 16350, which again got
sold into to conclude the choppy session on a flat note.
Since the overall global picture has not changed yet, our market
was unable to keep up the same momentum as we witnessed
during Tuesday’s short covering move. Traders chose to take
some money off the table after reaching the key resistance zone
of 16400 – 16500. Now although, we witnessed a sharp sell-off in
the U.S. markets overnight, we expect buying to emerge at lower
levels till the time Nifty holds its sacrosanct support zone
of 16100 - 16000. Traders can certainly take a punt as close as
possible to 16050 – 16000 on the expiry session. On the flipside,
strong resistance continues to be seen around the higher range
of 16400 – 16500. The real strength will come back in our market
only after surpassing the sturdy wall of 16500 – 16600, till then it
would be a prudent strategy to adopt ‘One step at a time’
strategy.
Yesterday
, there wasn’t much sectoral participation seen in
the market; but the FMCG space stood out and some of the
heavyweights like, HINDUNILVR are poised for some decent
moves. Also, one can focus on banking and metal counters
which are likely to perform well if there is positive
development in the global cues.
Key Levels
Support 1 – 16050 Resistance 1 – 16400
Support 2 – 16000 Resistance 2 – 16500

www.angelone.in
Technical & Derivatives Report
May 19, 2022
View
Our market has witnessed a choppy session and
concluded the day on a subdued note ahead of the
weekly expiry. The benchmark index Nifty50 settled
the day with a mere loss of 0.12 percent.
FIIs were net sellers in the cash market segment
to the tune of Rs. 1255 crores. Simultaneously, in
Index futures, they bought worth Rs. 62 crores
with a mere increase in open interest, indicating
some long formation.
Looking at the F&O data, we have have witnessed
long unwinding in both the indices. On the options
front, a pile-up is visible in the 16200 Put strike in
the options segment, followed by a significant
concentration built up in 16000 PE. While on the
contrary, a considerable OI concentration is built on
the 16400-16500 call strikes, indicating a tentative
range in the market for the near term. Considering
the recent price action, the sentiments are likely to
remain upbeat, and any correction towards the
support zone could be seen as an opportunity to go
long. Traders can look to buy the ATM Call option as
close as possible to the support level and try to
lighten up around the higher end on the expiry day.
Comments
The Nifty futures open interest has decreased by 3.85%.
and BANK Nifty futures open interest has decreased by
8.65% as the market closed at 16240.30.
The Nifty May future closed with a discount of 14.25 point
against a discount of 4.35 point in the last trading
session. The June series closed at a discount of 9.90
point.
The INDIA VIX decreased from 22.74 to 22.29. At the
same time, the PCR-OI of Nifty decreased from 1.12 to
0.87.
Few of the liquid counters where we have seen high
cost of carry are METROPOLIS, IOC, PETRONET,
LALPATHLAB and POWERGRID.
Historical Volatility
SCRIP HV
IDEA 94.86
IBULHSGFIN 78.60
ZEEL 71.92
HINDCOPPER 67.76
RBLBANK 66.66
Nifty Vs OI
15000
15500
16000
16500
17000
17500
,0
2,000
4,000
6,000
8,000
10,000
12,000
14,000
16,000
18,000
4-28 5-2 5-5 5-9 5-11 5-13 5-17
Openinterest Nifty
OI Gainers
SCRIP OI
OI
CHG. (%)
PRICE
PRICE
CHG. (%)
METROPOLIS 653900 29.38 1753.45 -8.65
DELTACORP 19149800 26.48 227.90 -5.87
ITC 128006400 13.82 266.80 0.81
CHOLAFIN 10507500 13.55 662.75 -0.29
HINDPETRO 14704200 13.25 243.65 -5.00
VOLTAS 3950500 12.97 985.55 -0.24
AMBUJACEM 51562500 11.49 361.10 -2.03
BHARTIARTL 61693000 11.33 696.15 -1.61
OI Losers
SCRIP OI
OI
CHG. (%)
PRICE
PRICE
CHG. (%)
PERSISTENT 462600 -8.70 3857.70 3.19
LTTS 1001000 -6.74 3775.20 2.54
BOSCHLTD 119350 -6.61 14186.25 4.06
ICICIBANK 102597000 -6.07 707.35 -0.35
ACC 2436250 -5.73 2236.65 0.52
COALINDIA 38745000 -5.63 185.55 0.60
APOLLOTYRE 10887000 -5.51 214.10 -0.60
HINDALCO 41490700 -5.42 436.10 1.72
Put-Call Ratio
SCRIP PCR (OI) PCR (VOL)
NIFTY 0.87 0.90
BANKNIFTY 0.83 0.98
RELIANCE 0.33 0.44
ICICIBANK 0.52 0.57
INFY 0.39 0.46
www.angelone.in
Technical & Derivatives Report
May 19, 2022
Note: Above mentioned Bullish or Bearish Spreads in Nifty (May Series) are given as an information and not as a recommendation.
Nifty Spot = 162
40
.30
FII Statistics for
May
1
8
, 2022
Detail Buy
Contracts
Open
Interest
Value
(in Cr.)
Sell
Net
CHANGE
INDEX
FUTURES
3968.60 3906.57 62.03
165525 13650.95 0.67
INDEX
OPTIONS
895594.28 894822.99 771.29
1942012 159236.05 9.67
STOCK
FUTURES
16632.82 15708.27 924.55
2338371 144937.05 (0.06)
STOCK
OPTIONS
8686.02 8706.97 (20.95) 158123 10167.65 2.13
Total
924881.72
923144.80
1736.92
4604031
327991.70
3.93
Turnover on
May
1
8
, 2022
Instrument
No. of
Contracts
Turnover
( in Cr. )
Change
(%)
Index
Futures
463841 38537.32 -3.00
Index
Options
130865242 10958306.85
35.21
Stock
Futures
1023616 63390.73 6.57
Stock
Options
3834043 251077.83 1.47
Total
38,34,043 251077.83 33.84
Bull
-
Call Spreads
Action Strike Price Risk Reward BEP
Buy
16200 207.10
53.15 46.85 16253.15
Sell
16300 153.95
Buy
16200 207.10
96.00 104.00 16296.00
Sell
16400 111.10
Buy
16300 153.95
42.85 57.15 16342.85
Sell 16400 111.10
Bear
-
Put Spreads
Action Strike Price Risk Reward BEP
Buy
16200 181.30
39.75 60.25 16160.25
Sell
16100 141.55
Buy
16200 181.30
70.95 129.05 16129.05
Sell
16000 110.35
Buy
16100 141.55
31.20 68.80 16068.80
Sell
16000 110.35
Nifty Put
-
Call Analysis
,0
500,000
1000,000
1500,000
2000,000
2500,000
3000,000
3500,000
4000,000
4500,000
5000,000
15600 15700 15800 15900 16000 16100 16200 16300 16400 16500 16600 16700 16800 16900
Call Put

www.angelone.in
Technical & Derivatives Report
May 19, 2022
`
Daily Pivot Levels for Nifty Constituents
Scrips
S2
S1
PIVOT
R1
R2
ADANIPORTS 731 745
756 771 782
APOLLOHOSP 3,650 3,693
3,767 3,810 3,884
ASIANPAINT 2,982 3,041
3,085 3,144 3,188
AXISBANK 640 650
660 670 680
BAJAJ-AUTO 3,692 3,742
3,786 3,835 3,879
BAJFINANCE 5,687 5,751
5,854 5,918 6,021
BAJAJFINSV 12,301 12,532
12,841 13,071 13,380
BPCL 321 326
337 342 353
BHARTIARTL 666 681
704 719 742
BRITANNIA 3,310 3,352
3,392 3,435 3,475
CIPLA 933 945
953 965 973
COALINDIA 179 182
185 188 191
DIVISLAB 4,230 4,298
4,342 4,410 4,454
DRREDDY 3,821 3,864
3,924 3,967 4,027
EICHERMOT 2,630 2,663
2,716 2,749 2,803
GRASIM 1,458 1,473
1,491 1,506 1,524
HCLTECH 1,054 1,064
1,081 1,090 1,107
HDFCBANK 1,296 1,305
1,319 1,328 1,342
HDFCLIFE 541 546
552 557 563
HDFC 2,154 2,169
2,194 2,209 2,234
HEROMOTOCO 2,493 2,516
2,535 2,558 2,577
HINDALCO 418 427
433 442 448
HINDUNILVR 2,211 2,251
2,277 2,317 2,342
ICICIBANK 699 703
710 714 721
INDUSINDBK 888 895
907 914 926
INFY 1,477 1,493
1,521 1,538 1,566
ITC 261 264
266 269 271
JSW STEEL 618 624
635 641 652
KOTAKBANK 1,827 1,837
1,851 1,860 1,874
LT 1,529 1,551
1,587 1,609 1,645
M&M 896 905
914 922 931
MARUTI 7,442 7,504
7,572 7,635 7,703
NESTLEIND 16,118 16,231
16,325 16,437 16,531
NTPC 145 147
149 151 153
ONGC 158 161
163 165 167
POWERGRID 220 224
231 235 242
RELIANCE 2,477 2,508
2,539 2,569 2,601
SBILIFE 1,049 1,062
1,073 1,086 1,097
SHREECEM 21,747 22,124
22,356 22,733 22,964
SBIN 450 454
461 465 473
SUNPHARMA 878 888
899 909 920
TCS 3,410 3,430
3,462 3,482 3,514
TATACONSUM
725 739
749 764 773
TATAMOTORS 406 410
419 424 432
TATASTEEL 1,154 1,167
1,188 1,201 1,222
TECHM 1,128 1,150
1,190 1,212 1,252
TITAN 2,141 2,154
2,174 2,187 2,207
ULTRACEMCO 6,065 6,150
6,214 6,298 6,363
UPL 801 811
819 829 837
WIPRO 471 476
486 491 500

www.angelone.in
Technical & Derivatives Report
May 19, 2022
*
Technical and Derivatives Team:
Sameet Chavan
Chief Analyst
–
Technical & Derivatives
sameet.chavan@angelone.in
Sneha Seth Senior Analyst – Technical & Derivatives sneha.seth@angelone.in
Rajesh Bhosale Technical Analyst rajesh.bhosle@angelone.in
Osho Krishan Senior Analyst – Technical & Derivatives osho.krishan@angelone.in
Research Team Tel: 022 – 39357600 (Extn. 6844) Website: www.angelone.in
For Technical Queries E-mail: technicalresearch-cso@angelone.in
For Derivatives Queries E-mail: derivatives.desk@angelone.in
DISCLAIMER
Angel One Limited (hereinafter referred to as “Angel”) is a registered Member of National Stock Exchange of India Limited, Bombay
Stock Exchange Limited and Metropolitan Stock Exchange Limited. It is also registered as a Depository Participant with CDSL and
Portfolio Manager and investment advisor with SEBI. It also has registration with AMFI as a Mutual Fund Distributor. Angel One
Limited is a registered entity with SEBI for Research Analyst in terms of SEBI (Research Analyst) Regulations, 2014 vide registration
number INH000000164. Angel or its associates has not been debarred/ suspended by SEBI or any other regulatory authority for
accessing /dealing in securities Market.
This document is solely for the personal information of the recipient, and must not be singularly used as the basis of any investment
decision. Nothing in this document should be construed as investment or financial advice. Each recipient of this document should
make such investigations as they deem necessary to arrive at an independent evaluation of an investment in the securities of the
companies referred to in this document (including the merits and risks involved), and should consult their own advisors to determine
the merits and risks of such an investment.
Angel or its associates or research analyst or his relative may have actual/beneficial ownership of 1% or more in the securities of
the subject company at the end of the month immediately preceding the date of publication of the research report. Neither Angel or
its associates nor Research Analysts or his relative has any material conflict of interest at the time of publication of research report.
Angel or its associates might have received any compensation from the companies mentioned in the report during the period
preceding twelve months from the date of this report for services in respect of managing or co-managing public offerings, corporate
finance, investment banking or merchant banking, brokerage services or other advisory service in a merger or specific transaction
in the normal course of business. Angel or its associates did not receive any compensation or other benefits from the companies
mentioned in the report or third party in connection with the research report. Neither Angel nor its research analyst entity has been
engaged in market making activity for the subject company.
Reports based on technical and derivative analysis center on studying charts of a stock's price movement, outstanding positions and
trading volume, as opposed to focusing on a company's fundamentals and, as such, may not match with a report on a company's
fundamentals. Investors are advised to refer the Fundamental and Technical Research Reports available on our website to evaluate
the contrary view, if any.
The information in this document has been printed on the basis of publicly available information, internal data and other reliable
sources believed to be true, but we do not represent that it is accurate or complete and it should not be relied on as such, as this
document is for general guidance only. Angel One Limited or any of its affiliates/ group companies shall not be in any way responsible
for any loss or damage that may arise to any person from any inadvertent error in the information contained in this report. Angel One
Limited has not independently verified all the information contained within this document. Accordingly, we cannot testify, nor make
any representation or warranty, express or implied, to the accuracy, contents or data contained within this document. While Angel
One Limited endeavors to update on a reasonable basis the information discussed in this material, there may be regulatory,
compliance, or other reasons that prevent us from doing so.
This document is being supplied to you solely for your information, and its contents, information or data may not be reproduced,
redistributed or passed on, directly or indirectly.
Neither Angel One Limited, nor its directors, employees or affiliates shall be liable for any loss or damage that may arise from or in
connection with the use of this information. Angel or its associates or Research Analyst or his relative might have financial interest
in the subject company. Research analyst has not served as an officer, director or employee of the subject company.
