NOV 18, 2022
www.angelone.in
Technical & Derivatives Report
xOOOOOOOO
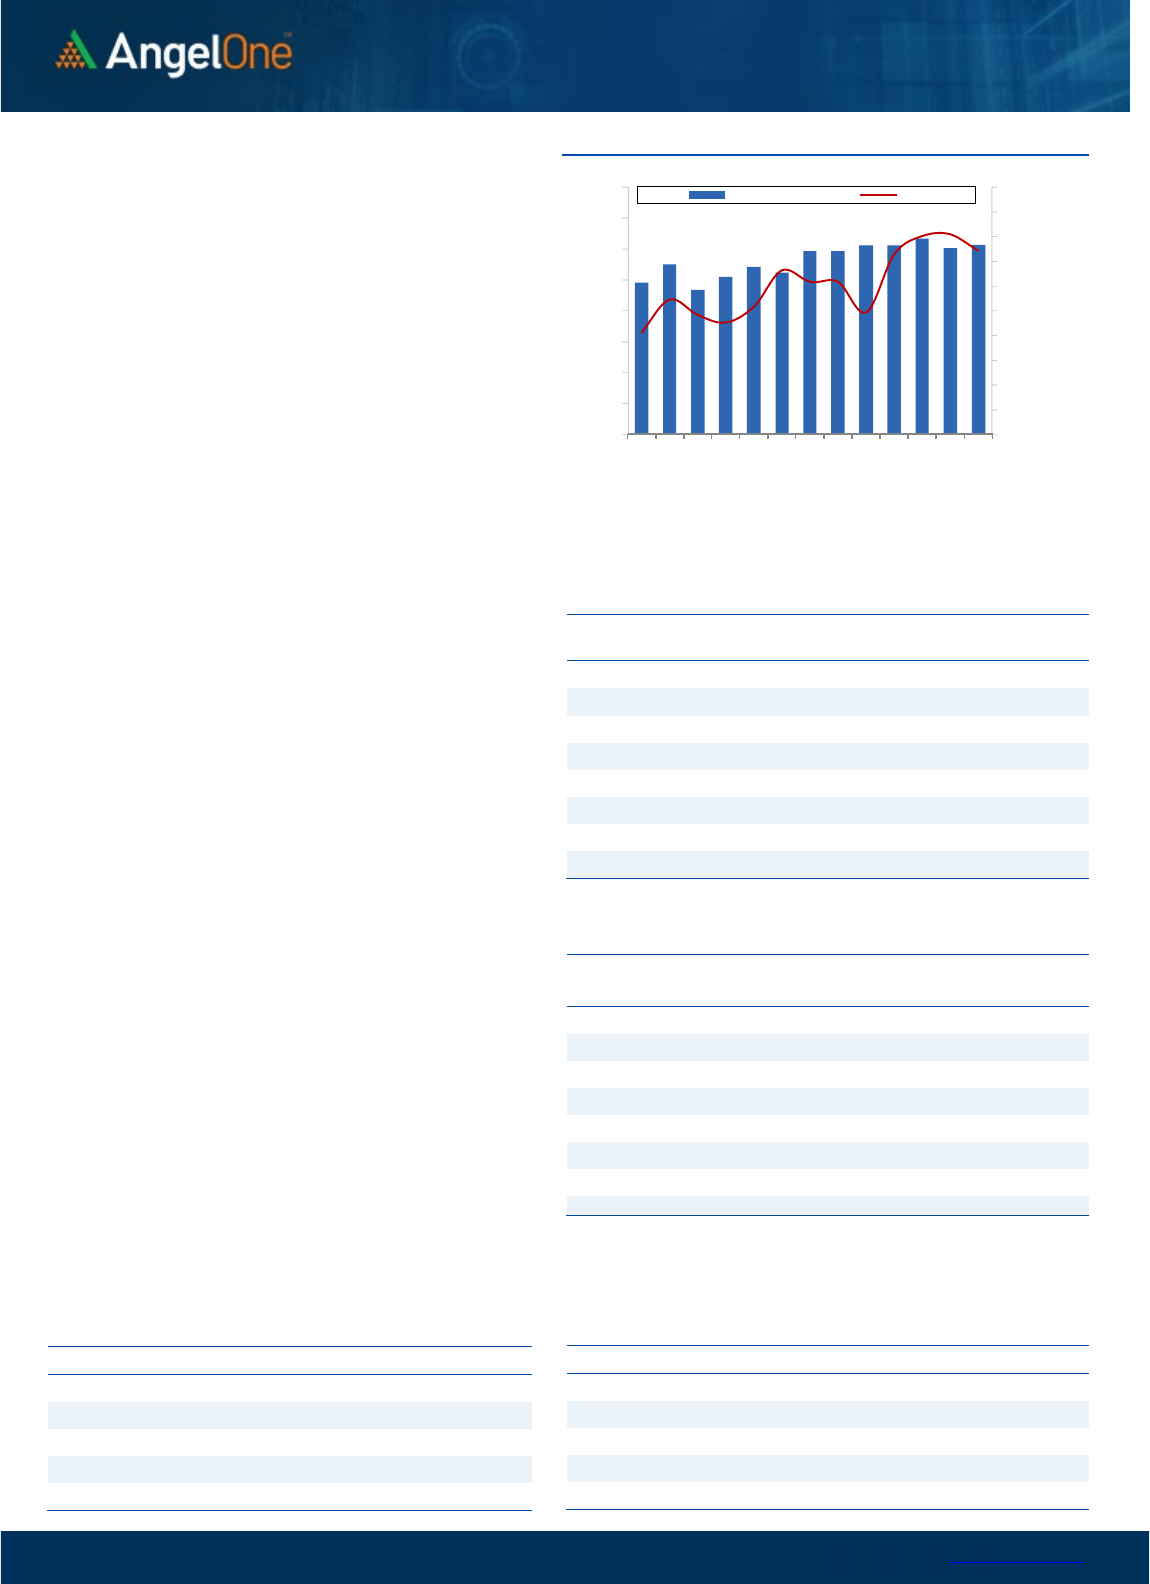
Nifty Bank
Outlook (
4
2
458
)
Bank Nifty started the day on a mild negative note this was
followed by a recent trend of sideways consolidation for the
intraday. Subsequently, during the penultimate hour, there were
some signs of strength that pushed prices beyond the previous
day's high however during the last half an hour there was again
some weakness to eventually end with a loss of 0.18% tad below
42500 levels.
Despite being a weekly expiry there was no major traction and this
has been the case throughout this week. The undertone remains
bullish however we are now seeing some signs of fatigue in the
bull's camp. In such a scenario, the apt strategy would be
considering dips as a buying opportunity and booking profits at
higher levels. Along with it, individual counters from the basket as
well is likely to give out performing opportunities. In such a
scenario, levels to watch as key support is seen around 42250
followed by 42000. On the flip side, 42750 - 43000 remains an
immediate resistance.
Key Levels
Support 1 – 42250 Resistance 1 – 42750
Support 2 – 42000 Resistance 2 – 43000
Exhibit 1: Nifty Daily Chart
Exhibit 2: Nifty Bank
Daily
Chart
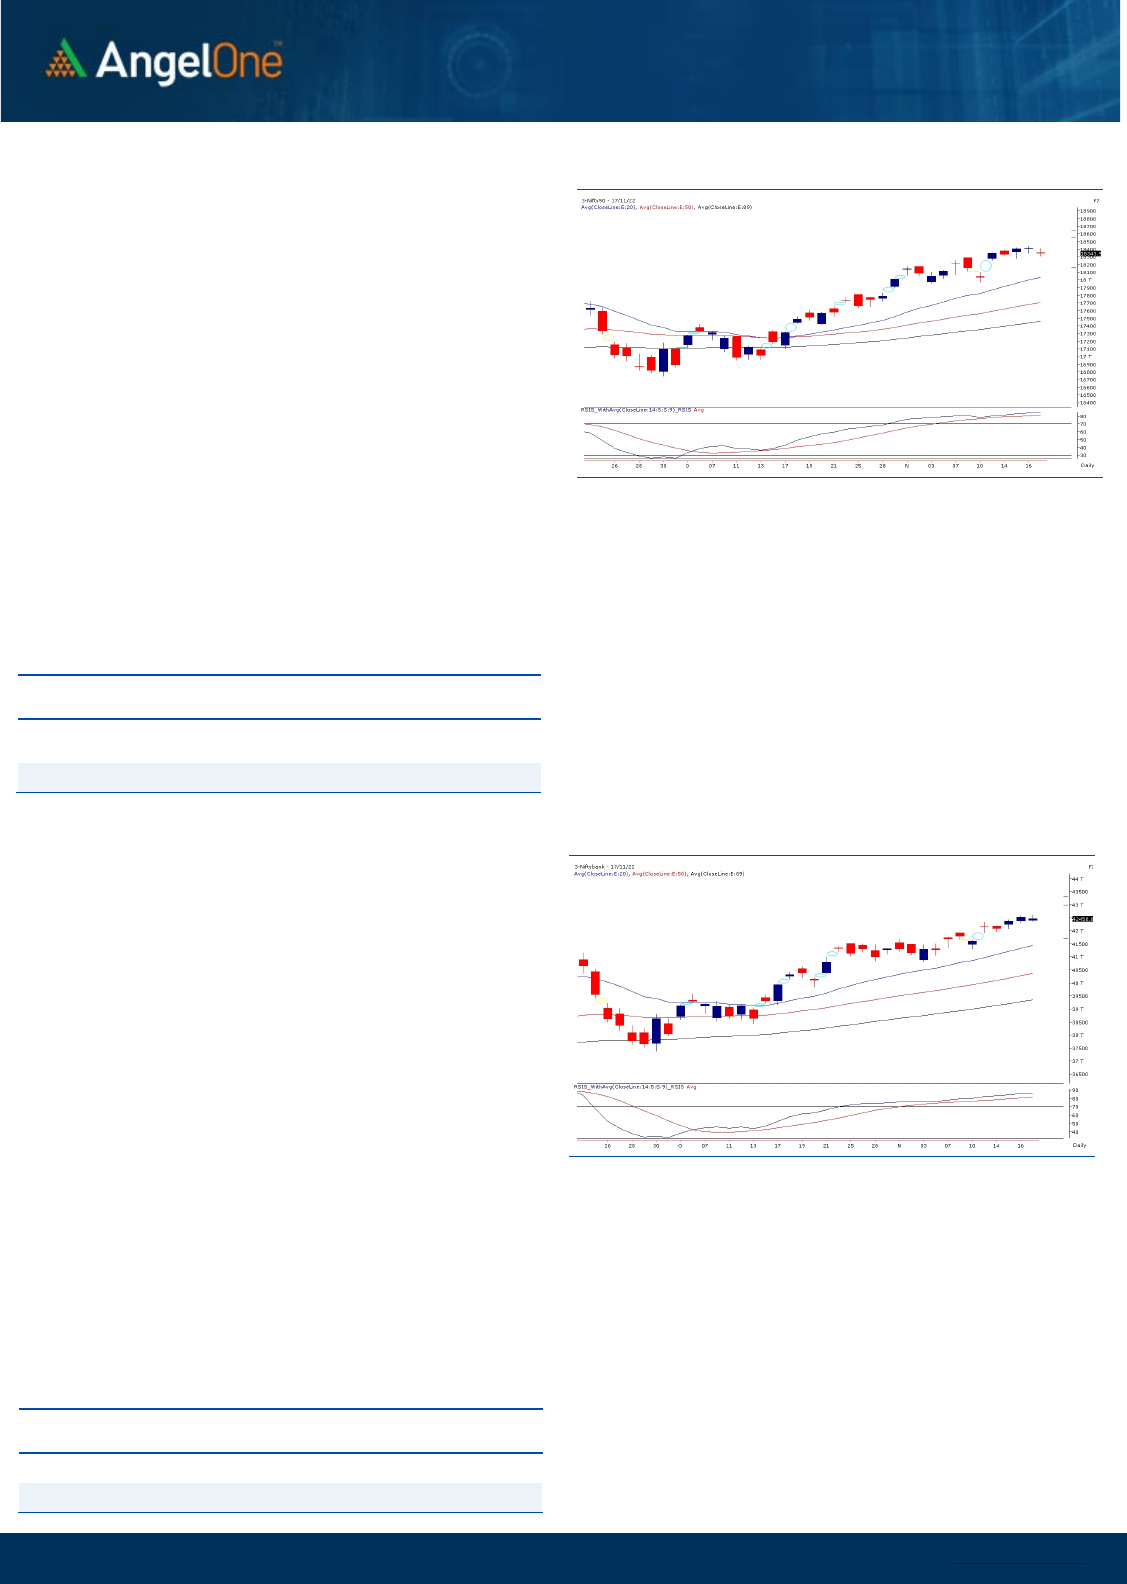
Sensex (61751) / Nifty (18344)
The global cues were a bit on the sluggish side to start the day.
However, we began the session on a flat note by shrugging off these
developments. For the most part of the session, index consolidated
in a slender range. But unlike previous sessions, the end was
certainly not the same. We witnessed a nosedive in last 30 minutes
of trade to conclude the session tad below the 18350 mark.
Although the tail end decline was a bit unpleasant for many traders,
we must consider this as a weekly expiry adjustment. If it’s a
genuine selling, the follow through needs be seen in coming session
to break the support zone of 18300 - 18260. However if this doesn’t
happen, then this move should only be construed as a running
correction. The structure remains very much intact and hence, we
will not be surprised to see some buying emerging at lower levels.
As far as resistance levels are concerned, 18400-18450-18525
should be seen as cluster for the coming session.
Key Levels
Support 1 – 18300 Resistance 1 – 18450
Support 2 – 18260 Resistance 2 – 18525
www.angelone.in
Technical & Derivatives Report
NOV 18, 2022
View
The Indian equity market witnessed a lackluster day of
trade, wherein the benchmark index Nifty50 shed
nearly 0.40 percent due to the fag end sell-off and
settled a tad below the 18350 level.
FIIs were net buyers in the cash market segment to
the tune of Rs. 618 crores. Simultaneously, in Index
futures, they sold worth Rs. 408 crores with a
decrease in open interest, indicating long unwinding.
Looking at the overall F&O data, we have witnessed a
mixed trade in both indices. On the options front, the
piling up of OI is visible in the 18300 put strike,
indicating nearby support. While on the higher end, the
piling up of positions could be seen at 18400-18500 call
strikes, suggesting the intermediate resistances for
the index. Meanwhile, the stronger hands remained
steady with their bullish bets as the ‘Long Short Ratio’
stood at 64%. Considering recent price action, we
advocate traders to continue with the buy on decline
approach.
Comments
The Nifty futures open interest has increased by
0.69%. and Bank Nifty futures open interest has
decreased by 4.78% as the market closed at 18343.90.
The Nifty November future closed with a premium of
34.50 point against a premium of 42.20 point in the
last trading session. The December series closed at
a premium of 126.75 point.
The INDIA VIX decreased from 15.10 to 14.87. At the
same time, the PCR-OI of Nifty has decreased from
1.14 to 0.98.
Few of the liquid counters where we have seen high
cost of carry are NAUKRI, SRTRANSFIN, EXIDEIND,
DIXON and MPHASIS.
Historical Volatility
SCRIP HV
GNFC 60.28
HDFCBANK 30.71
HDFC 34.71
INDHOTEL 46.35
NAUKRI 50.45
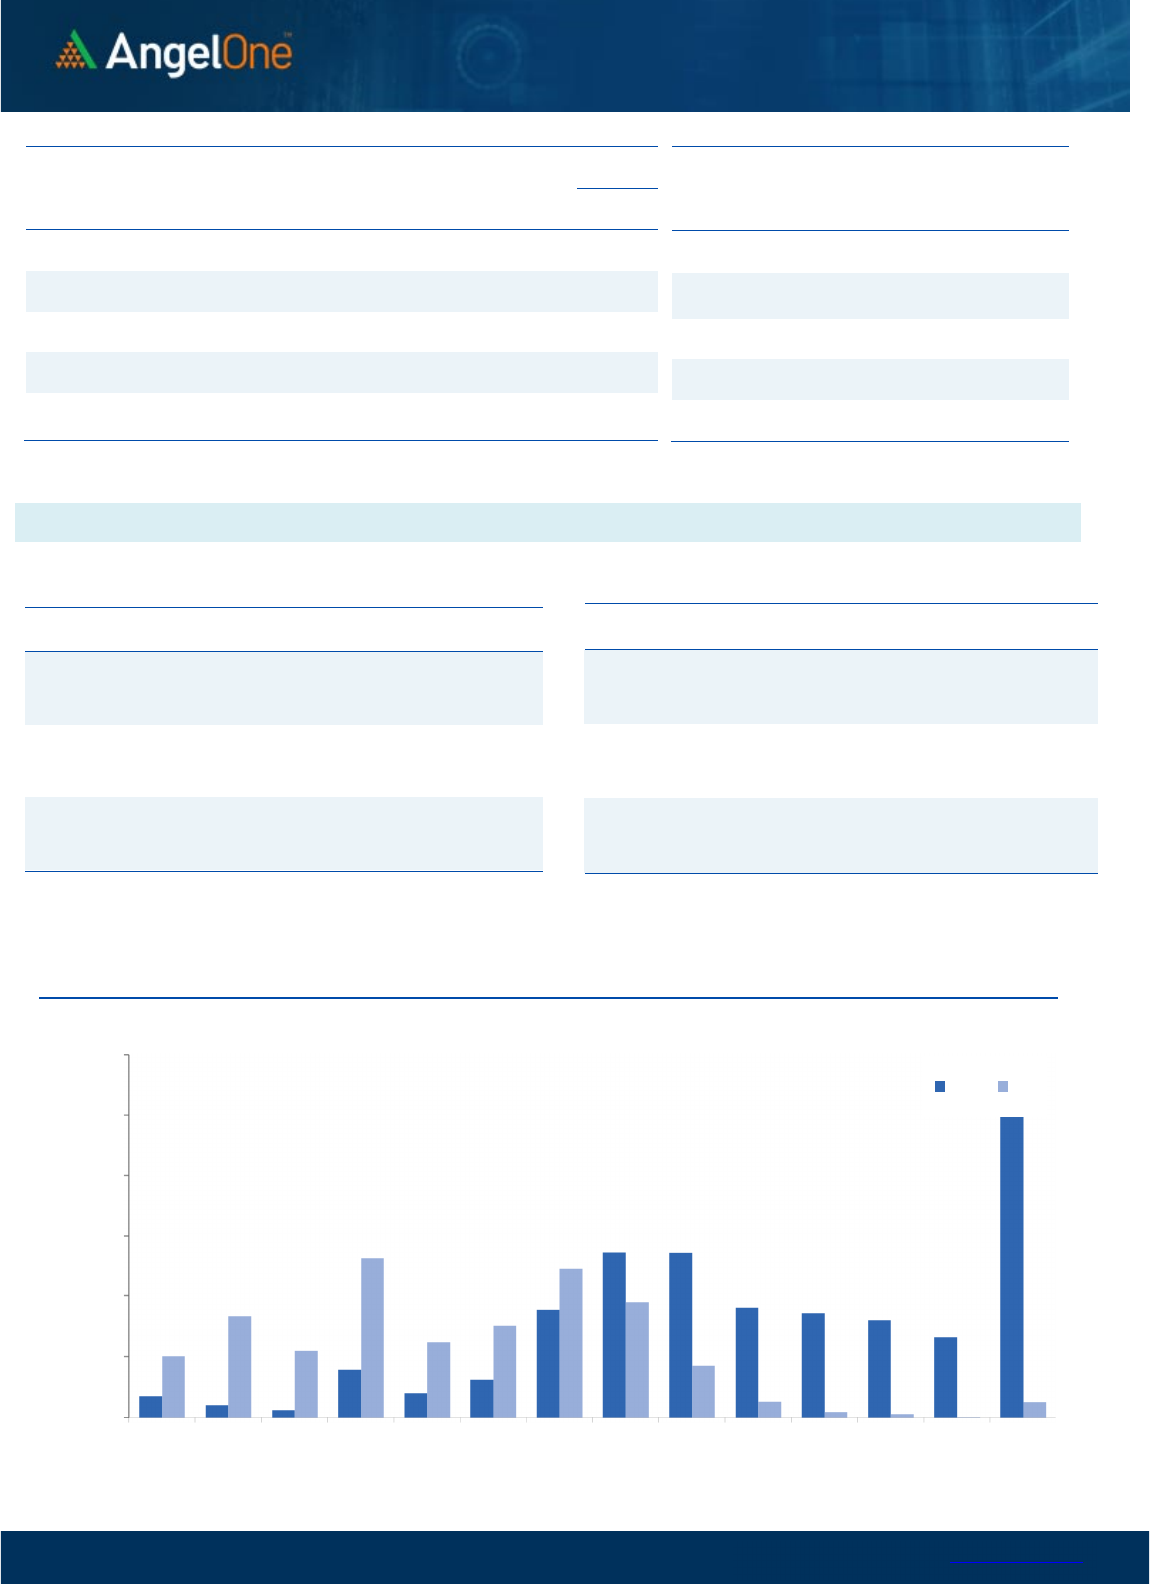
Nifty Vs OI
17600
17700
17800
17900
18000
18100
18200
18300
18400
18500
18600
8,000
9,000
10,000
11,000
12,000
13,000
14,000
15,000
16,000
10/31 11/2 11/4 11/8 11/10 11/15 11/17
Openinterest Nifty
OI Gainers
SCRIP OI
OI
CHG. (%)
PRICE
PRICE
CHG. (%)
AARTIIND 3852200 26.13 655.60 -2.89
METROPOLIS 1349800 25.75 1431.80 -0.29
AMARAJABAT 8420000 17.52 634.05 -0.17
NAUKRI 1944375 12.20 3907.55 -5.48
MUTHOOTFIN 8801225 10.43 1083.20 -0.13
MFSL 3027050 9.94 650.05 -0.65
NMDC 32738600 7.68 105.65 -1.39
PVR 3164018 7.48 1752.40 -0.13
OI Losers
SCRIP OI
OI
CHG. (%)
PRICE
PRICE
CHG. (%)
SRTRANSFIN 3429600 -6.17 1275.70 3.86
CUMMINSIND 2277600 -5.83 1380.75 0.99
BALRAMCHIN 10430400 -5.82 346.95 -1.40
PERSISTENT 669175 -5.72 3775.95 -1.07
IBULHSGFIN 44580000 -5.64 125.85 0.92
POWERGRID 36026100 -5.51 218.30 0.53
HINDALCO 24653975 -5.22 440.45 -1.68
APOLLOTYRE 17724000 -4.97 276.70 -0.36
Put-Call Ratio
SCRIP PCR (OI) PCR (VOL)
NIFTY 0.98 0.97
BANKNIFTY 1.12 1.01
RELIANCE 0.57 0.43
ICICIBANK 0.52 0.49
INFY 0.67 0.87
www.angelone.in
Technical & Derivatives Report
NOV 18, 2022
Note: Above mentioned Bullish or Bearish Spreads in Nifty (Nov Series) are given as an information and not as a recommendation.
Nifty Spot =
1
8
343
.
90
FII Statistics for
November
1
7
, 2022
Detail Buy
Contracts
Open
Interest
Value
(in Cr.)
Sell
Net
CHANGE
INDEX
FUTURES
2494.65 2902.77 (408.12) 182501 17419.94 (1.01)
INDEX
OPTIONS
1745300.38 1738438.40 6861.98
1367611 128513.64 (30.86)
STOCK
FUTURES
11061.76 10474.47 587.29
2169770 148572.44 0.10
STOCK
OPTIONS
10821.44 10684.91 136.53
165263 11718.12 (1.57)
Total 1769678.23
1762500.55
7177.68
3885145
306224.14
(13.62)
Turnover on
November
1
7
, 2022
Instrumen
t
No. of
Contracts
Turnover
( in Cr. )
Change
(%)
Index
Futures
243117 2379587.00
-19.51
Index
Options
258202241 3704948.14
-6.18
Stock
Futures
830244 5751894.60
-15.93
Stock
Options
3828230 314098.02 -25.88
Total
38,28,230 314098.02 -14.26
Bull-Call Spreads
Action Strike Price Risk Reward BEP
Buy
18300 167.10
58.65
41.35
18358.65
Sell
18400 108.45
Buy
18300 167.10
102.95
97.05
18402.95
Sell
18500 64.15
Buy
18400 108.45
44.30 55.70 18444.30
Sell 18500 64.15
Bear
-
Put Spreads
Action Strike Price Risk Reward BEP
Buy 18300 91.10
30.10
69.90
18269.90
Sell
18200 61.00
Buy 18300 91.10
50.80
149.20
18249.20
Sell 18100 40.30
Buy
18200 61.00
20.70 79.30 18179.30
Sell 18100 40.30
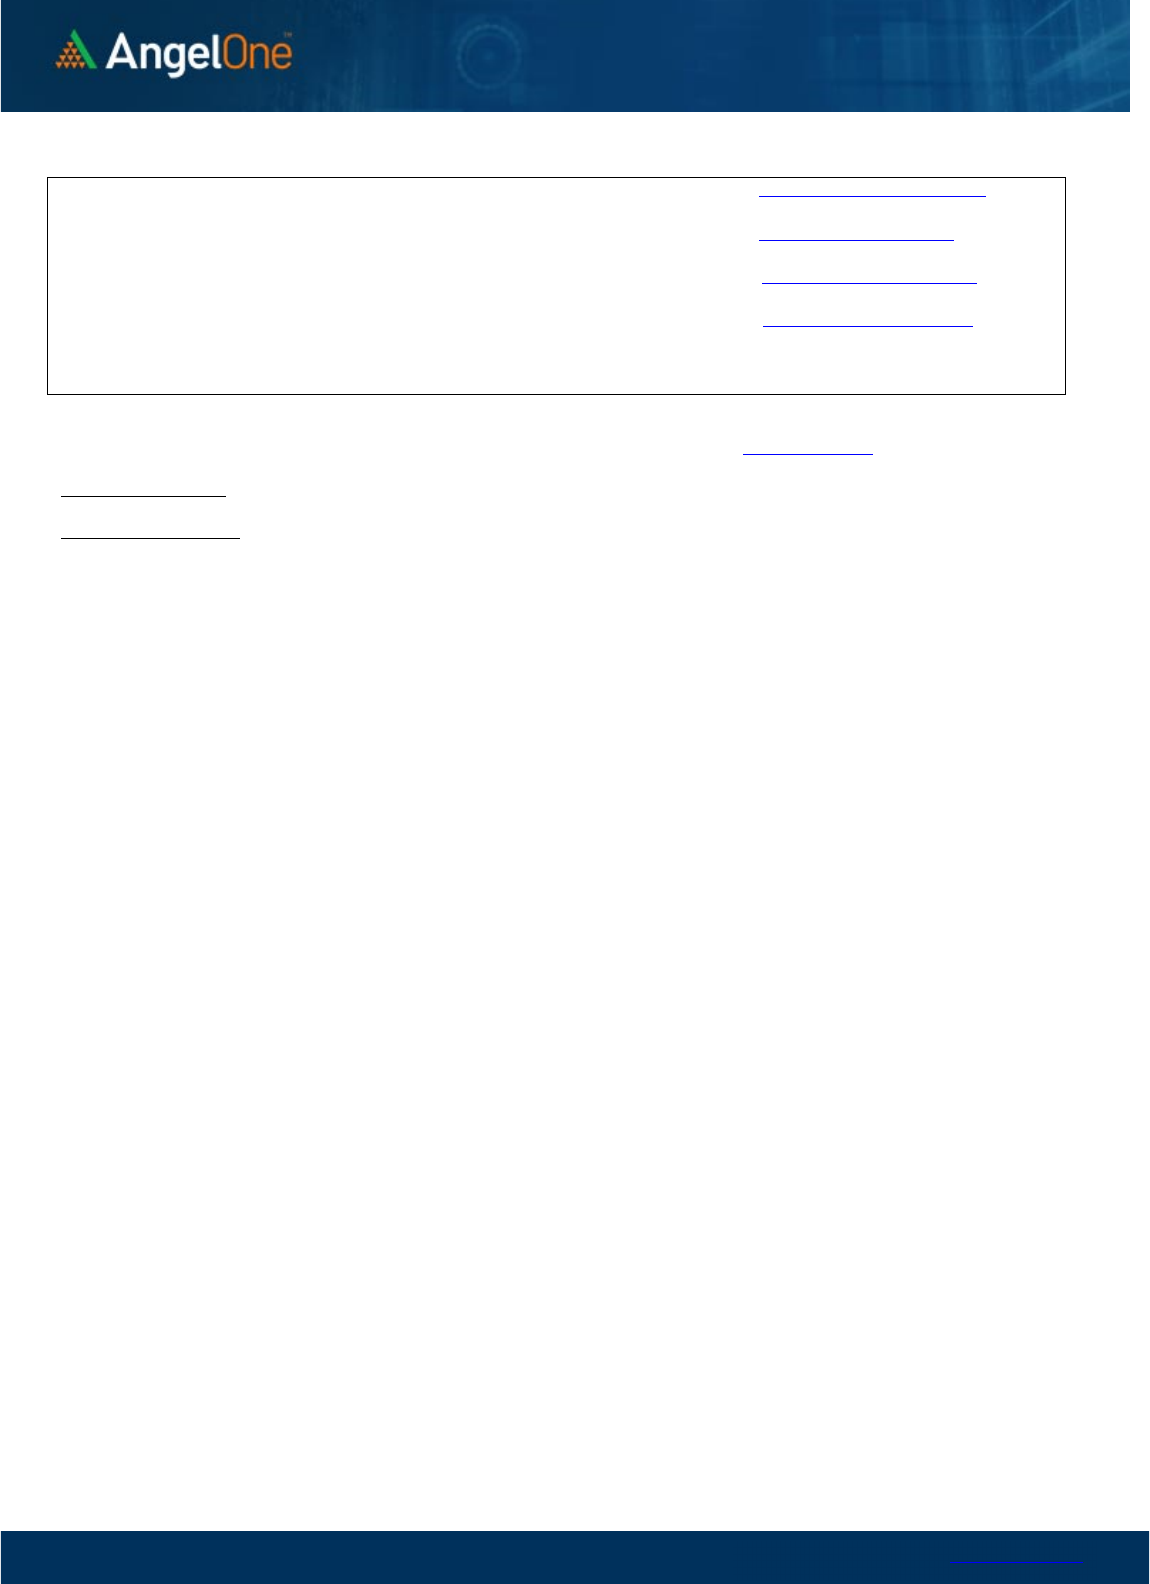
Nifty Put
-
Call Analysis
,0
2000,000
4000,000
6000,000
8000,000
10000,000
12000,000
17700 17800 17900 18000 18100 18200 18300 18400 18500 18600 18700 18800 18900 19000
Call Put

www.angelone.in
Technical & Derivatives Report
NOV 18, 2022
`
Daily Pivot Levels for Nifty Constituents
Scrips
S2
S1
PIVOT
R1 R2
ADANIENT
3,851
3,934
3,984 4,067
4,117
ADANIPORTS
872
882
890
899
907
APOLLOHOSP 4,284 4,342
4,429 4,487
4,574
ASIANPAINT 3,040 3,056
3,076
3,092
3,113
AXISBANK
849
853
857
862
866
BAJAJ-AUTO 3,624 3,659
3,713
3,748 3,802
BAJFINANCE
6,774
6,835
6,892
6,953
7,010
BAJAJFINSV
1,635
1,650
1,675
1,690
1,715
BPCL
303
304
306
307
309
BHARTIARTL
834
840
845
851
856
BRITANNIA 4,082 4,104
4,127
4,148
4,172
CIPLA 1,107 1,113
1,123 1,129
1,139
COALINDIA 229 231
233
234
236
DIVISLAB 3,254 3,272
3,290 3,308
3,326
DRREDDY 4,325 4,373
4,431
4,479 4,537
EICHERMOT 3,375 3,409
3,454
3,488 3,533
GRASIM
1,684
1,697
1,711
1,724
1,737
HCLTECH
1,083
1,088
1,094
1,099
1,106
HDFCBANK
1,604
1,611
1,621 1,629
1,639
HDFCLIFE
520
526
531 536 541
HDFC
2,618
2,639
2,672
2,692
2,725
HEROMOTOCO 2,708 2,726
2,745
2,764
2,783
HINDALCO
433
437
440
444
448
HINDUNILVR 2,427 2,444
2,471
2,487
2,515
ICICIBANK
906
913
917
925
929
INDUSINDBK 1,130 1,138
1,146
1,154
1,161
INFY 1,571 1,579
1,591 1,599
1,611
ITC
340
342
345
347
349
JSW STEEL
691
700
706
715
722
KOTAKBANK 1,931 1,941
1,953
1,963
1,975
LT
1,972
2,001
2,030 2,059
2,088
M&M
1,235
1,247
1,266
1,278
1,297
MARUTI 8,842 8,914
9,042 9,114 9,242
NESTLEIND
19,747
19,869
20,004
20,126 20,262
NTPC
166
167
169
170
172
ONGC
141
142
143 144 145
POWERGRID 214 216
218 220
223
RELIANCE 2,564 2,582
2,597
2,615 2,630
SBILIFE
1,236
1,245
1,253
1,262
1,270
SBIN
593
596
599
602
606
SUNPHARMA
998
1,006
1,018
1,026
1,038
TCS 3,300 3,325
3,342
3,367
3,385
TATACONSUM
757 772
780
795
804
TATAMOTORS 415 419
423
427 431
TATASTEEL 103 105
106
107
108
TECHM 1,041 1,050
1,056
1,065
1,070
TITAN 2,532 2,557
2,601
2,626
2,670
ULTRACEMCO 6,784 6,828
6,894 6,938 7,003
UPL
755
763
770
778
784
WIPRO
394
395
397
398
400
www.angelone.in
Technical & Derivatives Report
NOV 18, 2022
*
Technical and Derivatives Team:
Sameet Chavan Chief Analyst – Technical & Derivatives sameet.chavan@angelone.in
Sneha Seth Senior Analyst – Technical & Derivatives sneha.seth@angelone.in
Rajesh Bhosale Technical Analyst rajesh.bhosle@angelone.in
Osho Krishan Senior Analyst – Technical & Derivatives osho.krishan@angelone.in
Research Team Tel: 022 – 39357600 Website: www.angelone.in
For Technical Queries E-mail: technicalresearch-cso@angelone.in
For Derivatives Queries E-mail: derivatives.desk@angelone.in
DISCLAIMER
Angel One Limited (hereinafter referred to as “Angel”) is a registered Member of National Stock Exchange of India Limited, Bombay
Stock Exchange Limited and Metropolitan Stock Exchange Limited. It is also registered as a Depository Participant with CDSL and
Portfolio Manager and investment advisor with SEBI. It also has registration with AMFI as a Mutual Fund Distributor. Angel One
Limited is a registered entity with SEBI for Research Analyst in terms of SEBI (Research Analyst) Regulations, 2014 vide registration
number INH000000164. Angel or its associates has not been debarred/ suspended by SEBI or any other regulatory authority for
accessing /dealing in securities Market.
This document is solely for the personal information of the recipient, and must not be singularly used as the basis of any investment
decision. Nothing in this document should be construed as investment or financial advice. Each recipient of this document should
make such investigations as they deem necessary to arrive at an independent evaluation of an investment in the securities of the
companies referred to in this document (including the merits and risks involved), and should consult their own advisors to determine
the merits and risks of such an investment.
Angel or its associates or research analyst or his relative may have actual/beneficial ownership of 1% or more in the securities of
the subject company at the end of the month immediately preceding the date of publication of the research report. Neither Angel or
its associates nor Research Analysts or his relative has any material conflict of interest at the time of publication of research report.
Angel or its associates might have received any compensation from the companies mentioned in the report during the period
preceding twelve months from the date of this report for services in respect of managing or co-managing public offerings, corporate
finance, investment banking or merchant banking, brokerage services or other advisory service in a merger or specific transaction
in the normal course of business. Angel or its associates did not receive any compensation or other benefits from the companies
mentioned in the report or third party in connection with the research report. Neither Angel nor its research analyst entity has been
engaged in market making activity for the subject company.
Reports based on technical and derivative analysis center on studying charts of a stock's price movement, outstanding positions and
trading volume, as opposed to focusing on a company's fundamentals and, as such, may not match with a report on a company's
fundamentals. Investors are advised to refer the Fundamental and Technical Research Reports available on our website to evaluate
the contrary view, if any.
The information in this document has been printed on the basis of publicly available information, internal data and other reliable
sources believed to be true, but we do not represent that it is accurate or complete and it should not be relied on as such, as this
document is for general guidance only. Angel One Limited or any of its affiliates/ group companies shall not be in any way responsible
for any loss or damage that may arise to any person from any inadvertent error in the information contained in this report. Angel One
Limited has not independently verified all the information contained within this document. Accordingly, we cannot testify, nor make
any representation or warranty, express or implied, to the accuracy, contents or data contained within this document. While Angel
One Limited endeavors to update on a reasonable basis the information discussed in this material, there may be regulatory,
compliance, or other reasons that prevent us from doing so.
This document is being supplied to you solely for your information, and its contents, information or data may not be reproduced,
redistributed or passed on, directly or indirectly.
Neither Angel One Limited, nor its directors, employees or affiliates shall be liable for any loss or damage that may arise from or in
connection with the use of this information. Angel or its associates or Research Analyst or his relative might have financial interest
in the subject company. Research analyst has not served as an officer, director or employee of the subject company.
