November 18, 2021
www.angelone.in
Technical & Derivatives Report
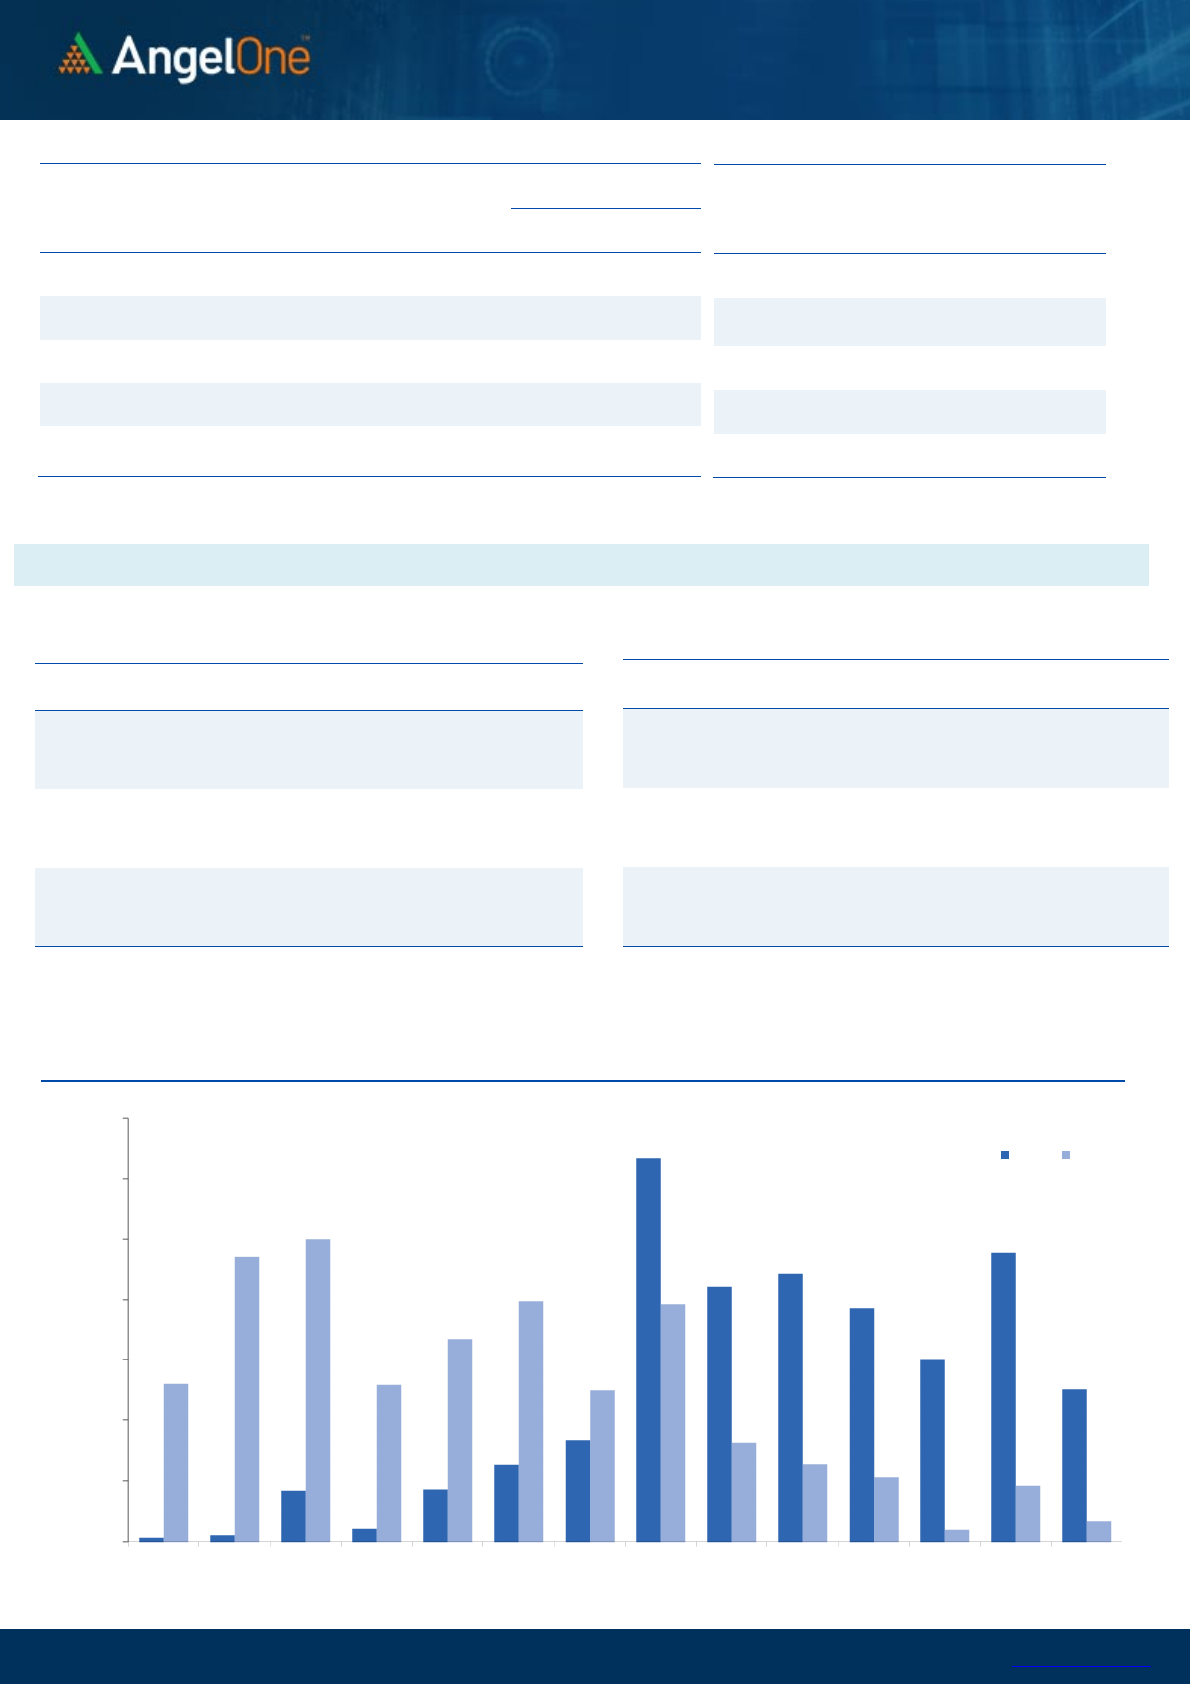
Nifty Bank Outlook - (38042)
Wednesday’s sell-off was followed by a gap down opening for the
banking index as well. As we progressed, some respite was observed
in initial two hours of trade but similar to recent trend it got sold into
to tank below 38000 mark. Finally, we closed third consecutive session
in red with a cut of nearly seventh tenth of a percent.
The banking index has been the major dragger lately and this has in
turn resulted the benchmark index closing below 20 DEMA. With
BankNifty’s recent price action, we have already cautioned traders to
avoid any kind of bottom fishing. As anticipated, index has slipped
below the supports of 38300-38400 on the closing bases and looks
poised for follow-up selling towards 37700 and then 37300. Hence, we
would advocate buy ATM puts incase of any intraday recoveries in
today’s weekly expiry session.
Key Levels
Support 1 – 37700 Resistance 1 – 38500
Support 2 – 37300 Resistance 2 – 38700
Exhibit 2: Nifty Bank Daily Chart
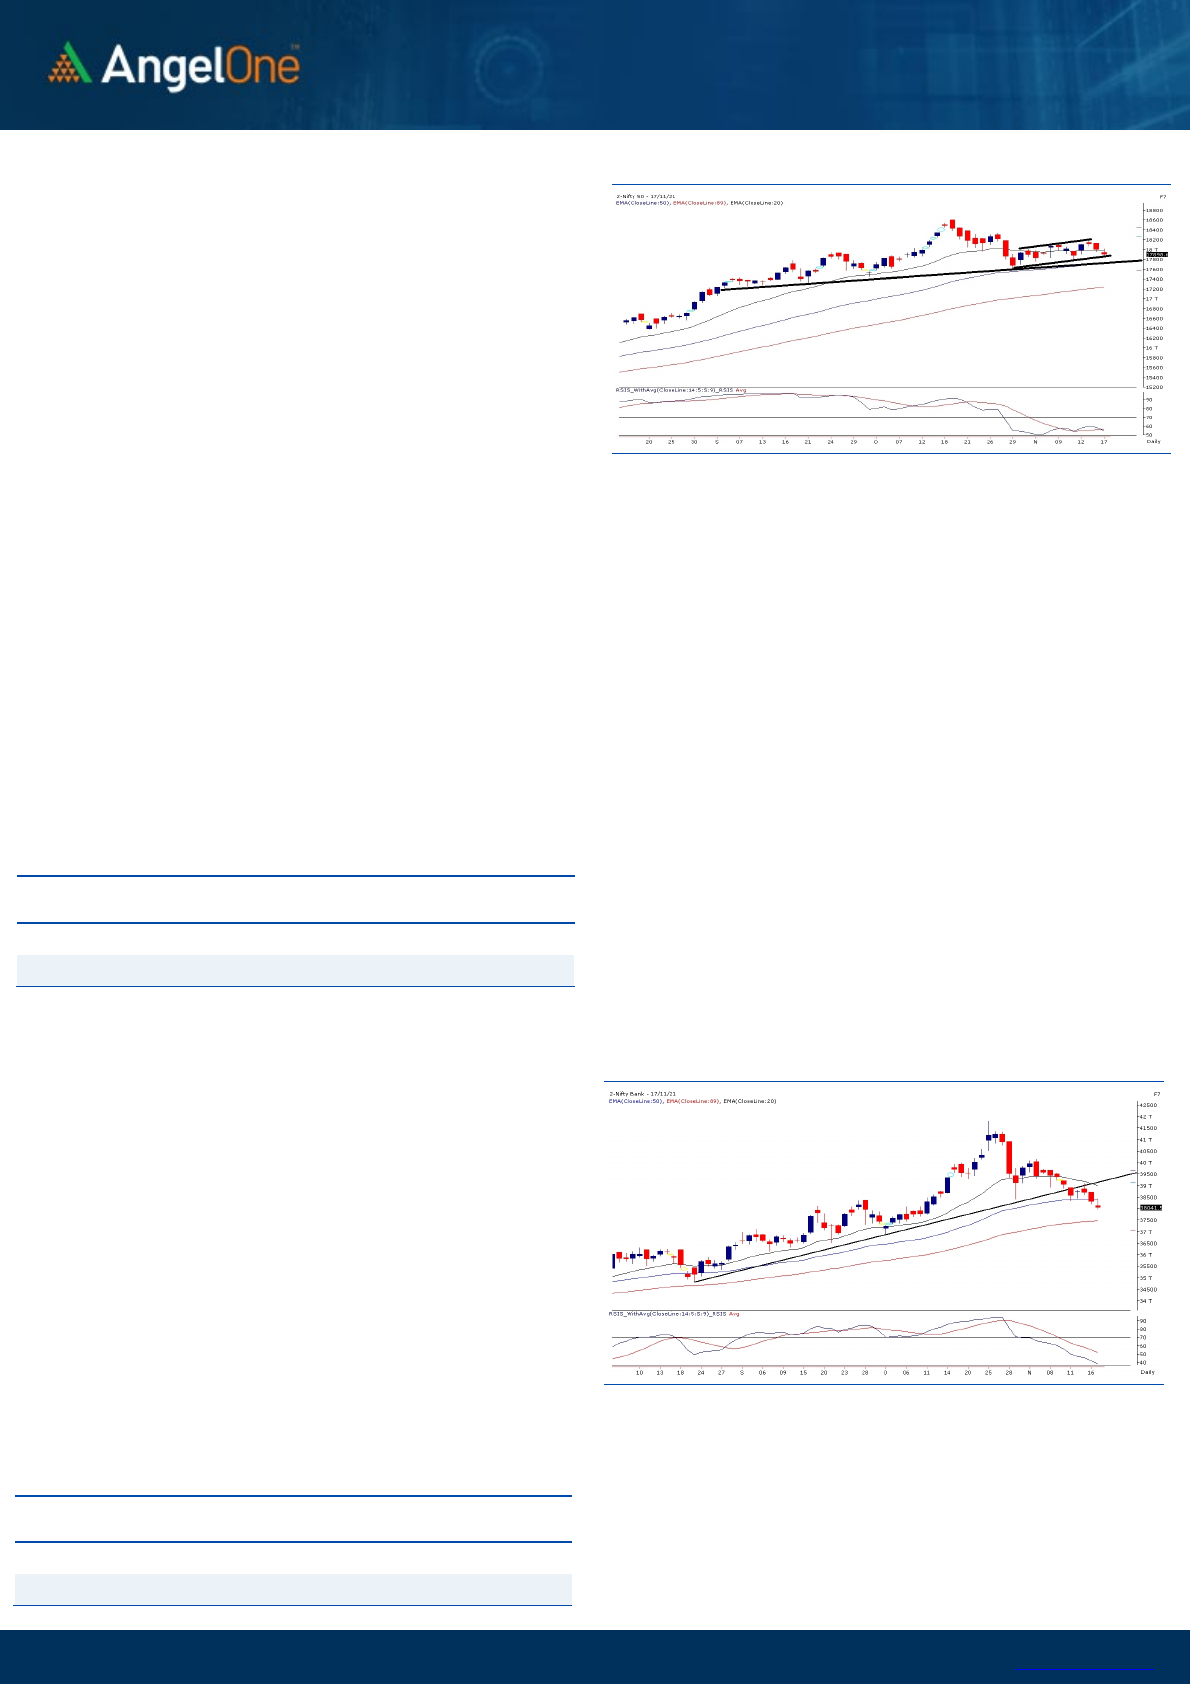
Sensex (60008) / Nifty (17899)
The SGX Nifty was indicating a sluggish start yesterday morning and in
line with this, our markets started the day on a soft note. In the first
couple of hours, market managed to recover from lower levels to
reclaim the 18000 mark. This was then followed by some consolidation
but once again last hour nervousness poured complete water as we
witnessed a sharp decline to sneak below 17900 at the close.
Within the recent consolidation, the market has started to grind lower
gradually since last three trading sessions. Although the damage is
negligible, we can see some interesting price development on the
chart. In our previous commentary, we had mentioned about the small
‘Channel’ pattern on the hourly chart. With yesterday’s corrective
move, Nifty has reached the lower boundary and the way overall things
are positioned, Nifty seems to be on the verge of a breakdown. In fact,
below 17700 we could see a confirmation of ‘Head and shoulder’
pattern formed on the daily time frame chart. Considering all these
observations, we can see market trading at the make or break levels
now. Any sustainable breakdown from the mentioned supports will
lead to extended correction in the near term; whereas on the flipside,
if Nifty has to regain any strength it needs to first reclaim the 18000
mark on a closing basis. The coming session would be crucial for our
market and hence one needs to a keep a close tab on all the above
mentioned scenarios.
Key Levels
Support 1 – 17800 Resistance 1 – 18000
Support 2 – 17700 Resistance 2 – 18030
Exhibit 1: Nifty Daily Chart

www.angelone.in
Technical &
Derivatives Report
November 18, 2021
View
The rub-off effect of previous session resulted a gap down
opening. This was followed by a range-bound movement
for the major part and eventually in the last hour one more
bout of selling was seen to finally end tad below 17900.
FIIs were net sellers in the cash market segment to the
tune of Rs. 344 crores. In index futures, they bought worth
Rs. 112 crores with increase in open interest indicating
long formations in yesterday’s session.
Index future front, Nifty witnessed fresh short formations
whereas open interest decreased in Bank Nifty indicates
long unwinding. FIIs continued their selling streak in cash
segment whereas they created some long formation in
index futures. Yesterday for most part of the day, traders
at 18000 call strike stood firm which eventually resulted in
a sharp decline towards the end. In fact, we saw decent
unwinding in 18000 Puts due to this corrective move and
now 17900 strike is very much at risk if we continue to grind
lower on the expiry day. Traders are advised exiting longs
on intraday recoveries and even an aggressive trader can
take a punt by going long on At the Money puts. The
banking has been the weakest link and yesterday the kind
of build-up we witnessed in 38500 calls, any bounce back is
likely to get sold into in the BANKNIFTY. Before this, we can
see some writing in 38200 strike which is likely to act as
immediate resistance. Although, 38000 put strike still has
highest open interest, we expect some unwinding pressure
once BANKNIFTY starts staying below the 38000 mark.
Comments
The Nifty futures open interest has increased by 1.42%. Bank
Nifty futures open interest has decreased by 1.37% as market
closed at 17898.65 levels.
The Nifty November future closed with a premium of 10.5
point against a premium of 4.80 point in last trading session.
The December series closed at a premium of 71.6 point.
The INDIA VIX decreased from 15.20 to 14.98. At the same
time, the PCR-OI of Nifty has decreased from 0.86 to 0.81.
Few of the liquid counters where we have seen high cost of
carry are IDEA, INDUSTOWER, BSOFT, LALPATHLAB, AND
GMRINFRA
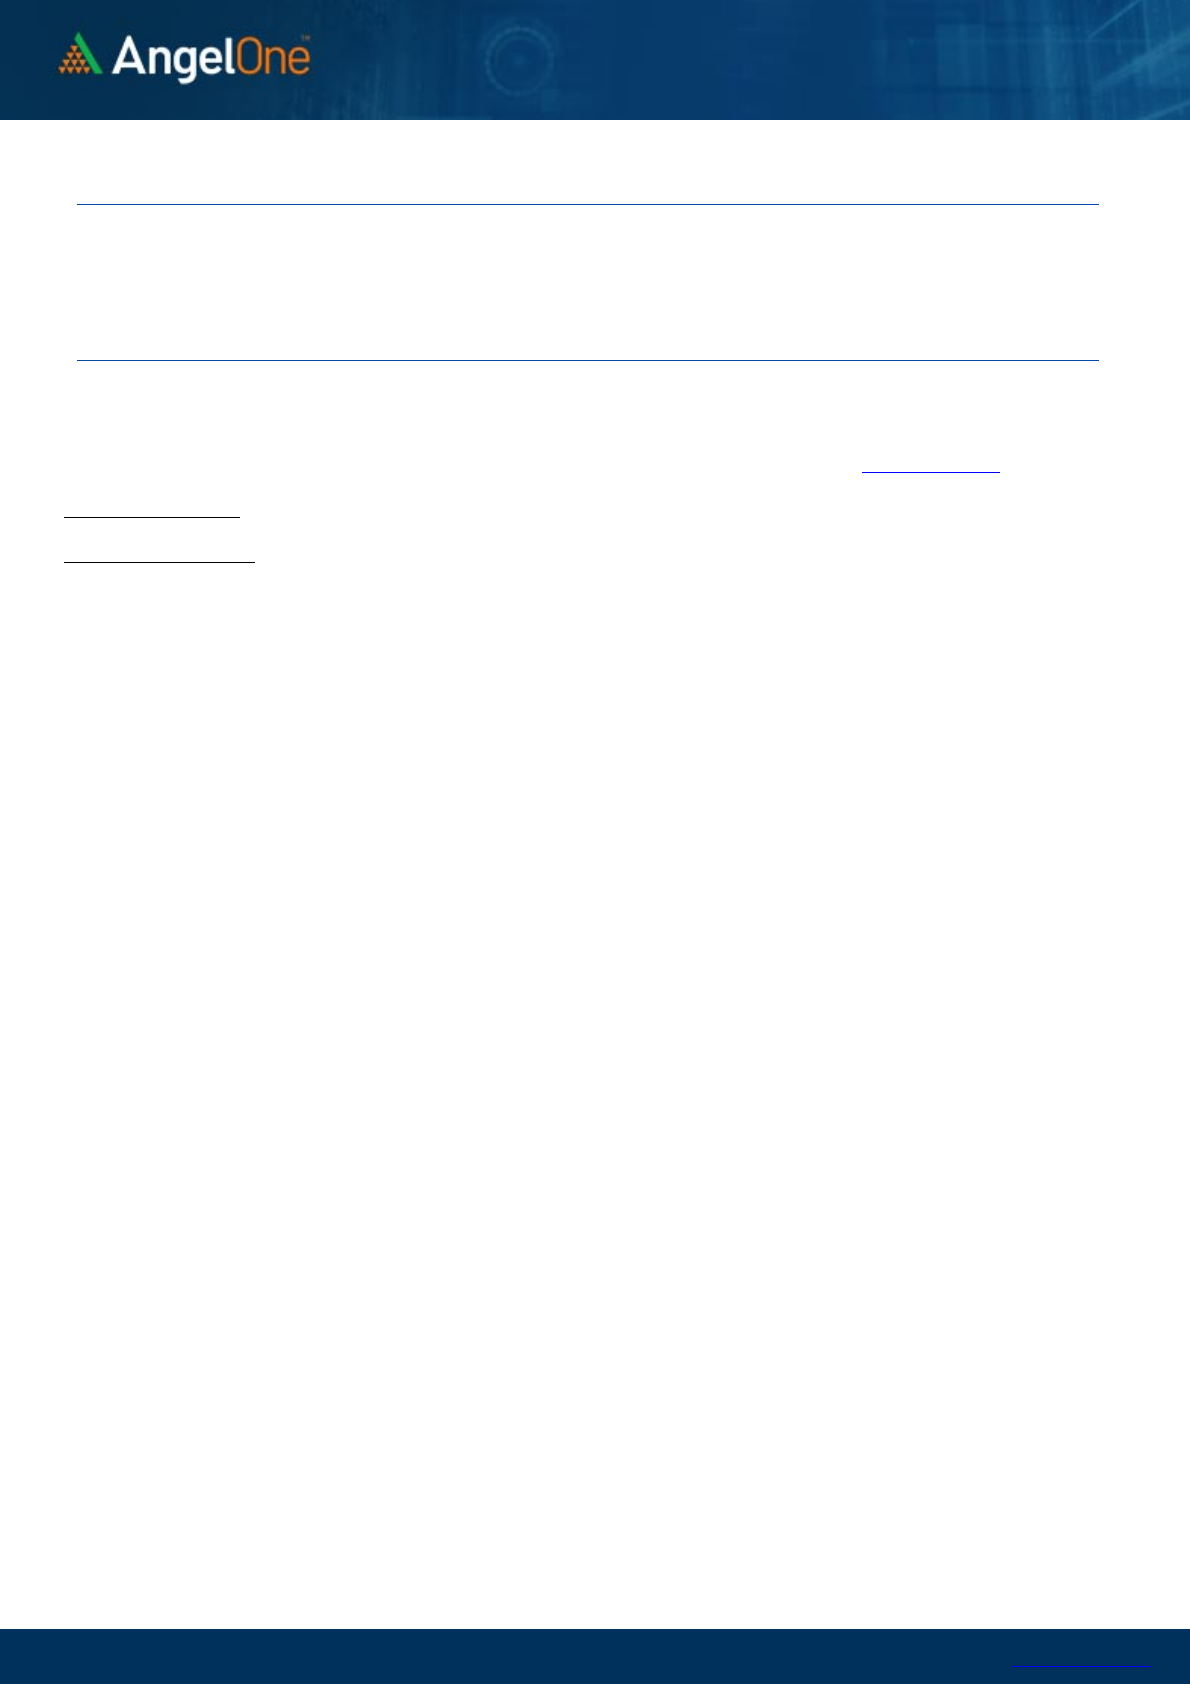
Nifty Vs OI
17400
17500
17600
17700
17800
17900
18000
18100
18200
18300
18400
,0
2,000
4,000
6,000
8,000
10,000
12,000
14,000
16,000
10-20 10-2210-2610-28 11-1 11-3 11-5 11-1111-1511-17
(`000)
Openinterest Nifty
OI Gainers
SCRIP OI
OI
CHG. (%)
PRICE
PRICE
CHG. (%)
BSOFT
4197700 30.94 475.10 8.33
GSPL
1431400 29.34 320.55 1.29
COFORGE
830000 12.37 5839.30 1.80
LALPATHLAB
623250 10.95 3651.85 1.25
APOLLOHOSP
2585750 8.84 5734.00 12.26
IPCALAB
2954025 8.46 2097.15 -2.66
AXISBANK
59462400 8.37 712.35 -1.81
ESCORTS
8694950 7.33 1630.95 -0.01
OI Losers
SCRIP OI
OI
CHG. (%)
PRICE
PRICE
CHG. (%)
CHAMBLFERT
969000 -21.32 355.70 -5.95
MARUTI
2668500 -6.72 8274.70 2.41
SBILIFE
7353750 -6.35 1187.20 2.48
TRENT
2132950 -5.83 1153.20 -3.00
IRCTC
12890625 -5.72 903.60 -1.87
ALKEM
662200 -4.64 3476.90 -2.16
MRF
62730 -3.67 79373.35 0.99
SYNGENE
1378700 -3.62 609.05 1.06
Put-Call Ratio
SCRIP PCR-OI PCR-VOL
NIFTY
0.81 0.80
BANKNIFTY
0.55 0.88
RELIANCE
0.46 0.48
ICICIBANK
0.40 0.45
INFY
0.52 0.42
Historical Volatility
SCRIP HV
APOLLOHOSP
50.06
BSOFT
55.23
CHAMBLFERT
53.63
LTTS
49.98
SBILIFE
35.38
www.angelone.in
Technical &
Derivatives Report
November 18, 2021
Note: Above mentioned Bullish or Bearish Spreads in Nifty (November Series) are given as an information and not as a recommendation.
Nifty Spot =
17898.65
FII Statistics for November 17, 2021
Detail Buy
Net Contracts
Open Interest
Sell
Value
(in Cr.)
Change
INDEX
FUTURES
3749.20 3637.38 111.82
170638 15557.37 2.68
INDEX
OPTIONS
491263.78 493488.35 (2224.57) 1663668 151917.43 3.94
297314.41
STOCK
FUTURES
14536.62 14658.01 (121.39) 1841363 137180.03 0.75
STOCK
OPTIONS
25959.20 25740.88 218.32
352785 26891.16 2.15
Total
535508.80
537524.62
(2015.82) 4028454
331545.99
2.25
43446.77
Turnover on November 17, 2021
Instrument
No. of
Contracts
Turnover
( in Cr. )
Change
(%)
Index Futures
263134 24414.69 -5.39
Index Options
67339952 6320783.99 26.18
Stock Futures
913791 72112.15 2.41
Stock Options
3878091 314318.66 7.12
Total
7,23,94,968
6731629.49 24.68
Bull-Call Spreads
Action Strike Price Risk Reward BEP
Buy
17900 152.50
48.75 51.25 17948.75
Sell
18000 103.75
Buy
17900 152.50
84.60 115.40 17984.60
Sell
18100 67.90
Buy
18000 103.75
35.85 64.15 18035.85
Sell
18100 67.90
Bear-Put Spreads
Action Strike Price Risk Reward BEP
Buy
17900 138.70
40.85 59.15 17859.15
Sell
17800 97.85
Buy
17900 138.70
71.00 129.00 17829.00
Sell
17700 67.70
Buy
17800 97.85
30.15 69.85 17769.85
Sell
17700 67.70
Nifty Put-Call Analysis
,0
500,000
1000,000
1500,000
2000,000
2500,000
3000,000
3500,000
17300 17400 17500 17600 17700 17800 17900 18000 18100 18200 18300 18400 18500 18600
Call Put

www.angelone.in
Technical &
Derivatives Report
November 18, 2021
`
Daily Pivot Levels for Nifty Constituents
Scrips S2 S1 PIVOT R1 R2
ADANIPORTS 726 731
738 743 750
ASIANPAINT 3,137 3,184
3,212 3,258 3,287
AXISBANK 697 704
715 723 733
BAJAJ-AUTO 3,534 3,559
3,601 3,626 3,669
BAJFINANCE 7,436 7,522
7,607 7,693 7,778
BAJAJFINSV 17,954 18,105
18,262 18,413 18,571
BPCL 407 410
416 419 424
BHARTIARTL 707 713
723 730 739
BRITANNIA 3,549 3,582
3,641 3,674 3,733
CIPLA 889 897
909 918 930
COALINDIA 153 155
157 158 161
DIVISLAB 4,700 4,732
4,789 4,821 4,879
DRREDDY 4,706 4,737
4,781 4,812 4,856
EICHERMOT 2,609 2,642
2,696 2,728 2,782
GRASIM 1,763 1,778
1,802 1,816 1,840
HCLTECH 1,141 1,147
1,156 1,161 1,170
HDFCBANK 1,519 1,525
1,534 1,540 1,550
HDFCLIFE 700 706
714 720 728
HDFC 2,908 2,928
2,953 2,973 2,998
HEROMOTOCO 2,710 2,730
2,752 2,771 2,793
HINDALCO 435 440
445 450 454
HINDUNILVR 2,373 2,382
2,396 2,405 2,419
ICICIBANK 748 754
763 770 779
IOC 126 127
129 131 133
INDUSINDBK 1,002 1,018
1,030 1,046 1,058
INFY 1,769 1,778
1,790 1,799 1,811
ITC 231 235
240 245 250
JSW STEEL 651 657
664 670 677
KOTAKBANK 2,024 2,038
2,060 2,075 2,097
LT 1,923 1,938
1,958 1,973 1,994
M&M 928 941
960 973 992
MARUTI 7,878 8,077
8,213 8,411 8,548
NESTLEIND 19,266 19,372
19,468 19,574 19,670
NTPC 132 134
136 138 140
ONGC 155 156
158 159 160
POWERGRID 184 187
191 194 197
RELIANCE 2,437 2,450
2,475 2,488 2,513
SBILIFE 1,131 1,159
1,178 1,206 1,225
SHREECEM 27,192 27,442
27,868 28,117 28,544
SBIN 484 491
498 505 513
SUNPHARMA 777 784
795 802 812
TCS 3,474 3,498
3,530 3,554 3,587
TATACONSUM
824 830
839 845 854
TATAMOTORS 513 521
529 538 545
TATASTEEL 1,202 1,211
1,224 1,233 1,246
TECHM 1,583 1,601
1,613 1,631 1,643
TITAN 2,462 2,481
2,510 2,529 2,558
ULTRACEMCO 7,721 7,789
7,869 7,937 8,017
UPL 737 747
762 771 786
WIPRO 653 657
663 667 673
www.angelone.in
Technical &
Derivatives Report
November 18, 2021
*
Research Team Tel: 022 – 39357600 (Extn. 6844) Website: www.angelone.in
For Technical Queries E-mail: technicalresearch-cso@angelbroking.com
For Derivatives Queries E-mail: derivatives.desk@angelbroking.com
DISCLAIMER
Angel Broking Limited (hereinafter referred to as “Angel”) is a registered Member of National Stock Exchange of India Limited,
Bombay Stock Exchange Limited and Metropolitan Stock Exchange Limited. It is also registered as a Depository Participant with
CDSL and Portfolio Manager and Investment Adviser with SEBI. It also has registration with AMFI as a Mutual Fund Distributor. Angel
Broking Limited is a registered entity with SEBI for Research Analyst in terms of SEBI (Research Analyst) Regulations, 2014 vide
registration number INH000000164. Angel or its associates has not been debarred/ suspended by SEBI or any other regulatory
authority for accessing /dealing in securities Market. Angel or its associates/analyst has not received any compensation / managed
or co-managed public offering of securities of the company covered by Analyst during the past twelve months.
This document is solely for the personal information of the recipient, and must not be singularly used as the basis of any investment
decision. Nothing in this document should be construed as investment or financial advice. Each recipient of this document should
make such investigations as they deem necessary to arrive at an independent evaluation of an investment in the securities of the
companies referred to in this document (including the merits and risks involved), and should consult their own advisors to determine
the merits and risks of such an investment.
Reports based on technical and derivative analysis center on studying charts of a stock's price movement, outstanding positions and
trading volume, as opposed to focusing on a company's fundamentals and, as such, may not match with a report on a company's
fundamentals. Investors are advised to refer the Fundamental and Technical Research Reports available on our website to evaluate
the contrary view, if any.
The information in this document has been printed on the basis of publicly available information, internal data and other reliable
sources believed to be true, but we do not represent that it is accurate or complete and it should not be relied on as such, as this
document is for general guidance only. Angel Broking Limited or any of its affiliates/ group companies shall not be in any way
responsible for any loss or damage that may arise to any person from any inadvertent error in the information contained in this
report. Angel Broking Limited has not independently verified all the information contained within this document. Accordingly, we
cannot testify, nor make any representation or warranty, express or implied, to the accuracy, contents or data contained within this
document. While Angel Broking Limited endeavors to update on a reasonable basis the information discussed in this material, there
may be regulatory, compliance, or other reasons that prevent us from doing so.
This document is being supplied to you solely for your information, and its contents, information or data may not be reproduced,
redistributed or passed on, directly or indirectly.
Neither Angel Broking Limited, nor its directors, employees or affiliates shall be liable for any loss or damage that may arise from
or in connection with the use of this information.
Technical and Derivatives Team:
Sameet Chavan Chief Analyst – Technical & Derivatives sameet.chavan@angelone.in
Rajesh Bhosale Technical Analyst rajesh.bhosle@angelone.in
Sneha Seth Derivatives Analyst sneha.seth@angelone.in
