May 18, 2022
www.angelone.in
Technical & Derivatives
Report
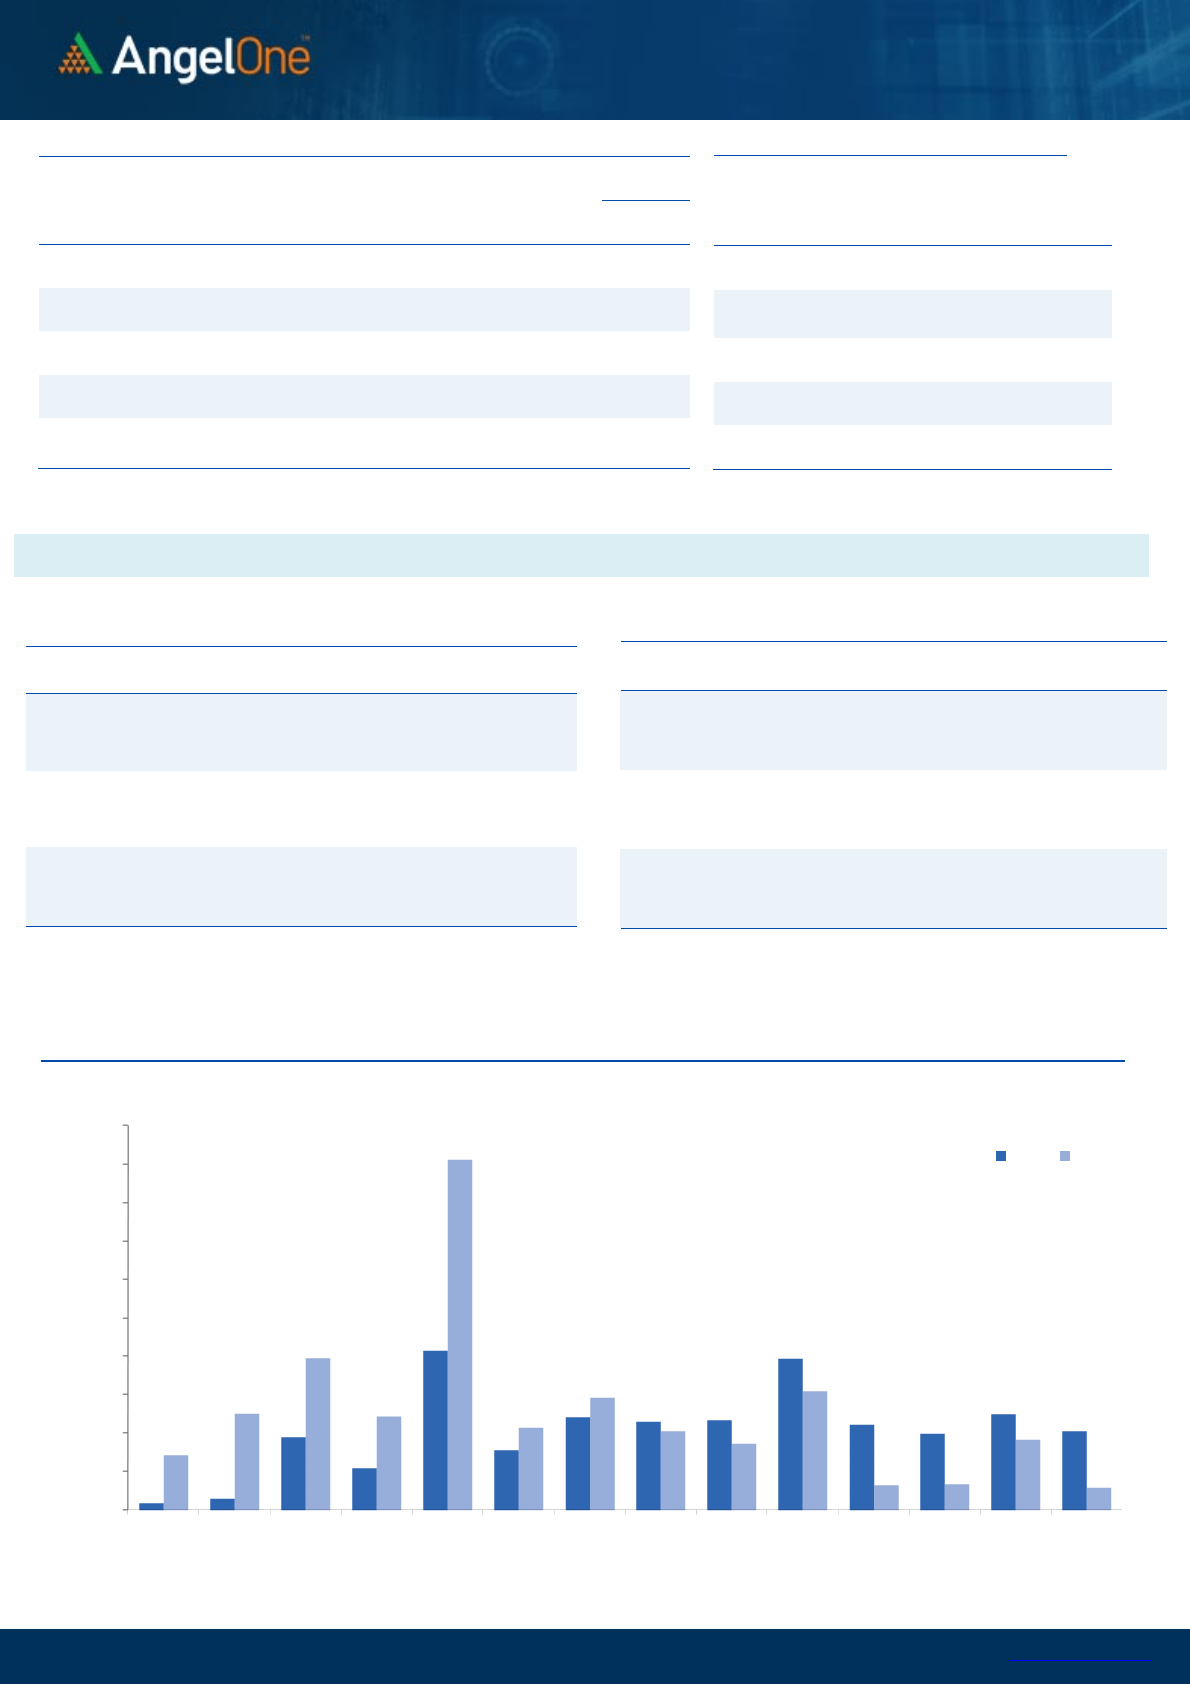
Nifty Bank Outlook
-
(34302)
Bank Nifty as well started on a positive note and the momentum
continued throughout the session to eventually end with strong
gains of over two percent tad above 34300.
Following the bullish reversal candlestick pattern on Monday
known as 'Inside Bar' the bank index finally witnessed a much-
awaited bounce back yesterday. The way some of the counters
moved within this space and the way the bank nifty has closed
certainly bodes well for the bulls. However, as mentioned above
this upmove should only be considered as a pullback as of now,
and a one step at a time approach should be taken. As far as
levels are concerned, 34800 - 35000 are the next levels to
check on the pull-back moves whereas, on the flip side, 34000
- 33800 is the immediate support zone. As long as the
mentioned support levels hold, intraday dips can be taken to add
the long positions.
Key Levels
Support 1 – 34000 Resistance 1 – 34800
Support 2 – 33800 Resistance 2 – 35000
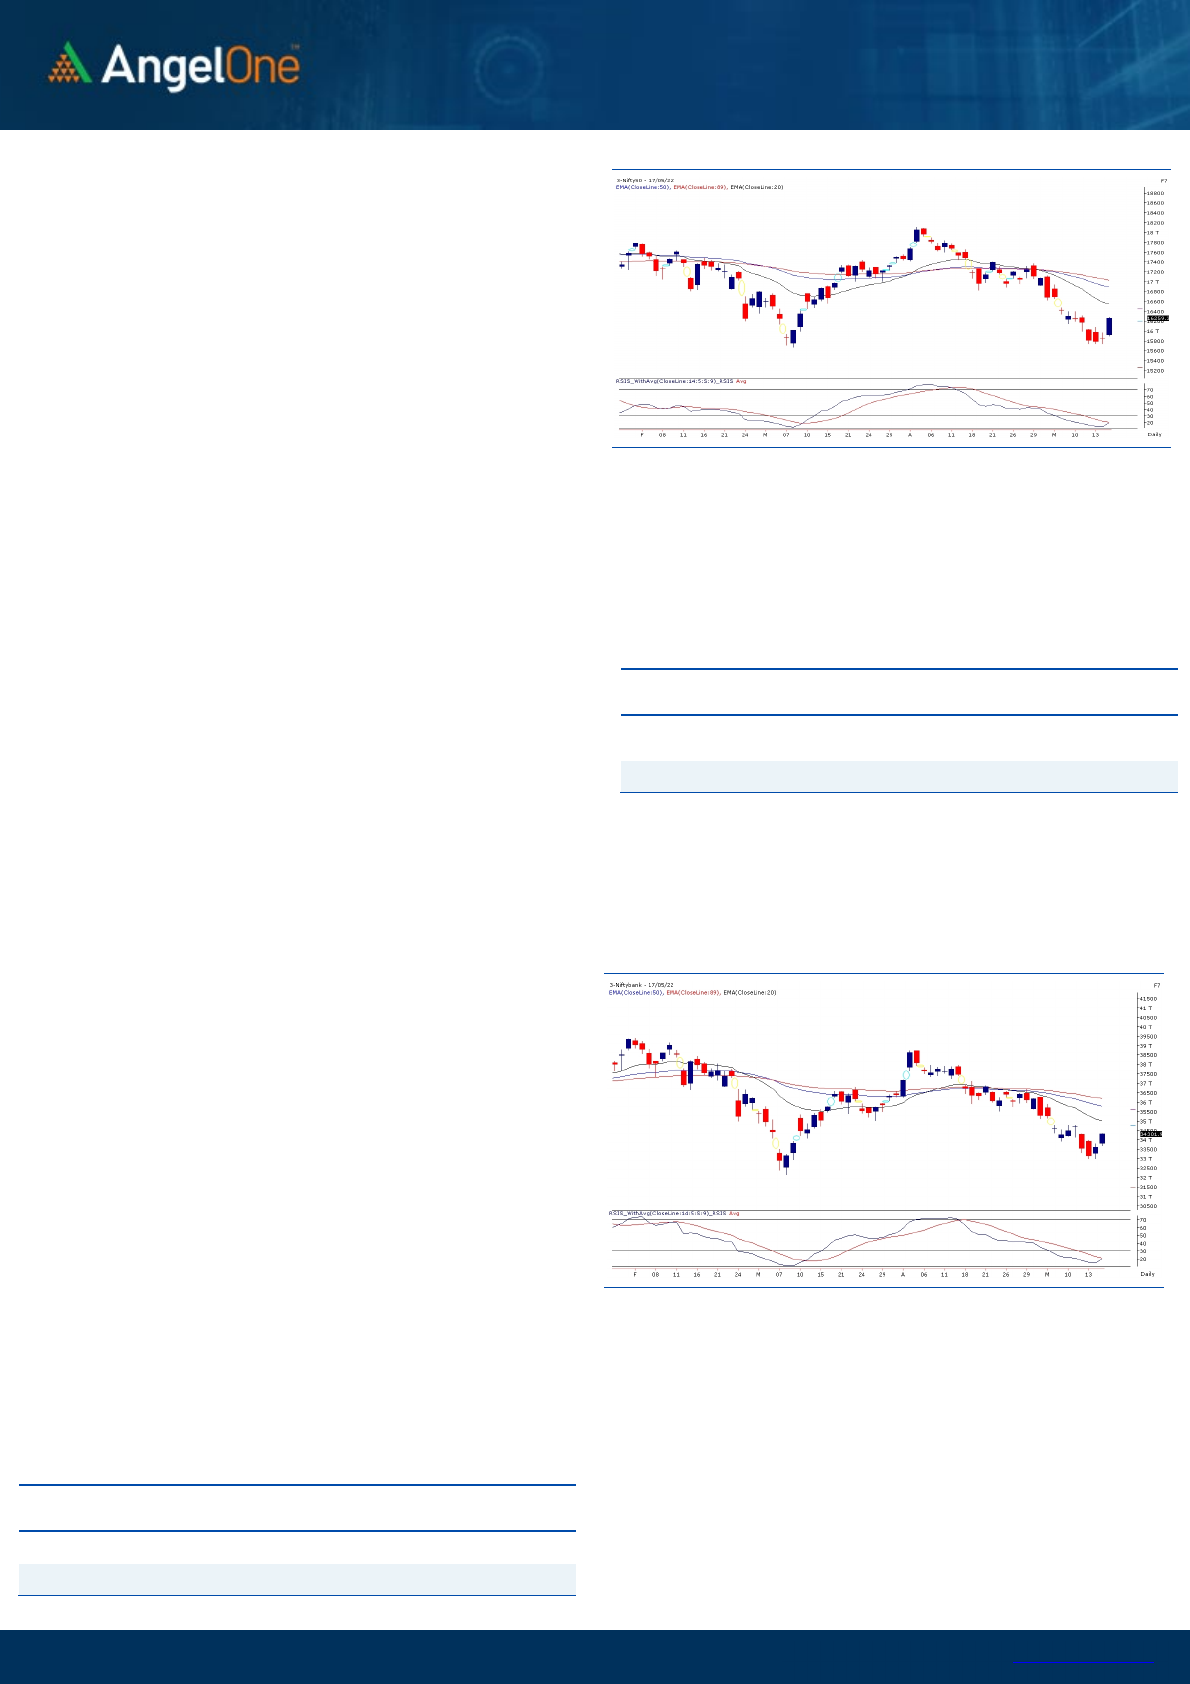
Exhibit 1: Nifty Daily Chart
Exhibit 2: Nifty Bank Daily Chart
Sensex (54318)
/ Nifty (16259)
The global trading screen early in the morning was pleasant and
as a result, our markets started with a modest upside gap
slightly above 15900. However, the momentum accelerated as
the day progressed across the heavyweight spaces to send Nifty
comfortably beyond 16250 on a closing basis. Unlike recent
sessions, the upward rally was here to stay and did not give up
in the latter half. The robust recovery session concluded with
whopping 2.63% gains to bring back a wider smile in traders’
fraternity.
With reference to previous commentary, we had clearly
mentioned how markets are deeply oversold and requires a
small relief on the global front to rebound sharply from their key
supports. The moment we surpassed 16100, the short sellers
were forced to go on the back foot, which provided some impetus
to the convincing move beyond 16250. As of now, yesterday’s rally
should only be construed as a pull back; because markets were
deeply oversold and needed some breather. So rather than
getting complacent, it’s advisable to adopt ‘One step at a time’
strategy. Yes, the kind of recovery we witnessed yesterday, it is
a bit encouraging one and indicates a possible extension towards
16350 – 16500. Hopefully the global screen remains intact like
this, which could provide a much needed push to extend the
move. On the flipside, 16100 – 16000 has now become a
sacrosanct support and till the time, we do not slide below it,
traders can use declines to buy into.
It was a day of broad based participation as lot of beaten down
spaces came back strongly especially, the Metal basket;
courtesy to fresh updates with respect to China reopening.
Hence, traders are advised to keep focusing on individual
counters who are poised for some recovery from their
important supports.
Key Levels
Support 1 – 16100 Resistance 1 – 16350
Support 2 – 16000 Resistance 2 – 16500

www.angelone.in
Technical & Derivatives Report
May 18, 2022
View
The market witnessed strong follow-up momentum
tracking the positive global cues. Broad-based
participation from the heavyweights has made Nifty
bounce beyond the 16250 level.
FIIs were net sellers in the cash market segment
to the tune of Rs. 2192 crores. Simultaneously, in
Index futures, they bought worth Rs. 1064 crores
with a decrease in open interest, indicating some
short covering.
Looking at the F&O data, the stronger hands have
covered their short positions in both indices. On the
options front, a pile-up is visible in the 16000-16100
Put strikes in the options segment, which is
expected to act as a strong support zone. While on
the contrary, a considerable OI concentration is
built on the 16400-16500 call strikes, indicating a
tentative range in the market for the near term.
Considering the momentum in the recent price
action, the sentiments are likely to remain upbeat,
and any minor correction could be seen as an
opportunity to go long. Also, we advocate traders to
trade with a positive bias and should look for stock-
specific trades that are likely to give trending
moves.
Comments
The Nifty futures open interest has decreased by 2.02%.
and BANK Nifty futures open interest has decreased by
1.86% as the market closed at 16259.30.
The Nifty May future closed with a discount of 4.35 point
against a premium of 0.30 point in the last trading
session. The June series closed at a discount of 5.05
point.
The INDIA VIX decreased from 24.52 to 22.74. At the
same time, the PCR-OI of Nifty increased from 0.73 to
1.12.
Few of the liquid counters where we have seen high
cost of carry are ABBOTINDIA, VEDL, HINDALCO,
COROMANDEL and INTELLECT.
Historical Volatility
SCRIP HV
IDEA 95.07
IBULHSGFIN 78.79
ZEEL 72.07
HINDCOPPER 67.92
RBLBANK 66.82
Nifty Vs OI
15000
15500
16000
16500
17000
17500
,0
2,000
4,000
6,000
8,000
10,000
12,000
14,000
16,000
18,000
4-27 4-29 5-4 5-6 5-10 5-12 5-16
Openinterest Nifty
OI Gainers
SCRIP OI
OI
CHG. (%)
PRICE
PRICE
CHG. (%)
COROMANDEL 1630050 40.60 942.75 6.47
CHAMBLFERT 2367000 11.76 405.90 5.55
BAJAJFINSV 945950 10.92 12972.15 2.51
METROPOLIS 505400 10.88 1932.70 -0.45
ABB 363000 9.83 2294.35 1.96
HINDPETRO 12984300 9.82 255.85 0.61
MCX 2933800 9.77 1211.85 3.35
LALPATHLAB 1162500 9.44 2184.65 -1.10
OI Losers
SCRIP OI
OI
CHG. (%)
PRICE
PRICE
CHG. (%)
GUJGASLTD 2480000 -11.90 555.95 -0.47
APOLLOHOSP 2294250 -8.26 3813.15 3.45
INTELLECT 1299750 -6.98 641.20 10.71
COALINDIA 41055000 -6.59 184.55 7.33
GSPL 2094800 -6.37 263.30 2.48
DIXON 845500 -6.11 3489.15 4.31
TATACHEM 5741000 -5.90 971.80 5.28
HINDALCO 43866450 -5.69 428.40 9.19
Put-Call Ratio
SCRIP PCR (OI) PCR (VOL)
NIFTY 1.12 0.81
BANKNIFTY 1.08 0.89
RELIANCE 0.33 0.40
ICICIBANK 0.51 0.52
INFY 0.41 0.48
www.angelone.in
Technical & Derivatives Report
May 18, 2022
Note: Above mentioned Bullish or Bearish Spreads in Nifty (May Series) are given as an information and not as a recommendation.
Nifty
Spot = 1
6259
.30
FII Statistics for
May
1
7
, 2022
Detail Buy
Contracts
Open
Interest
Value
(in Cr.)
Sell
Net
CHANGE
INDEX
FUTURES
4641.35 3577.60 1063.75
164430 13604.10 (8.47)
INDEX
OPTIONS
651522.19 650293.66 1228.53
1770738 145596.99 9.11
STOCK
FUTURES
16242.00 14250.86 1991.14
2339886 145599.45 0.16
STOCK
OPTIONS
8689.93 8786.77 (96.84) 154819 9970.01 (1.12)
Total
681095.47
676908.89
4186.58
4429873
314770.55
3.13
Turnover on
May
1
7
, 2022
Instrument
No. of
Contracts
Turnover
( in Cr. )
Change
(%)
Index
Futures
481910 39730.76 3.63
Index
Options
97869928 8104852.52
24.65
Stock
Futures
976791 59481.59 11.16
Stock
Options
3820853 247445.93 26.22
Total
38,20,853 247445.93 24.47
Bull
-
Call
Spreads
Action Strike Price Risk Reward BEP
Buy
16200 244.45
55.65 44.35 16255.65
Sell
16300 188.80
Buy
16200 244.45
102.20 97.80 16302.20
Sell
16400 142.25
Buy
16300 188.80
46.55 53.45 16346.55
Sell 16400 142.25
Bear
-
Put Spreads
Action Strike Price Risk Reward BEP
Buy
16200 186.85
37.45 62.55 16162.55
Sell
16100 149.40
Buy
16200 186.85
66.80 133.20 16133.20
Sell
16000 120.05
Buy
16100 149.40
29.35 70.65 16070.65
Sell
16000 120.05
Nifty Put
-
Call Analysis
,0
500,000
1000,000
1500,000
2000,000
2500,000
3000,000
3500,000
4000,000
4500,000
5000,000
15600 15700 15800 15900 16000 16100 16200 16300 16400 16500 16600 16700 16800 16900
Call Put

www.angelone.in
Technical & Derivatives Report
May 18, 2022
`
Daily Pivot Levels for Nifty Constituents
Scrips
S2
S1
PIVOT
R1
R2
ADANIPORTS 704 724
736 756 768
APOLLOHOSP 3,620 3,716
3,775 3,871 3,930
ASIANPAINT 2,914 2,982
3,019 3,087 3,125
AXISBANK 635 645
651 661 668
BAJAJ-AUTO 3,690 3,716
3,752 3,778 3,814
BAJFINANCE 5,582 5,710
5,779 5,907 5,976
BAJAJFINSV 12,484 12,728
12,874 13,119 13,265
BPCL 331 337
340 346 349
BHARTIARTL 683 695
703 714 722
BRITANNIA 3,248 3,309
3,346 3,406 3,443
CIPLA 907 922
932 947 957
COALINDIA 169 177
181 189 193
DIVISLAB 4,162 4,233
4,273 4,344 4,384
DRREDDY 3,833 3,868
3,907 3,942 3,980
EICHERMOT 2,559 2,633
2,674 2,748 2,788
GRASIM 1,431 1,456
1,473 1,498 1,515
HCLTECH 1,031 1,057
1,071 1,097 1,112
HDFCBANK 1,291 1,302
1,310 1,321 1,329
HDFCLIFE 537 546
551 560 566
HDFC 2,147 2,169
2,183 2,205 2,218
HEROMOTOCO 2,485 2,504
2,521 2,541 2,558
HINDALCO 382 405
421 444 461
HINDUNILVR 2,192 2,219
2,248 2,274 2,303
ICICIBANK 676 693
702 720 729
INDUSINDBK 882 893
899 910 916
INFY 1,464 1,491
1,508 1,535 1,552
ITC 251 258
262 269 272
JSW STEEL 596 619
632 655 669
KOTAKBANK 1,807 1,824
1,834 1,851 1,862
LT 1,523 1,563
1,586 1,626 1,649
M&M 890 900
909 919 928
MARUTI 7,128 7,330
7,458 7,660 7,787
NESTLEIND 16,067 16,195
16,293 16,421 16,518
NTPC 145 148
149 152 154
ONGC 153 158
161 166 169
POWERGRID 230 235
237 241 243
RELIANCE 2,392 2,461
2,500 2,569 2,608
SBILIFE 1,022 1,046
1,061 1,085 1,100
SHREECEM 21,583 21,809
22,016 22,243 22,450
SBIN 451 459
464 473 478
SUNPHARMA 872 882
889 899 906
TCS 3,306 3,379
3,423 3,496 3,540
TATACONSUM
711 723
733 744 754
TATAMOTORS 398 411
418 432 439
TATASTEEL 1,085 1,137
1,167 1,219 1,249
TECHM 1,170 1,184
1,197 1,211 1,224
TITAN 2,083 2,130
2,157 2,204 2,231
ULTRACEMCO 5,926 6,017
6,071 6,162 6,217
UPL 791 804
812 825 833
WIPRO 461 474
481 494 502

www.angelone.in
Technical & Derivatives Report
May 18, 2022
*
Technical and Derivatives Team:
Sameet Chavan
Chief Analyst
–
Technical & Derivatives
sameet.chavan@angelone.in
Sneha Seth Senior Analyst – Technical & Derivatives sneha.seth@angelone.in
Rajesh Bhosale Technical Analyst rajesh.bhosle@angelone.in
Osho Krishan Senior Analyst – Technical & Derivatives osho.krishan@angelone.in
Research Team Tel: 022 – 39357600 (Extn. 6844) Website: www.angelone.in
For Technical Queries E-mail: technicalresearch-cso@angelone.in
For Derivatives Queries E-mail: derivatives.desk@angelone.in
DISCLAIMER
Angel One Limited (hereinafter referred to as “Angel”) is a registered Member of National Stock Exchange of India Limited, Bombay
Stock Exchange Limited and Metropolitan Stock Exchange Limited. It is also registered as a Depository Participant with CDSL and
Portfolio Manager and investment advisor with SEBI. It also has registration with AMFI as a Mutual Fund Distributor. Angel One
Limited is a registered entity with SEBI for Research Analyst in terms of SEBI (Research Analyst) Regulations, 2014 vide registration
number INH000000164. Angel or its associates has not been debarred/ suspended by SEBI or any other regulatory authority for
accessing /dealing in securities Market.
This document is solely for the personal information of the recipient, and must not be singularly used as the basis of any investment
decision. Nothing in this document should be construed as investment or financial advice. Each recipient of this document should
make such investigations as they deem necessary to arrive at an independent evaluation of an investment in the securities of the
companies referred to in this document (including the merits and risks involved), and should consult their own advisors to determine
the merits and risks of such an investment.
Angel or its associates or research analyst or his relative may have actual/beneficial ownership of 1% or more in the securities of
the subject company at the end of the month immediately preceding the date of publication of the research report. Neither Angel or
its associates nor Research Analysts or his relative has any material conflict of interest at the time of publication of research report.
Angel or its associates might have received any compensation from the companies mentioned in the report during the period
preceding twelve months from the date of this report for services in respect of managing or co-managing public offerings, corporate
finance, investment banking or merchant banking, brokerage services or other advisory service in a merger or specific transaction
in the normal course of business. Angel or its associates did not receive any compensation or other benefits from the companies
mentioned in the report or third party in connection with the research report. Neither Angel nor its research analyst entity has been
engaged in market making activity for the subject company.
Reports based on technical and derivative analysis center on studying charts of a stock's price movement, outstanding positions and
trading volume, as opposed to focusing on a company's fundamentals and, as such, may not match with a report on a company's
fundamentals. Investors are advised to refer the Fundamental and Technical Research Reports available on our website to evaluate
the contrary view, if any.
The information in this document has been printed on the basis of publicly available information, internal data and other reliable
sources believed to be true, but we do not represent that it is accurate or complete and it should not be relied on as such, as this
document is for general guidance only. Angel One Limited or any of its affiliates/ group companies shall not be in any way responsible
for any loss or damage that may arise to any person from any inadvertent error in the information contained in this report. Angel One
Limited has not independently verified all the information contained within this document. Accordingly, we cannot testify, nor make
any representation or warranty, express or implied, to the accuracy, contents or data contained within this document. While Angel
One Limited endeavors to update on a reasonable basis the information discussed in this material, there may be regulatory,
compliance, or other reasons that prevent us from doing so.
This document is being supplied to you solely for your information, and its contents, information or data may not be reproduced,
redistributed or passed on, directly or indirectly.
Neither Angel One Limited, nor its directors, employees or affiliates shall be liable for any loss or damage that may arise from or in
connection with the use of this information. Angel or its associates or Research Analyst or his relative might have financial interest
in the subject company. Research analyst has not served as an officer, director or employee of the subject company.
