November 17, 2021
www.angelone.in
Technical & Derivatives Report
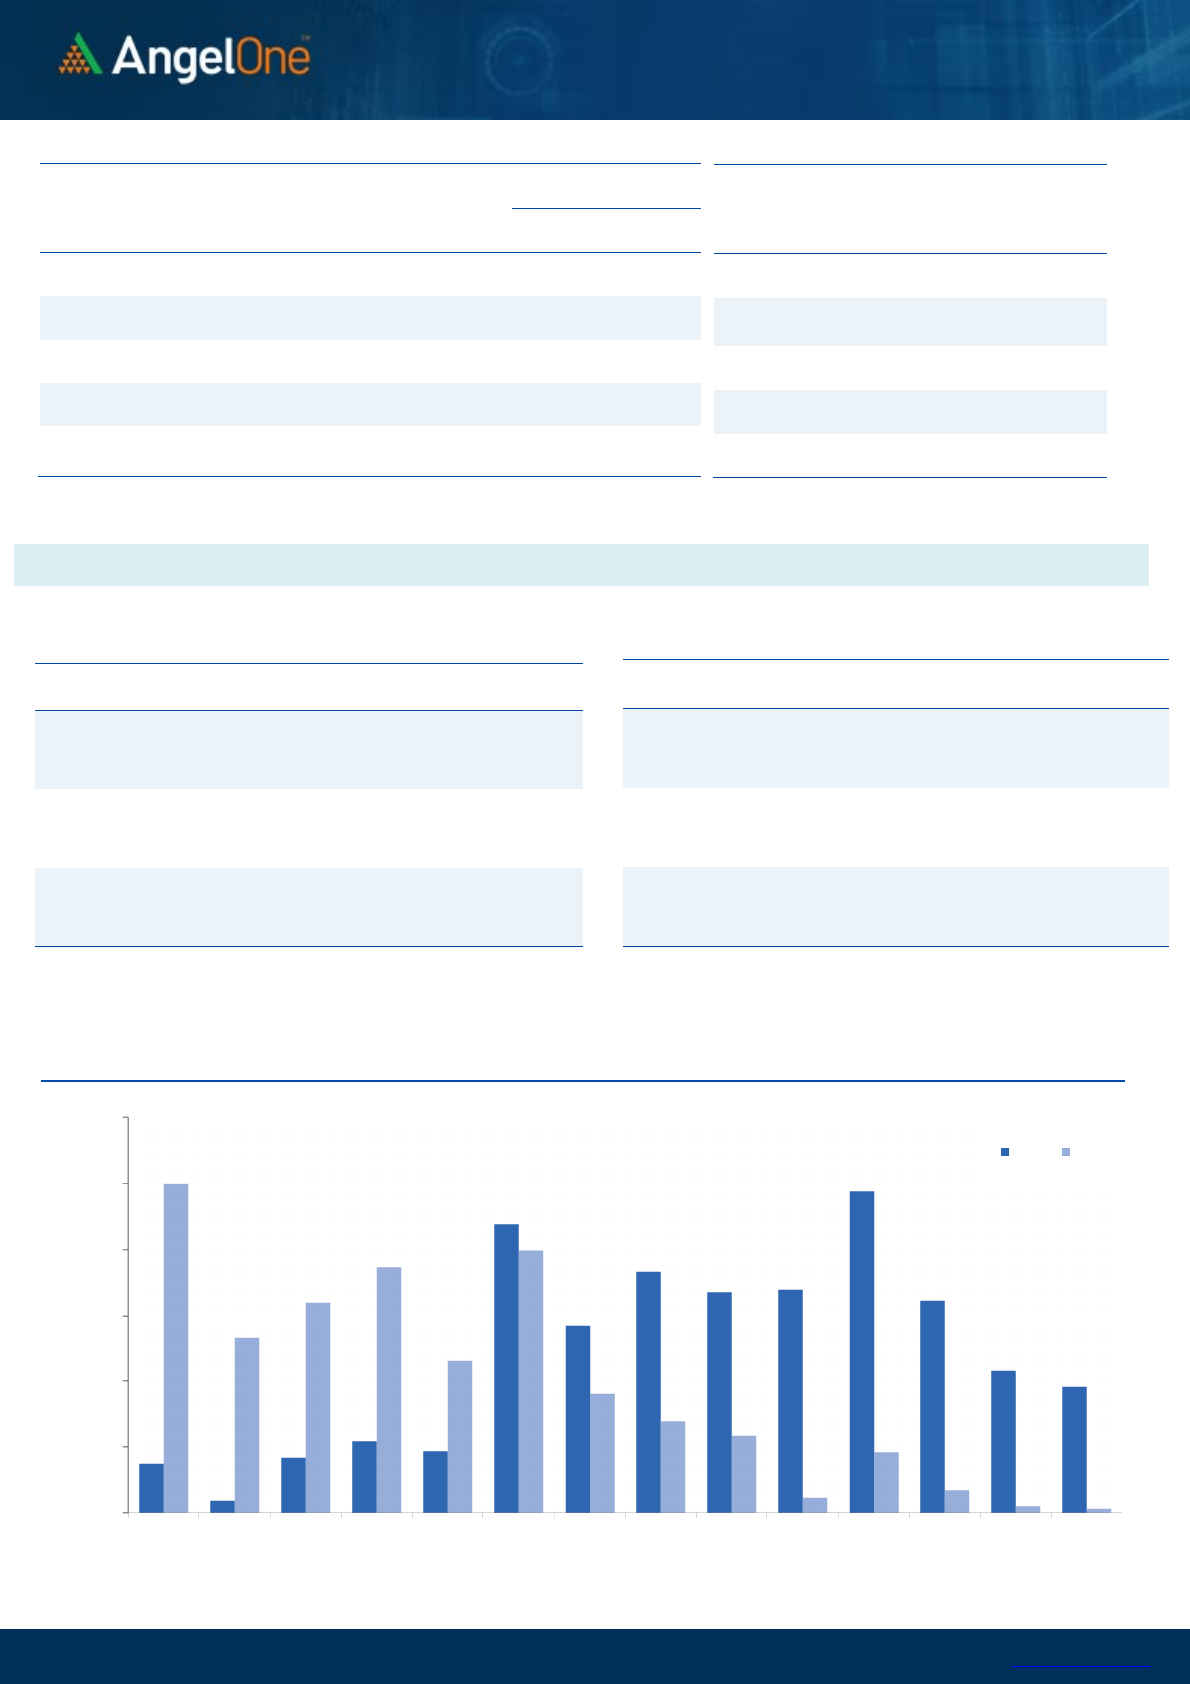
Nifty Bank Outlook - (38307)
We had a flat start yesterday and then index attracted fresh selling
right from the word go. During initial two hours, the banking index
corrected below 38300 and then made an attempt to recover but once
again this got sold into to almost touch 38200 in the final hour. Finally,
we conclude yet another session in red with a cut of a percent to
previous close.
As mentioned in our last couple of articles, we were uncomfortable in
initiating any bullish bets specifically in this space considering its
underperformance. Yesterday, the index even tested the previous
swing lows of 38346 and further selling may easily drag the BankNifty
below 37500. Thus, we maintain our cautious stance on market and
we advise exiting any longs in pull back. As far as levels are concerned,
38700-38800 shall be looked as strong resistance zone; whereas,
37700 and 37400 are the demand zone now.
Key Levels
Support 1 – 37700 Resistance 1 – 38800
Support 2 – 37400 Resistance 2 – 38700
Exhibit 2: Nifty Bank Daily Chart
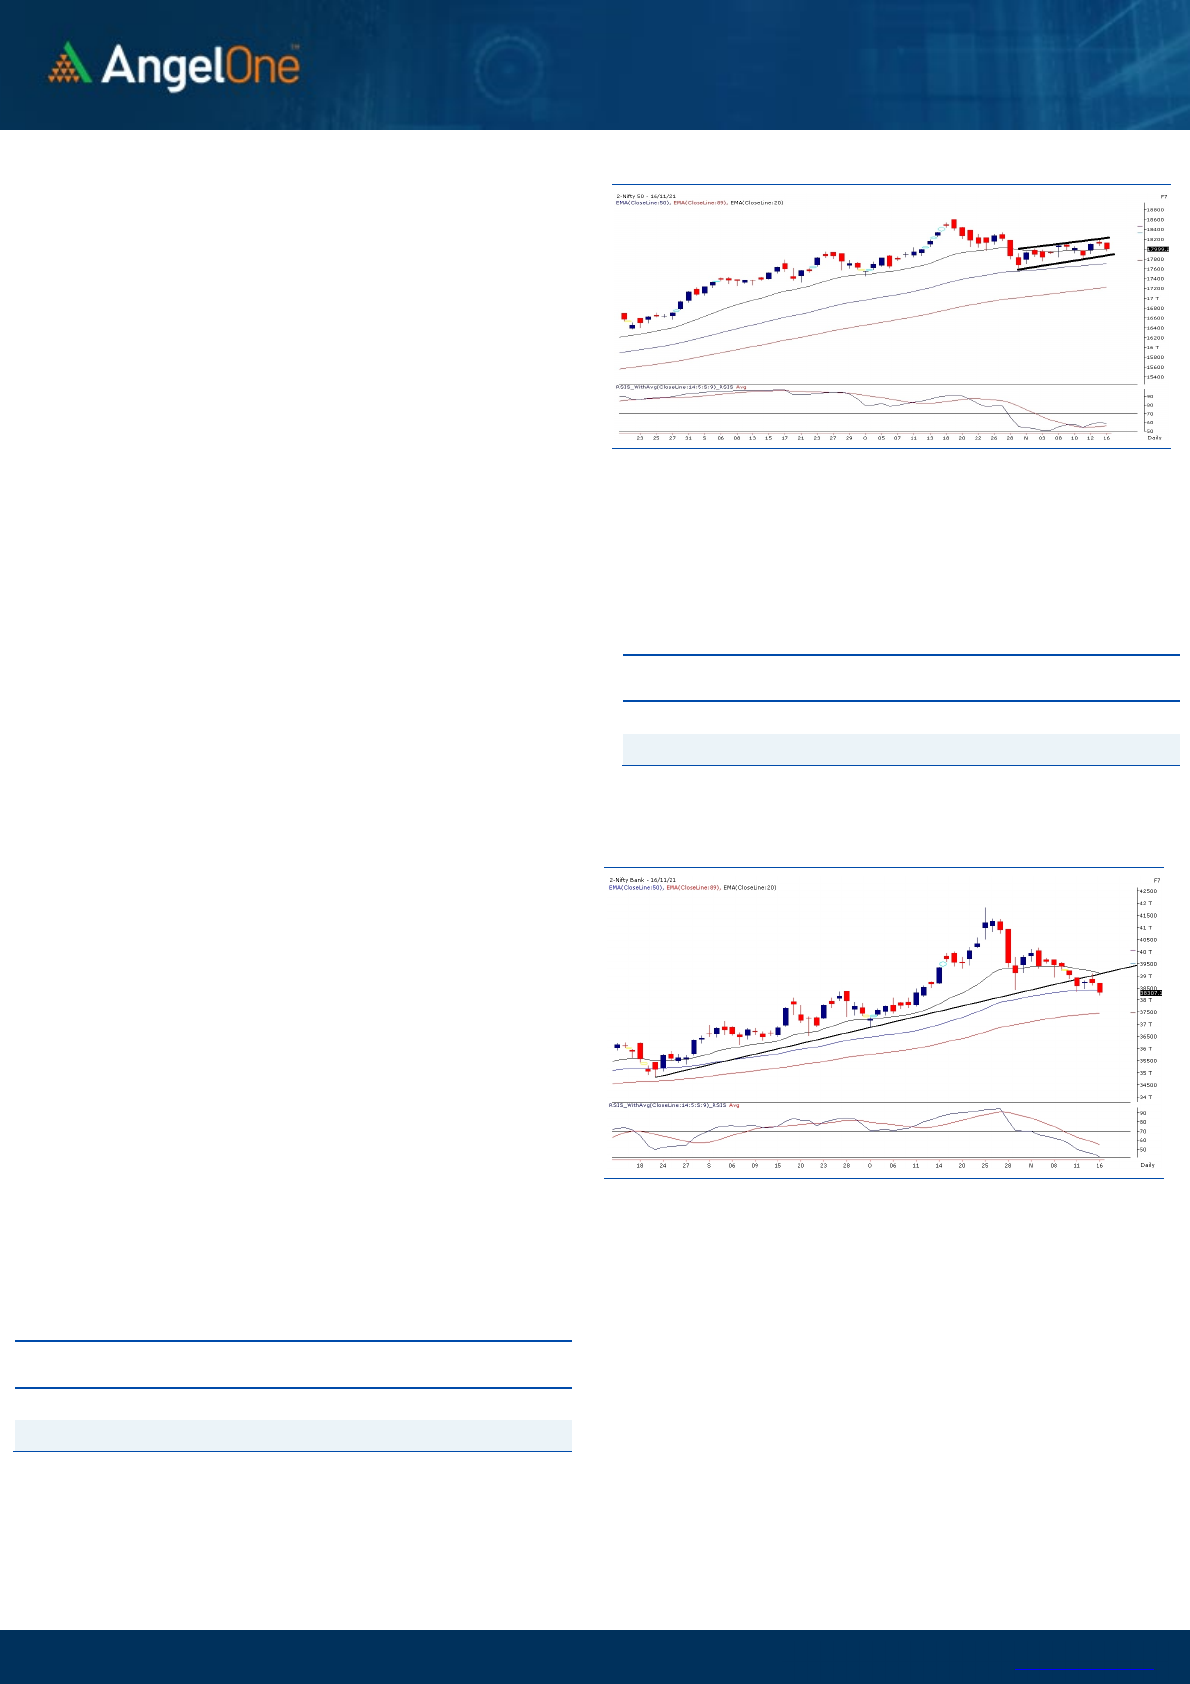
Sensex (60322) / Nifty (17999)
Market had a quiet start yesterday marginally in the green owing to
mixed global cues. During the first couple of hours Nifty came off a bit
to test 18050 and then went through a brief period of consolidation.
Around the midsession, the buying emerged in some of the
heavyweights which pulled the index back above the 18100 mark.
However as we stepped into the final session of the day, index started
becoming a bit nervous. In fact due to aggravated selling towards the
end, Nifty went on to slide below 18000 with a cut over half a percent
to the previous close.
Since last 10 odd sessions, Nifty has done nothing. In fact if we take a
close look at the daily time frame chart, we can see prices oscillating
precisely within the boundaries of a small ‘Upward Sloping channel’.
Due to last two days’ of small correction, we are trading at the mid-
point of this trading range; but some of the heavyweights are now
indicating a possible weakness from hereon. For the coming session,
17900 – 17800 are the levels to watch out for. This being the lower
boundary of the ‘Channel’ pattern, a sustainable breach of this lower
range would lead to further correction in coming days.
Exhibit 1: Nifty Daily Chart
On the flipside,
18130
followed by
18200
are to be considered as
stiff hurdles. We continue to remain cautious on the market and
advise using intraday rebounds to lighten up longs. Yesterday’s
correction was mainly led by RELIANCE and banking space; hence all
eyes on these going ahead as they are going to dictate the near term
direction.
Key Levels
Support 1 – 17900 Resistance 1 – 18130
Support 2 – 17800 Resistance 2 – 18200

www.angelone.in
Technical & Derivatives Report
November 17, 2021
View
Yesterday, Nifty started on a positive note and remained
in a range for the major part. In the penultimate hour
however it started moving lower and eventually ended
with a loss of more than half a percent tad below 18000.
FIIs were net sellers in the cash market segment to the
tune of Rs. 561 crores. In index futures, they sold worth Rs.
578 crores with decrease in open interest indicating long
unwinding in yesterday’s session.
Nifty futures witnessed a marginal increase in open
interest in yesterday’s fall whereas Bank Nifty witnessed a
good build up indicating fresh short formations. FIIs were
sellers in cash segment and they unwounded their longs in
index futures. With yesterday’s fall, the put writers ran for
cover and hence we witnessed unwinding in strikes of
17900-18000 put options. On the flip side, fresh build up is
seen at 18100 call strikes. With above data, we sense
bounce are likely to get sold into and 18100 shall now act
as stiff resistance. On the lower side, 17900 followed by
17800 are the support that can be tested.
Comments
The Nifty futures open interest has increased by 0.86%. Bank
Nifty futures open interest has increased by 10.36% as
market closed at 17999.20 levels.
The Nifty November future closed with a premium of 4.8
point against a premium of 31.55 point in last trading session.
The December series closed at a premium of 64.05 point.
The INDIA VIX decreased from 15.46 to 15.20. At the same
time, the PCR-OI of Nifty has decreased from 0.99 to 0.86.
Few of the liquid counters where we have seen high cost of
carry are CROMPTON, INDUSTOWER, GSPL, TVSMOTOR, AND
INDHOTEL
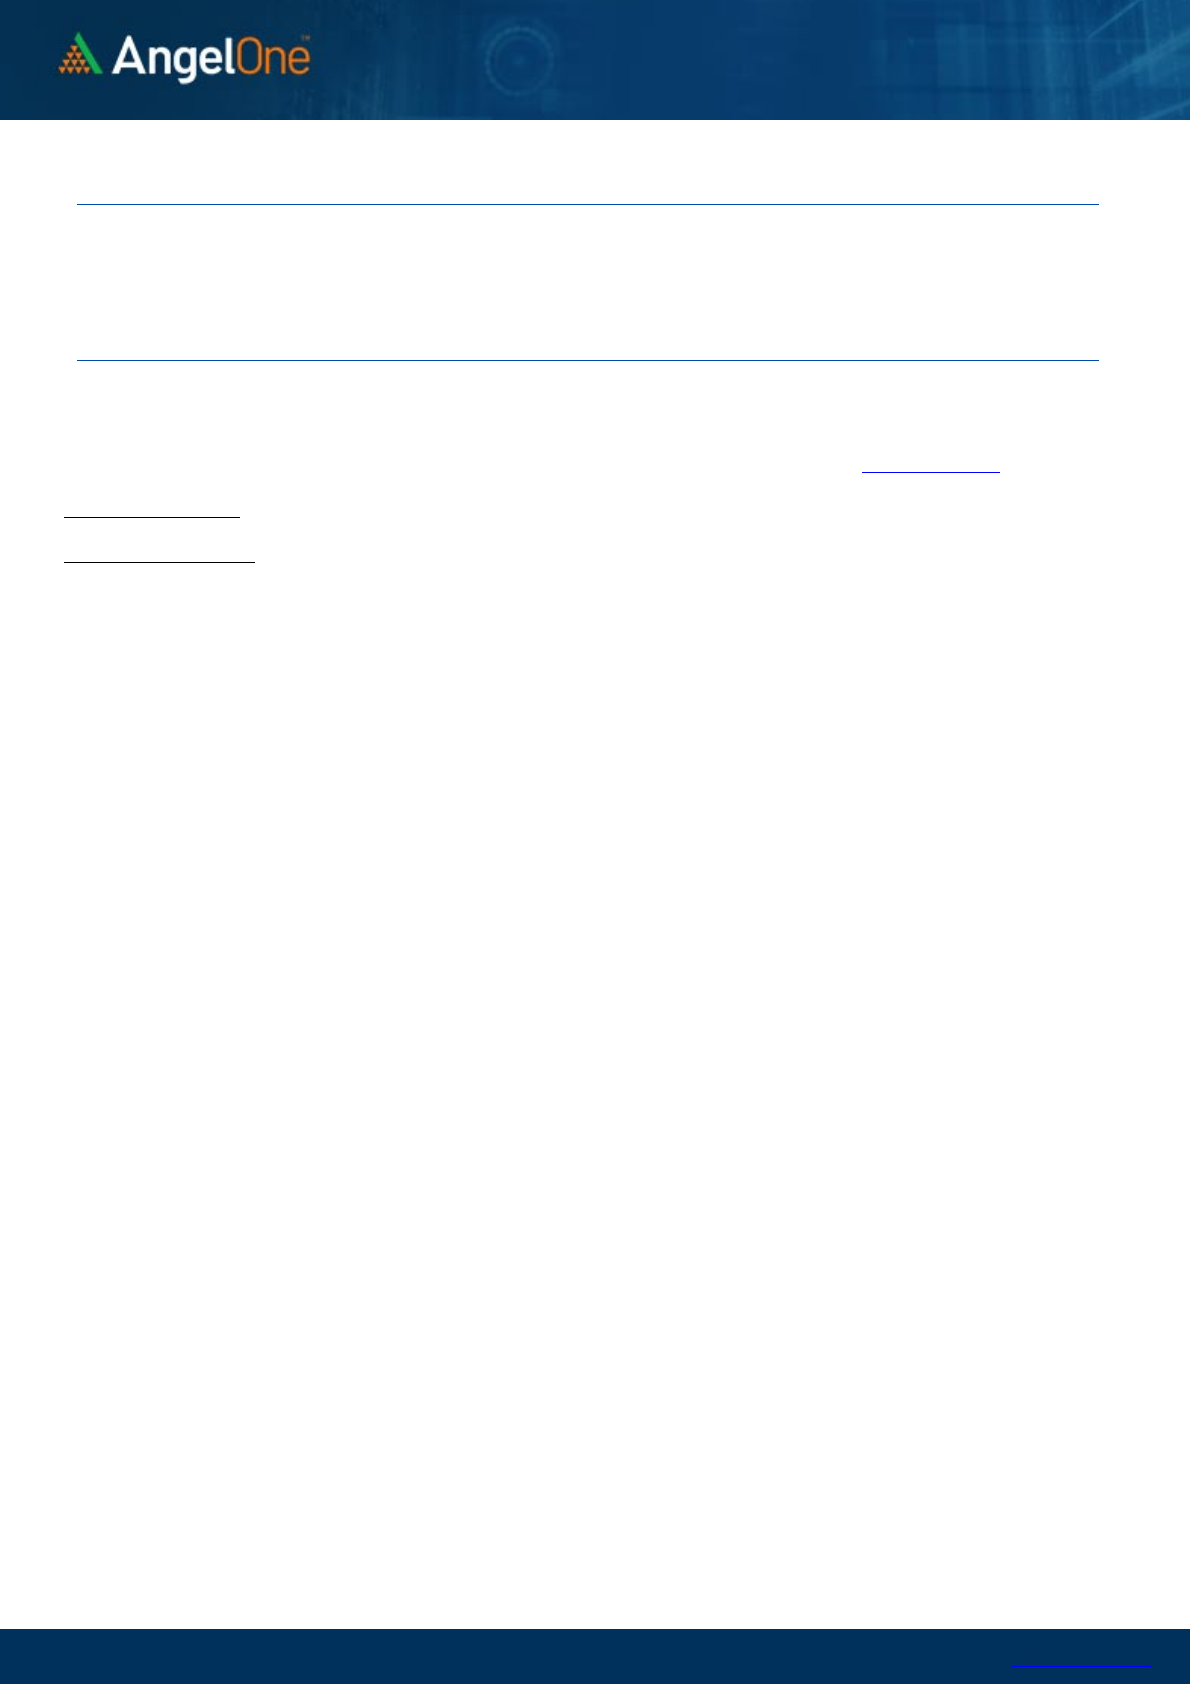
Nifty Vs OI
17400
17500
17600
17700
17800
17900
18000
18100
18200
18300
18400
,0
2,000
4,000
6,000
8,000
10,000
12,000
14,000
16,000
10-20 10-22 10-26 10-28 11-1 11-3 11-5 11-11 11-15
(`000)
Openinterest Nifty
OI Gainers
SCRIP OI
OI
CHG. (%)
PRICE
PRICE
CHG. (%)
BSOFT
3205800 35.20 438.55 4.42
CHAMBLFERT
1231500 28.28 376.15 5.67
COFORGE
738600 22.65 5721.75 4.21
ASHOKLEY
50386500 17.52 147.10 -3.64
MARUTI
2860700 15.43 8050.35 7.15
INDHOTEL
18794806 10.92 216.90 0.30
M&M
12226200 10.87 960.30 3.35
FSL
7129200 9.81 174.50 3.83
OI Losers
SCRIP OI
OI
CHG. (%)
PRICE
PRICE
CHG. (%)
IRCTC
13673375 -11.97 921.05 1.71
BIOCON
14848800 -9.50 369.35 2.15
POWERGRID
22137283 -9.45 187.60 -0.42
HEROMOTOCO
4500000 -7.59 2750.90 2.01
SYNGENE
1430550 -7.32 602.75 1.59
BOSCHLTD
157850 -6.40 18617.25 1.78
AARTIIND
3529200 -6.40 960.30 -0.30
TECHM
9876000 -6.15 1599.95 1.26
Put-Call Ratio
SCRIP PCR-OI PCR-VOL
NIFTY
0.86 0.85
BANKNIFTY
0.55 0.96
RELIANCE
0.46 0.44
ICICIBANK
0.40 0.37
INFY
0.51 0.37
Historical Volatility
SCRIP HV
MARUTI
37.29
METROPOLIS
50.74
MOTHERSUMI
56.33
CHAMBLFERT
53.12
SHREECEM
36.02
www.angelone.in
Technical & Derivatives Report
November 17, 2021
Note: Above mentioned Bullish or Bearish Spreads in Nifty (November Series) are given as an information and not as a recommendation.
Nifty Spot = 17999.20
FII Statistics for November 16, 2021
Detail Buy
Net Contracts
Open Interest
Sell
Value
(in Cr.)
Change
INDEX
FUTURES
3828.19 4406.14 (577.95) 166179 15245.60 (1.25)
INDEX
OPTIONS
405282.86 407388.58 (2105.72) 1600669 146912.94 4.00
297314.41
STOCK
FUTURES
14590.85 14559.58 31.27
1827727 136739.94 1.21
STOCK
OPTIONS
23362.77 23392.88 (30.11) 345347 26321.50 1.83
Total
447064.67
449747.18
(2682.51) 3939922
325219.98
2.27
Turnover on November 16, 2021
Instrument
No. of
Contracts
Turnover
( in Cr. )
Change
(%)
Index Futures
276983 25804.90 22.84
Index Options
53109499 5009316.75 26.84
Stock Futures
901940 70415.79 16.02
Stock Options
3632476 293429.49 28.61
Total
5,79,20,898
5398966.93 26.76
Bull-Call Spreads
Action Strike Price Risk Reward BEP
Buy
18000 165.15
46.75 53.25 18046.75
Sell
18100 118.40
Buy
18000 165.15
84.85 115.15 18084.85
Sell
18200 80.30
Buy
18100 118.40
38.10 61.90 18138.10
Sell
18200 80.30
Bear-Put Spreads
Action Strike Price Risk Reward BEP
Buy
18000 153.10
40.05 59.95 17959.95
Sell
17900 113.05
Buy
18000 153.10
73.90 126.10 17926.10
Sell
17800 79.20
Buy
17900 113.05
33.85 66.15 17866.15
Sell
17800 79.20
Nifty Put-Call Analysis
,0
500,000
1000,000
1500,000
2000,000
2500,000
3000,000
17500 17600 17700 17800 17900 18000 18100 18200 18300 18400 18500 18600 18700 18800
Call Put

www.angelone.in
Technical & Derivatives Report
November 17, 2021
`
Daily Pivot Levels for Nifty Constituents
Scrips S2 S1 PIVOT R1 R2
ADANIPORTS 732 739
751 758 769
ASIANPAINT 3,071 3,112
3,160 3,200 3,249
AXISBANK 715 721
727 733 739
BAJAJ-AUTO 3,546 3,577
3,615 3,646 3,683
BAJFINANCE 7,420 7,488
7,569 7,637 7,718
BAJAJFINSV 17,888 18,049
18,280 18,441 18,672
BPCL 413 417
422 425 430
BHARTIARTL 718 724
733 739 748
BRITANNIA 3,632 3,661
3,711 3,740 3,790
CIPLA 903 913
928 937 953
COALINDIA 157 158
160 161 163
DIVISLAB 4,797 4,825
4,870 4,898 4,943
DRREDDY 4,735 4,776
4,839 4,880 4,942
EICHERMOT 2,611 2,661
2,700 2,750 2,789
GRASIM 1,780 1,802
1,838 1,860 1,896
HCLTECH 1,151 1,157
1,166 1,172 1,182
HDFCBANK 1,533 1,541
1,549 1,556 1,565
HDFCLIFE 707 710
715 718 723
HDFC 2,936 2,956
2,977 2,997 3,019
HEROMOTOCO 2,672 2,712
2,740 2,780 2,808
HINDALCO 433 439
450 456 466
HINDUNILVR 2,379 2,393
2,414 2,428 2,448
ICICIBANK 754 759
767 773 781
IOC 129 130
132 133 135
INDUSINDBK 1,001 1,011
1,028 1,039 1,056
INFY 1,761 1,777
1,793 1,809 1,825
ITC 232 234
237 238 241
JSW STEEL 647 656
665 674 683
KOTAKBANK 2,052 2,067
2,086 2,101 2,119
LT 1,924 1,940
1,960 1,976 1,996
M&M 910 935
951 976 991
MARUTI 7,311 7,681
7,905 8,274 8,498
NESTLEIND 19,183 19,322
19,461 19,600 19,739
NTPC 132 133
135 137 139
ONGC 155 156
158 159 161
POWERGRID 184 186
188 190 193
RELIANCE 2,449 2,484
2,529 2,564 2,609
SBILIFE 1,136 1,144
1,159 1,168 1,183
SHREECEM 27,199 27,669
28,472 28,942 29,745
SBIN 485 490
499 504 513
SUNPHARMA 782 790
804 812 826
TCS 3,524 3,540
3,558 3,574 3,592
TATACONSUM
813 823
840 851 868
TATAMOTORS 497 508
517 529 538
TATASTEEL 1,201 1,215
1,238 1,252 1,275
TECHM 1,565 1,582
1,594 1,611 1,623
TITAN 2,503 2,517
2,534 2,549 2,566
ULTRACEMCO 7,677 7,779
7,959 8,062 8,242
UPL 767 773
784 790 801
WIPRO 648 654
662 669 676
www.angelone.in
Technical & Derivatives Report
November 17, 2021
*
Research Team Tel: 022 – 39357600 (Extn. 6844) Website: www.angelone.in
For Technical Queries E-mail: technicalresearch-cso@angelbroking.com
For Derivatives Queries E-mail: derivatives.desk@angelbroking.com
DISCLAIMER
Angel Broking Limited (hereinafter referred to as “Angel”) is a registered Member of National Stock Exchange of India Limited,
Bombay Stock Exchange Limited and Metropolitan Stock Exchange Limited. It is also registered as a Depository Participant with
CDSL and Portfolio Manager and Investment Adviser with SEBI. It also has registration with AMFI as a Mutual Fund Distributor. Angel
Broking Limited is a registered entity with SEBI for Research Analyst in terms of SEBI (Research Analyst) Regulations, 2014 vide
registration number INH000000164. Angel or its associates has not been debarred/ suspended by SEBI or any other regulatory
authority for accessing /dealing in securities Market. Angel or its associates/analyst has not received any compensation / managed
or co-managed public offering of securities of the company covered by Analyst during the past twelve months.
This document is solely for the personal information of the recipient, and must not be singularly used as the basis of any investment
decision. Nothing in this document should be construed as investment or financial advice. Each recipient of this document should
make such investigations as they deem necessary to arrive at an independent evaluation of an investment in the securities of the
companies referred to in this document (including the merits and risks involved), and should consult their own advisors to determine
the merits and risks of such an investment.
Reports based on technical and derivative analysis center on studying charts of a stock's price movement, outstanding positions and
trading volume, as opposed to focusing on a company's fundamentals and, as such, may not match with a report on a company's
fundamentals. Investors are advised to refer the Fundamental and Technical Research Reports available on our website to evaluate
the contrary view, if any.
The information in this document has been printed on the basis of publicly available information, internal data and other reliable
sources believed to be true, but we do not represent that it is accurate or complete and it should not be relied on as such, as this
document is for general guidance only. Angel Broking Limited or any of its affiliates/ group companies shall not be in any way
responsible for any loss or damage that may arise to any person from any inadvertent error in the information contained in this
report. Angel Broking Limited has not independently verified all the information contained within this document. Accordingly, we
cannot testify, nor make any representation or warranty, express or implied, to the accuracy, contents or data contained within this
document. While Angel Broking Limited endeavors to update on a reasonable basis the information discussed in this material, there
may be regulatory, compliance, or other reasons that prevent us from doing so.
This document is being supplied to you solely for your information, and its contents, information or data may not be reproduced,
redistributed or passed on, directly or indirectly.
Neither Angel Broking Limited, nor its directors, employees or affiliates shall be liable for any loss or damage that may arise from
or in connection with the use of this information.
Technical and Derivatives Team:
Sameet Chavan Chief Analyst – Technical & Derivatives sameet.chavan@angelone.in
Rajesh Bhosale Technical Analyst rajesh.bhosle@angelone.in
Sneha Seth Derivatives Analyst sneha.seth@angelone.in
