May 17
, 2022
www.angelone.in
Technical & Derivatives Report
Nifty Bank Outlook
-
(33
598
)
Bank Nifty started the week positively and remained in a range
throughout the session. The real action was seen outside the
index as many individual counters were buzzing as they gave
splendid intraday moves. Eventually, the bank index
outperformed and ended with gains of 1.44% tad below 33600.
The undertone remains weak however the RSI indicator is still
in a deep oversold territory and hence one should refrain from
going aggressive shorts at current levels. In fact, the last two
sessions low precisely around the 33000 levels indicates some
respites after the recent sharp sell-off. Along with it the PSU
banks that were laggards recently showed some strong positive
moves yesterday; giving us an idea that one should ideally focus
on a stock-specific approach. As far as levels are concerned,
the 33000 level remains a strong support level and if in case it's
broken even then we don't see an immediate sharp sell-off this
is due to the oversold conditions. On the higher side, 34000 is
the immediate resistance above which we see a strong relief
rally.
Key Levels
Support 1 – 33200 Resistance 1 – 34000
Support 2 – 33000 Resistance 2 – 34350
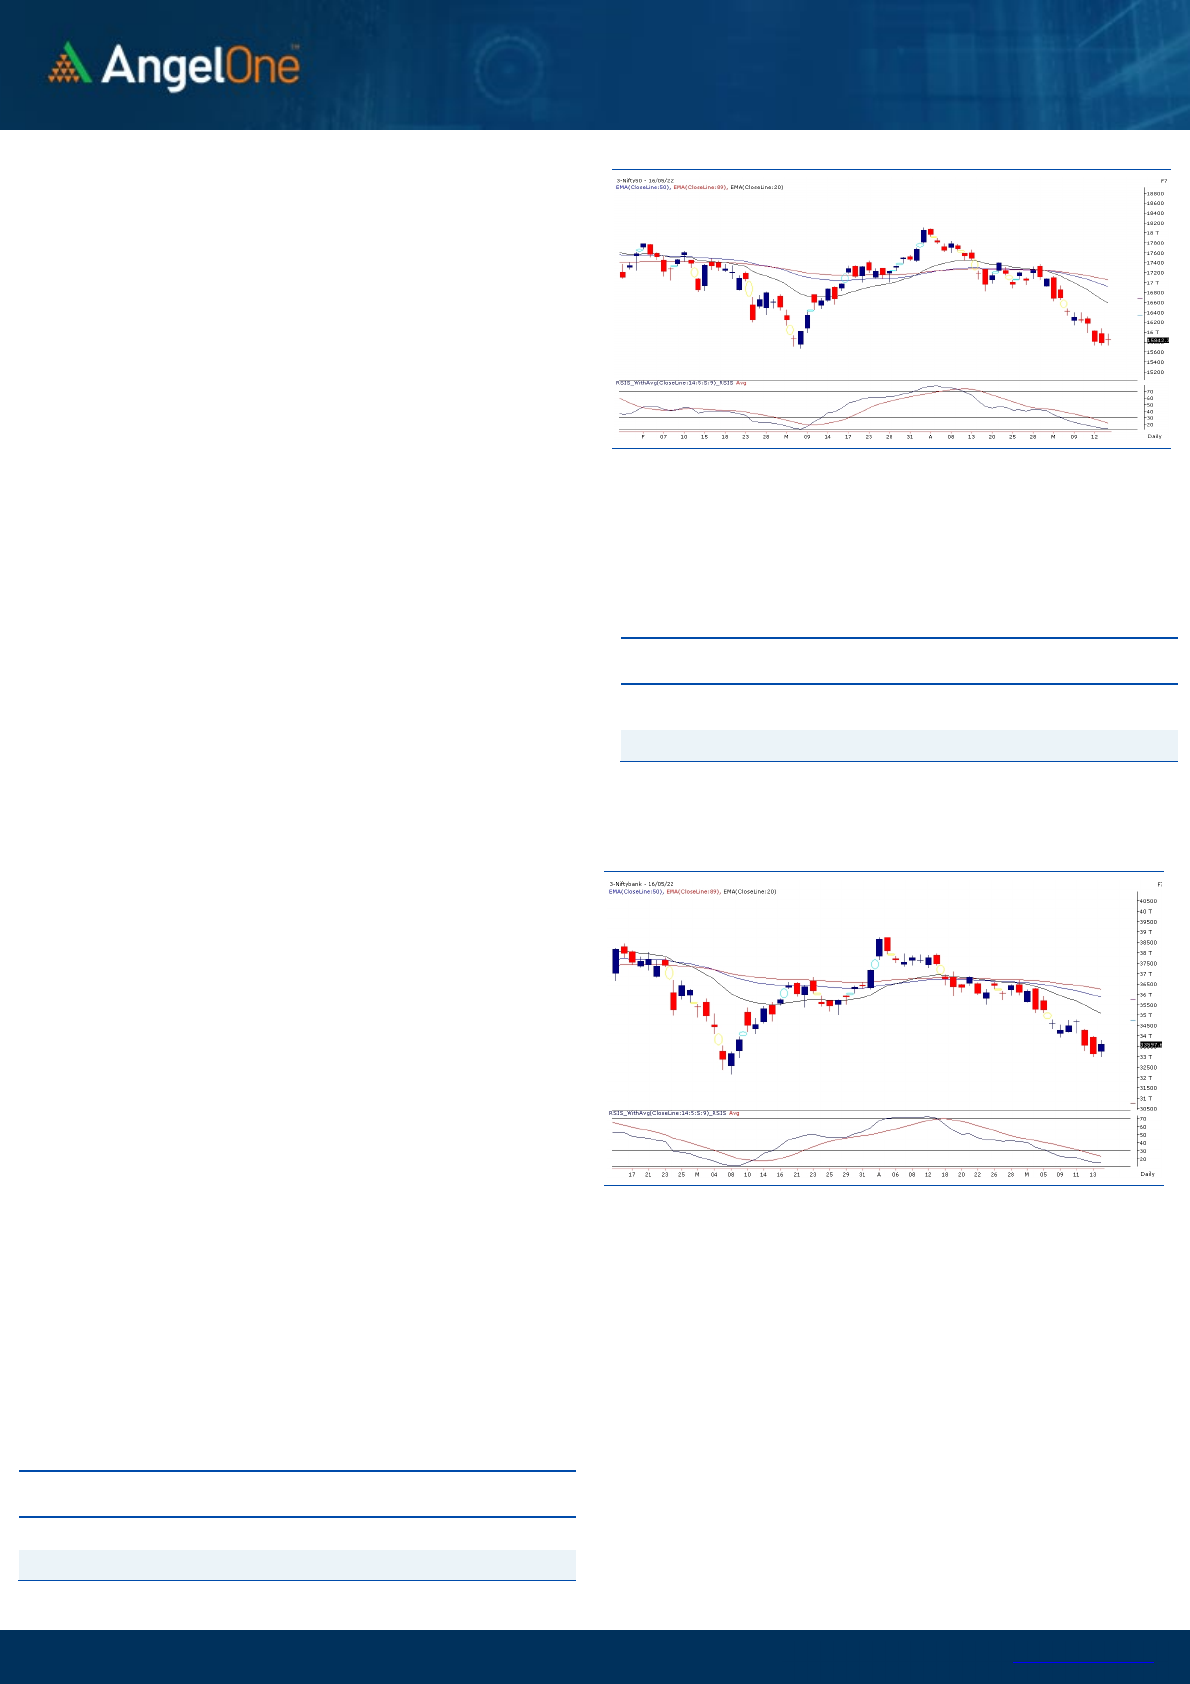
Exhibit 1: Nifty
Daily
Chart
Exhibit 2: Nifty Bank Daily Chart
Sensex (52974) / Nifty (15842
)
Trading for the week started on a pleasant note despite sluggish
global cues. In the initial hour, the gains extended to move
towards the 16000 mark. Similar to recent trend, the profit
booking took place at higher levels to erase all gains around the
midsession. Although market recovered slightly thereafter, the
overall movement was quite choppy to conclude the day around
15850 with nearly four tenths of a percent gains.
Last three sessions’ lows are precisely the same and hence, the
selling seems to have reduced a bit as we approached the key
support zone 15700 – 15600. However this does not mean we are
completely out of the woods. For a time being, 15700 – 16100 has
become a trading range for Nifty and only a sustainable move
beyond 16100 would see some convincing rebound in the market.
On the flipside, as of now, we do not expect a major downside
below 15700 – 15600 as markets are extremely oversold and
hence, any breach of lower levels would probably give some
false breakdown.
Hence, traders are advised not to trade aggressively on the
short side here. Rather a small relief globally would provide
much needed bounce back rally in so many beaten down
counters. It’s better to take one step at a time and keep a close
tab on global developments, which are likely to influence our
markets in the near term.
Key Levels
Support 1 – 15670 Resistance 1 – 16000
Support 2 – 15600 Resistance 2 – 16100

www.angelone.in
Technical & Derivatives Report
May 17
, 2022
View
The market witnessed some respite to the
weakness, though the overall movement was quite
choppy to conclude the day around 15850 with
nearly four-tenths of a percent gain.
FIIs were net sellers in the cash market segment
to the tune of Rs. 1789 crores. Simultaneously, in
Index futures, they bought worth Rs. 980 crores
with increased open interest, indicating the
formation of long positions.
Looking at the F&O data, a long formation was seen
in the benchmark index, while short covering was
witnessed in the banking space. On the options
front, a pile-up is visible in the 15800-15700 Put
strikes in the options segment, which is expected to
act as a critical support zone. While on the contrary,
a considerable OI concentration is built on the
16000-16100 call strikes, breaching which some
assurance could be seen in the market. Considering
recent domestic and global developments,
indecisiveness could be sensed among the market
participants as a slender range-bound movement
has been seen in the past couple of trading
sessions. Hence, traders are advised to stay
cautious and avoid aggressive bets and focus on
stock-specific actions.
Comments
The Nifty futures open interest has increased by 0.74%.
and BANK Nifty futures open interest has decreased by
10.78% as the market closed at 15842.30.
The Nifty May future closed with a premium of 0.30 point
against a premium of 4.45 point in the last trading
session. The June series closed at a premium of 1.65
point.
The INDIA VIX increased from 23.48 to 24.52. At the
same time, the PCR-OI of Nifty remains unchanged to
0.73.
Few of the liquid counters where we have seen high
cost of carry are BALKRISIND, EICHERMOT, HONUT,
ESCORTS and HAL.
Historical Volatility
SCRIP HV
IDEA 95.31
IBULHSGFIN 78.98
ZEEL 72.17
HINDCOPPER 66.89
RBLBANK 66.82
Nifty Vs OI
15000
15500
16000
16500
17000
17500
,0
2,000
4,000
6,000
8,000
10,000
12,000
14,000
16,000
18,000
4-26 4-28 5-2 5-5 5-9 5-11 5-13
Openinterest Nifty
OI Gainers
SCRIP OI
OI
CHG. (%)
PRICE
PRICE
CHG. (%)
HONAUT 14655 42.84 32377.65 -6.19
LALPATHLAB 1062250 23.32 2206.35 -3.92
METROPOLIS 455800 21.03 1946.70 -4.77
SHREECEM 244150 16.12 21980.95 -3.16
BAJAJFINSV 852800 14.10 12655.50 0.74
ACC 2707500 13.14 2196.15 4.31
EICHERMOT 3599750 11.79 2617.95 7.37
ABFRL 12277200 11.68 271.70 3.14
OI Losers
SCRIP OI
OI
CHG. (%)
PRICE
PRICE
CHG. (%)
GNFC 5406700 -8.57 623.80 1.34
APOLLOTYRE 11178000 -8.29 210.35 4.77
BALKRISIND 1223600 -7.61 2050.35 8.36
ESCORTS 3335750 -6.84 1645.45 5.81
ABB 330500 -5.84 2251.75 -1.33
AMBUJACEM 46743000 -5.46 368.00 2.79
UPL 21868600 -4.58 802.25 2.57
SBIN 71460000 -4.11 455.00 2.37
Put-Call Ratio
SCRIP PCR (OI) PCR (VOL)
NIFTY 0.73 0.72
BANKNIFTY 0.74 0.90
RELIANCE 0.28 0.38
ICICIBANK 0.46 0.55
INFY 0.39 0.44

www.angelone.in
Technical & Derivatives Report
May 17
, 2022
Note: Above mentioned Bullish or Bearish Spreads in Nifty (May Series) are given as an information and not as a recommendation.
Nifty Spot = 15
842
.
30
FII Statistics for
May
1
6
, 2022
Detail Buy
Contracts
Open
Interest
Value
(in Cr.)
Sell
Net
CHANGE
INDEX
FUTURES
3960.65 2980.19 980.46
179645 14507.52 5.46
INDEX
OPTIONS
614919.45 616399.37 (1479.92) 1622913 129946.45 (2.48)
STOCK
FUTURES
15537.33 13497.99 2039.34
2336216 141388.55 0.95
STOCK
OPTIONS
7643.59 7553.52 90.07
156577 9757.74 2.35
Total
642061.02
640431.07
1629.95
4295351
295600.26
(0.15)
Turnover on
May
1
6
, 2022
Instrument
No. of
Contracts
Turnover
( in Cr. )
Change
(%)
Index
Futures
469835 38339.12 -18.79
Index
Options
78728011 6502025.42
5.87
Stock
Futures
887849 53508.15 -25.60
Stock
Options
3010675 196050.28 -19.90
Total
30,10,675 196050.28 4.38
Bull
-
Call Spreads
Action Strike Price Risk Reward BEP
Buy
15800 267.65
53.20 46.80 15853.20
Sell
15900 214.45
Buy
15800 267.65
97.95 102.05 15897.95
Sell
16000 169.70
Buy
15900 214.45
44.75 55.25 15944.75
Sell 16000 169.70
Bear
-
Put Spreads
Action Strike Price Risk Reward BEP
Buy
15800 227.65
40.70 59.30 15759.30
Sell
15700 186.95
Buy
15800 227.65
74.05 125.95 15725.95
Sell
15600 153.60
Buy
15700 186.95
33.35 66.65 15666.65
Sell
15600 153.60
Nifty Put
-
Call Analysis
,0
500,000
1000,000
1500,000
2000,000
2500,000
3000,000
3500,000
4000,000
15200 15300 15400 15500 15600 15700 15800 15900 16000 16100 16200 16300 16400 16500
Call Put

www.angelone.in
Technical & Derivatives Report
May 17
, 2022
`
Daily Pivot Levels for Nifty Constituents
Scrips
S2
S1
PIVOT
R1
R2
ADANIPORTS 691 702
715 726 739
APOLLOHOSP 3,494 3,591
3,649 3,745 3,804
ASIANPAINT 2,920 2,960
3,025 3,065 3,130
AXISBANK 620 630
639 649 659
BAJAJ-AUTO 3,622 3,669
3,697 3,744 3,772
BAJFINANCE 5,391 5,518
5,615 5,742 5,839
BAJAJFINSV 12,299 12,477
12,628 12,806 12,957
BPCL 331 333
336 339 342
BHARTIARTL 672 683
690 701 709
BRITANNIA 3,208 3,246
3,292 3,331 3,377
CIPLA 916 925
935 944 954
COALINDIA 166 169
171 174 176
DIVISLAB 4,146 4,182
4,246 4,282 4,346
DRREDDY 3,808 3,848
3,901 3,942 3,995
EICHERMOT 2,447 2,532
2,580 2,666 2,714
GRASIM 1,403 1,428
1,462 1,487 1,522
HCLTECH 1,024 1,034
1,051 1,061 1,077
HDFCBANK 1,274 1,290
1,301 1,316 1,328
HDFCLIFE 537 543
551 557 564
HDFC 2,110 2,141
2,162 2,193 2,214
HEROMOTOCO 2,411 2,453
2,483 2,525 2,555
HINDALCO 376 384
392 400 408
HINDUNILVR 2,154 2,186
2,204 2,235 2,253
ICICIBANK 668 676
683 691 698
INDUSINDBK 850 868
883 901 917
INFY 1,460 1,475
1,493 1,508 1,526
ITC 249 251
256 258 263
JSW STEEL 582 592
609 620 637
KOTAKBANK 1,742 1,778
1,801 1,837 1,860
LT 1,522 1,532
1,550 1,560 1,578
M&M 885 894
902 911 918
MARUTI 7,079 7,163
7,234 7,319 7,390
NESTLEIND 15,906 16,062
16,291 16,448 16,677
NTPC 139 144
146 151 154
ONGC 149 151
154 156 158
POWERGRID 230 233
235 238 240
RELIANCE 2,377 2,402
2,442 2,467 2,506
SBILIFE 1,024 1,035
1,044 1,054 1,064
SHREECEM 21,017 21,499
22,172 22,654 23,327
SBIN 429 442
452 465 474
SUNPHARMA 865 876
885 895 905
TCS 3,328 3,352
3,391 3,416 3,455
TATACONSUM
722 729
737 743 751
TATAMOTORS 389 397
405 413 420
TATASTEEL 1,070 1,087
1,111 1,128 1,152
TECHM 1,125 1,157
1,189 1,221 1,253
TITAN 2,064 2,087
2,119 2,142 2,175
ULTRACEMCO 5,636 5,824
6,010 6,198 6,383
UPL 763 783
795 814 826
WIPRO 460 464
469 473 478

www.angelone.in
Technical & Derivatives Report
May 17
, 2022
*
Technical and Derivatives Team:
Sameet Chavan
Chief Analyst
–
Technical & Derivatives
sameet.chavan@angelone.in
Sneha Seth Senior Analyst – Technical & Derivatives sneha.seth@angelone.in
Rajesh Bhosale Technical Analyst rajesh.bhosle@angelone.in
Osho Krishan Senior Analyst – Technical & Derivatives osho.krishan@angelone.in
Research Team Tel: 022 – 39357600 (Extn. 6844) Website: www.angelone.in
For Technical Queries E-mail: technicalresearch-cso@angelone.in
For Derivatives Queries E-mail: derivatives.desk@angelone.in
DISCLAIMER
Angel One Limited (hereinafter referred to as “Angel”) is a registered Member of National Stock Exchange of India Limited, Bombay
Stock Exchange Limited and Metropolitan Stock Exchange Limited. It is also registered as a Depository Participant with CDSL and
Portfolio Manager and investment advisor with SEBI. It also has registration with AMFI as a Mutual Fund Distributor. Angel One
Limited is a registered entity with SEBI for Research Analyst in terms of SEBI (Research Analyst) Regulations, 2014 vide registration
number INH000000164. Angel or its associates has not been debarred/ suspended by SEBI or any other regulatory authority for
accessing /dealing in securities Market.
This document is solely for the personal information of the recipient, and must not be singularly used as the basis of any investment
decision. Nothing in this document should be construed as investment or financial advice. Each recipient of this document should
make such investigations as they deem necessary to arrive at an independent evaluation of an investment in the securities of the
companies referred to in this document (including the merits and risks involved), and should consult their own advisors to determine
the merits and risks of such an investment.
Angel or its associates or research analyst or his relative may have actual/beneficial ownership of 1% or more in the securities of
the subject company at the end of the month immediately preceding the date of publication of the research report. Neither Angel or
its associates nor Research Analysts or his relative has any material conflict of interest at the time of publication of research report.
Angel or its associates might have received any compensation from the companies mentioned in the report during the period
preceding twelve months from the date of this report for services in respect of managing or co-managing public offerings, corporate
finance, investment banking or merchant banking, brokerage services or other advisory service in a merger or specific transaction
in the normal course of business. Angel or its associates did not receive any compensation or other benefits from the companies
mentioned in the report or third party in connection with the research report. Neither Angel nor its research analyst entity has been
engaged in market making activity for the subject company.
Reports based on technical and derivative analysis center on studying charts of a stock's price movement, outstanding positions and
trading volume, as opposed to focusing on a company's fundamentals and, as such, may not match with a report on a company's
fundamentals. Investors are advised to refer the Fundamental and Technical Research Reports available on our website to evaluate
the contrary view, if any.
The information in this document has been printed on the basis of publicly available information, internal data and other reliable
sources believed to be true, but we do not represent that it is accurate or complete and it should not be relied on as such, as this
document is for general guidance only. Angel One Limited or any of its affiliates/ group companies shall not be in any way responsible
for any loss or damage that may arise to any person from any inadvertent error in the information contained in this report. Angel One
Limited has not independently verified all the information contained within this document. Accordingly, we cannot testify, nor make
any representation or warranty, express or implied, to the accuracy, contents or data contained within this document. While Angel
One Limited endeavors to update on a reasonable basis the information discussed in this material, there may be regulatory,
compliance, or other reasons that prevent us from doing so.
This document is being supplied to you solely for your information, and its contents, information or data may not be reproduced,
redistributed or passed on, directly or indirectly.
Neither Angel One Limited, nor its directors, employees or affiliates shall be liable for any loss or damage that may arise from or in
connection with the use of this information. Angel or its associates or Research Analyst or his relative might have financial interest
in the subject company. Research analyst has not served as an officer, director or employee of the subject company.
