March 17, 2023
www.angelone.in
Technical & Derivatives Report
Nifty Bank
Outlook (
39
133
)
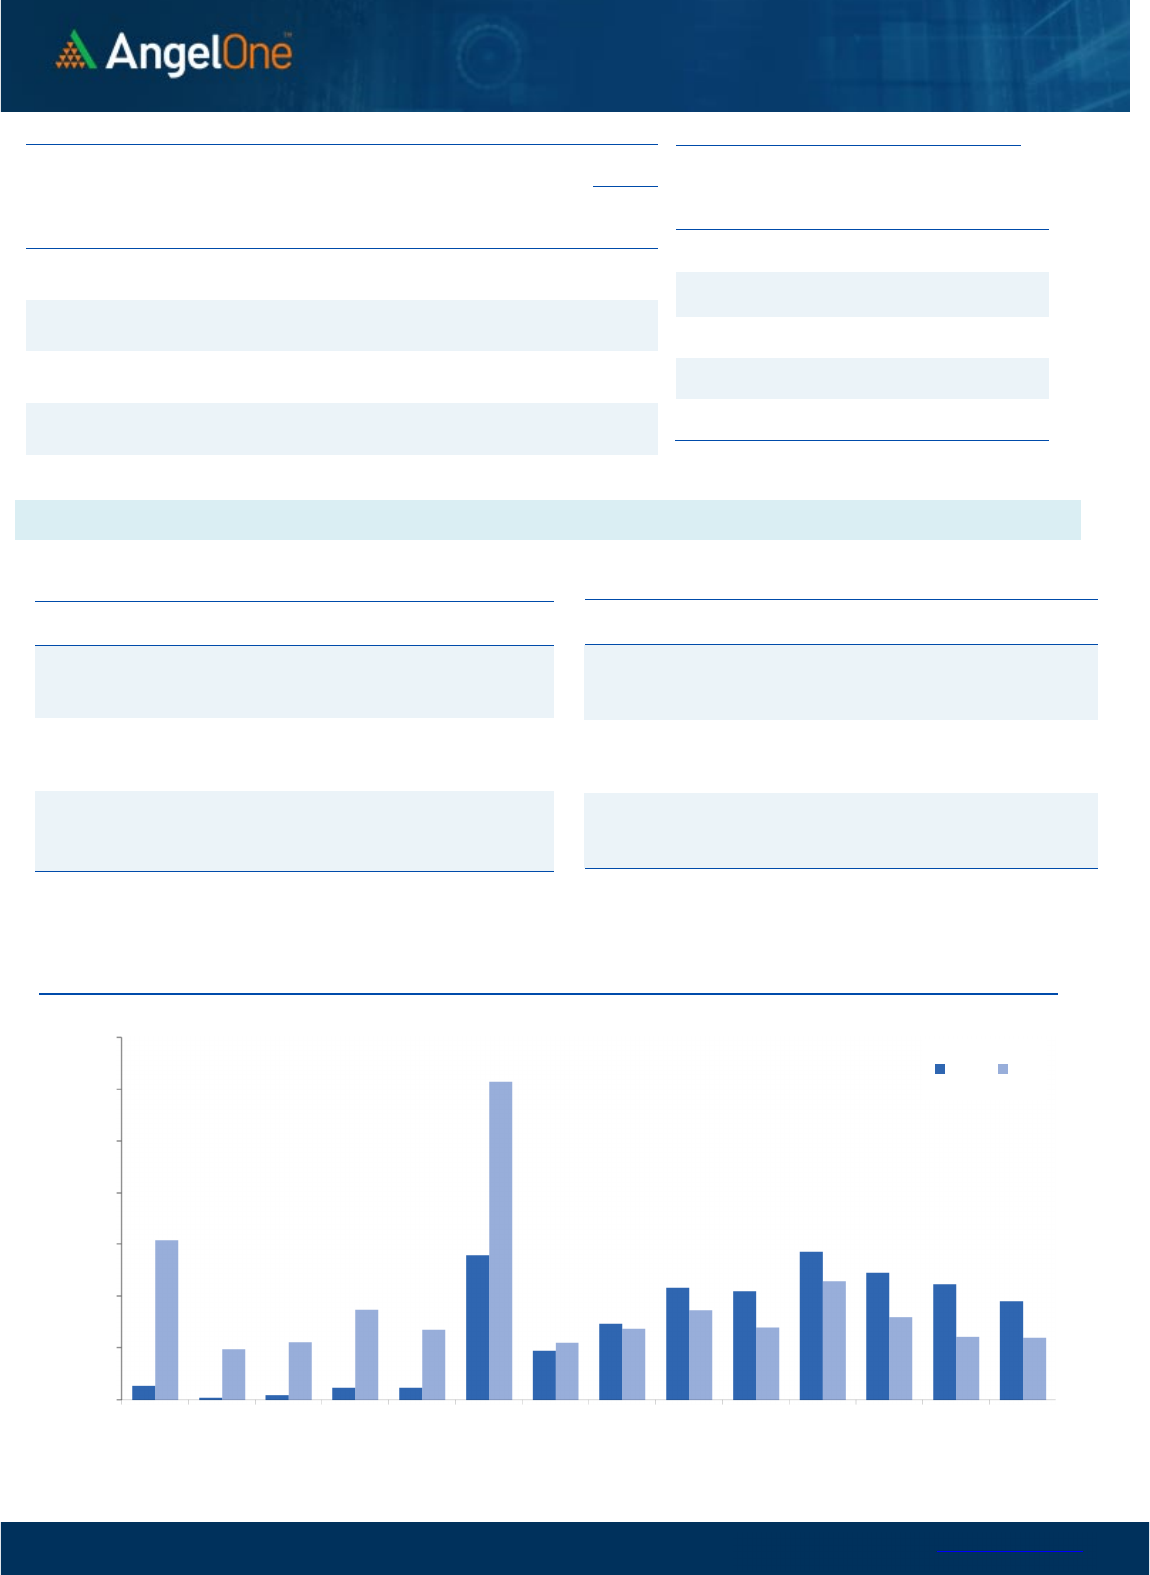
The Bank Nifty had a subdued beginning on the day of the weekly
expiry, and the recent unease in the market caused prices to dip to
38613 during the day. However, there was a sharp rebound that
helped to recoup the early losses, and prices remained in a range
for the rest of the day, ultimately closing with a 0.21% gain at
39133.
This marks an end to the five consecutive days of losses. There is
now positive divergence, with prices hitting a new low, but RSI not
following suit. Additionally, the "Long Legged Doji" candlestick
pattern seen yesterday suggests that bulls are showing some
resilience at lower levels. However, the market is not yet
completely stable, and prices must continue to sustain above
yesterday's high of 39400 in the coming sessions, and close above
39950 to confirm a higher top on the hourly charts. Conversely, the
low seen yesterday around 38600 - 38500 is a critical level to
watch. Traders are advised to monitor these levels closely and take
things one step at a time.
Key Levels
Support 1 – 38600 Resistance 1 – 39400
Support 2 – 38500 Resistance 2 – 39900
Exhibit 1: Nifty Daily Chart
Exhibit 2: Nifty Bank Daily Chart
Sensex (
5
7
635
) / Nifty (
169
86
)
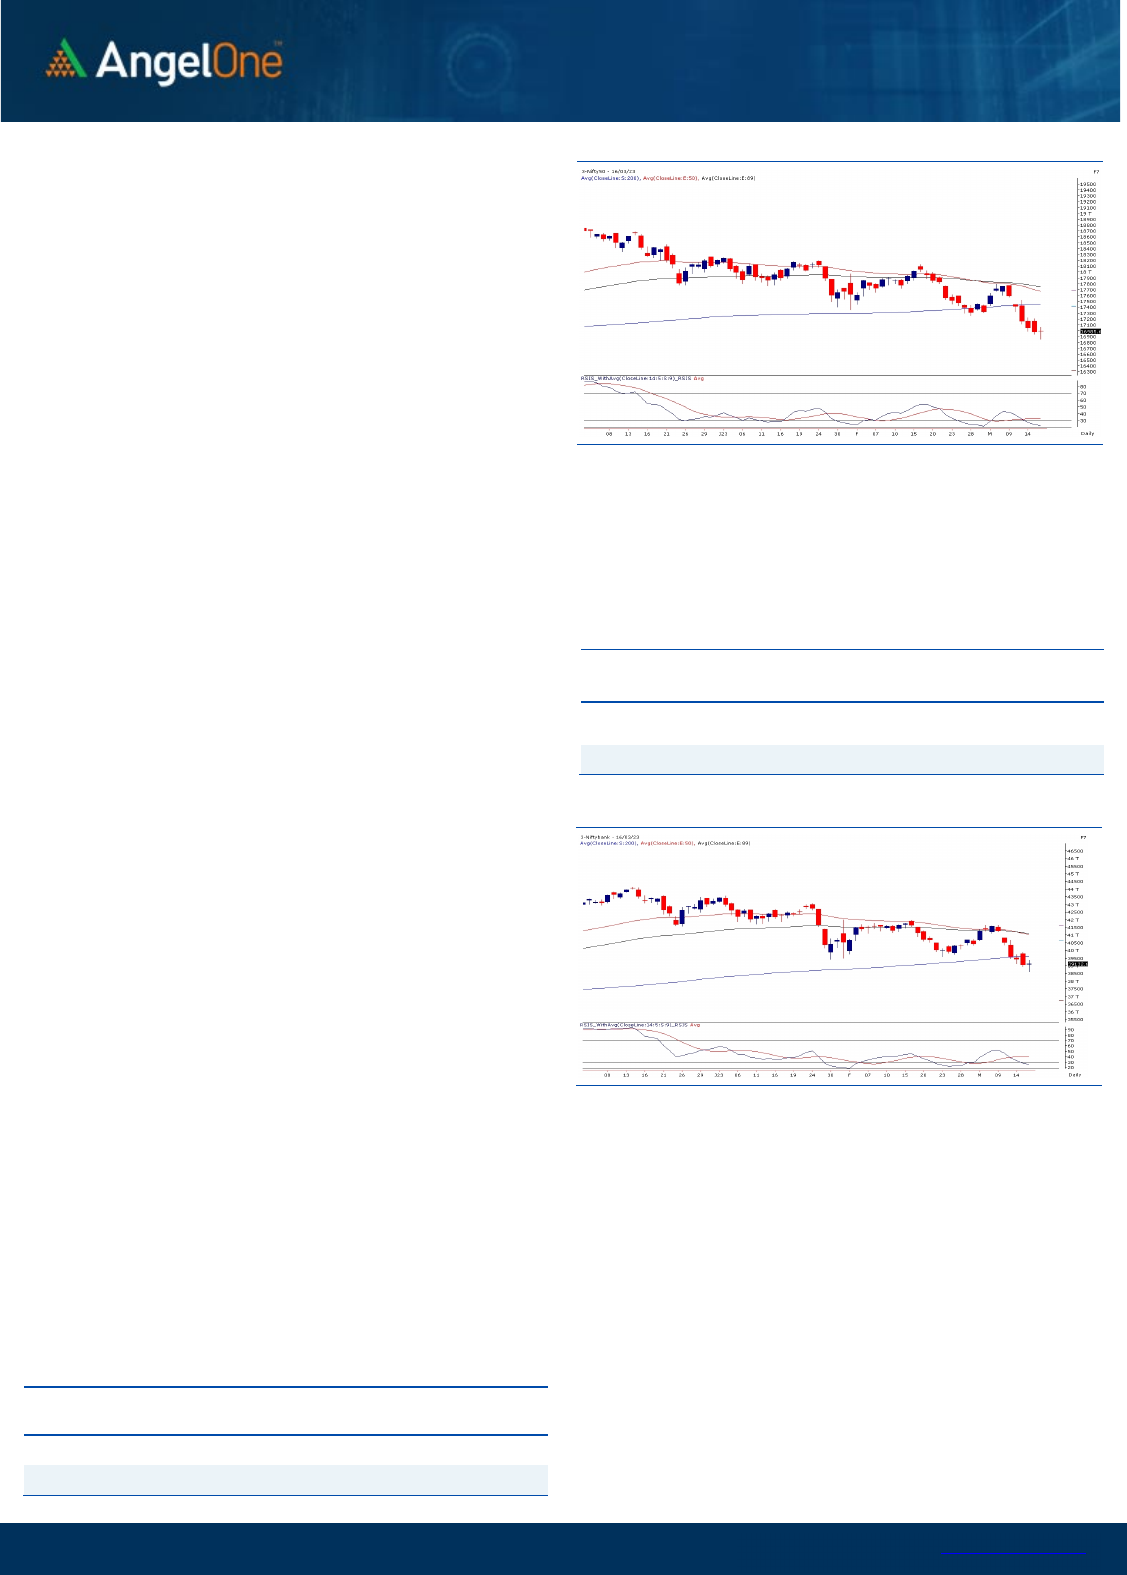
The Indian equity market had a volatile day of trade, wherein the
benchmark index Nifty50 started on a bleak note and slipped to the
low of 16850. But soon after, some resurgence was seen at the
lower grounds, which led to a modest recovery and the index
snapped its losing streak. Amidst the intense tug of war, the Nifty50
index concluded the weekly expiry session on a subdued note, with
mere gains of 0.08 percent and settled a tad below the 17000 mark.
Technically speaking, there is no significant change in the view as
the index is placed near the previous day’s close. However, with the
formation of a ‘long-legged Doji’ on the daily chart, one may
interpret a halt from the ongoing sell-off, which is an encouraging
sign for the market participants. As far as levels are concerned,
16900-16850 is expected to act as the sacrosanct support in the
near period. On the higher end, 17200-17250 is likely to act as an
immediate hurdle, followed by the sturdy wall of 200 SMA, placed
around 17400-17450 in a comparable period.
As we advance, one needs to keep close track of the strongly
beaten-up heavyweight counters, as they could witness some
recovery from hereon. Besides this, global development should
also be tracked closely, as any favorable cues could boost market
sentiments. Also, we would advocate traders to avoid aggressive
bets for the time being and focus on stock-specific actions.
Key Levels
Support 1 – 16900 Resistance 1 – 17150
Support 2 – 16850 Resistance 2 – 17200

www.angelone.in
Technical & Derivatives Report
March 17, 2023
View
Post slightly positive start, we saw some follow-up
selling to drag index towards 16850. However, in the
next hour itself it recouped all the losses and head
towards 17050. After some tug of war, we managed
to conclude the weekly expiry session with marginal
gains.
FIIs were net sellers in the cash market segment to
the tune of Rs. 282 crores. Simultaneously, in Index
futures, they sold worth Rs. 1814 crores with good
amount of rise in open interest, indicating addition
of short positions.
Though our market has been volatile in last couple of
sessions, no relevant build-up was witnessed in key
indices. On the options front, we are witnessing pile
up of positions in 17000 strike of both call and put
options which is quite rare. Meanwhile, the stronger
hands continue their selling streak not only in
equities but also in index futures recently. The ‘Long
Short Ratio’ has declined further to 11% from 16%
seen on Friday. At this point in time, we believe
market is extremely oversold and yesterday’s low
should be acting as a strong support zone, whereas
any sustainable move beyond 17200 shall be an
encouraging sign.
Comments
The Nifty futures open interest has increased by 1.82%
and Bank Nifty futures open interest has increased by
0.60% as the market closed at 16985.60.
The Nifty March future closed with a premium of 61.70
point against a premium of 65.20 point in the last
trading session. The April series closed at a premium of
157.95 point.
The INDIA VIX has decreased from 16.29 to 16.21. At
the same time, the PCR-OI of Nifty has increased from
0.67 to 0.75.
Few of the liquid counters where we have seen high
cost of carry are AMBUJACEM, HONAUT,
AUROPHARMA, INDIACEM and ACC.
Historical Volatility
SCRIP HV
MOTHERSON 47.63
BPCL 32.37
ICICIPRULI 37.96
ZEEL 54.56
HINDPETRO 39.24
Nifty Vs OI
16600
16800
17000
17200
17400
17600
17800
18000
,0
2,000
4,000
6,000
8,000
10,000
12,000
14,000
16,000
18,000
2/22 2/24 2/28 3/2 3/6 3/9 3/13 3/15
Openinterest Nifty
OI Gainers
SCRIP OI
OI
CHG. (%)
PRICE
PRICE
CHG. (%)
SBILIFE 6979500 12.68 1062.65 -0.32
BAJAJ-AUTO 1148750 11.15 3800.20 1.76
CUB 14835000 9.69 130.10 -1.65
VEDL 42834000 9.42 275.05 -1.62
HINDALCO 29017800 8.83 384.95 -4.90
BPCL 15364800 8.11 350.90 5.97
MOTHERSON 67189500 7.95 68.50 -10.68
RBLBANK 36580000 7.87 141.45 -0.25
OI Losers
SCRIP OI
OI
CHG. (%)
PRICE
PRICE
CHG. (%)
SBILIFE 17600 12.68 1062.65 -0.32
BAJAJ-AUTO 1148750 11.15 3800.20 1.76
CUB 14835000 9.69 130.10 -1.65
VEDL 42834000 9.42 275.05 -1.62
HINDALCO 29017800 8.83 384.95 -4.90
BPCL 15364800 8.11 350.90 5.97
MOTHERSON 67189500 7.95 68.50 -10.68
RBLBANK 36580000 7.87 141.45 -0.25
Put-Call Ratio
SCRIP PCR (OI) PCR (VOL)
NIFTY 0.75 0.95
BANKNIFTY 0.78 0.89
RELIANCE 0.46 0.49
ICICIBANK 0.57 0.61
INFY 0.40 0.49
www.angelone.in
Technical & Derivatives Report
March 17, 2023
Note: Above mentioned Bullish or Bearish Spreads in Nifty (March Series) are given as an information and not as a recommendation.
Nifty Spot =
1
69
85.60
0900
Lot Size = 75
FII Statistics for
March
1
6
, 202
3
Detail Buy
Contracts
Open
Interest
Value
(in Cr.)
Sell
Net
CHANGE
INDEX
FUTURES
4443.77
6258.45
(1814.68) 211120
18719.93
11.97
INDEX
OPTIONS
3606663.38
3586329.42
20333.96
2490384
219399.21
(19.37)
STOCK
FUTURES
12249.61
13668.35
(1418.74) 2236871
144338.10
1.01
STOCK
OPTIONS
13723.07
13480.21
242.86
179329
11589.27
2.96
Total 3637079.83
3619736.43
17343.40
5117704
394046.51
(9.68)
Turnover
on
March
1
6
, 202
3
Instrument
No. of
Contracts
Turnover
( in Cr. )
Change
(%)
Index Futures
547675 50417.65
26.78
Index Options
478361327
85573.13
33.61
Stock Futures
843395 54326.95
18.51
Stock Options
3239193 2967.19 -7.38
Total
3,239,193 2967.19 26.45
Bull-Call Spreads
Action Strike Price Risk Reward BEP
Buy
17000 230.95
55.20
44.80
17055.20
Sell
17100 175.75
Buy
17000 230.95
103.90
96.10
17103.90
Sell
17200 127.05
Buy
17100 175.75
48.70 51.30 17148.70
Sell
17200 127.05
Bear-Put Spreads
Action Strike Price Risk Reward BEP
Buy
17000 190.30
37.45
62.55
16962.55
Sell 16900 152.85
Buy 17000 190.30
68.45
131.55
16931.55
Sell
16800 121.85
Buy
16900 152.85
31.00 69.00 16869.00
Sell 16800 121.85
Nifty Put-Call Analysis
,0
1000,000
2000,000
3000,000
4000,000
5000,000
6000,000
7000,000
16500 16600 16700 16800 16900 17000 17100 17200 17300 17400 17500 17600 17700 17800
Call Put

www.angelone.in
Technical & Derivatives Report
March 17, 2023
`
Daily
Pivot Levels for Nifty Constituents
Scrips
S2
S1
PIVOT
R1
R2
ADANIENT
1,758
1,801
1,838
1,881
1,918
ADANIPORTS 665 672
682
690
700
APOLLOHOSP
4,214
4,267
4,318
4,371
4,422
ASIANPAINT
2,803
2,848
2,874
2,919
2,945
AXISBANK 804 817
828
841
851
BAJAJ-AUTO
3,714
3,757
3,784
3,827
3,854
BAJFINANCE
5,622
5,668
5,712
5,758
5,802
BAJAJFINSV
1,256
1,275
1,289
1,308
1,323
BPCL 327 339
346
358
365
BHARTIARTL 734 740
749
755
765
BRITANNIA
4,224
4,267
4,294
4,337
4,364
CIPLA 870 877
883
890
897
COALINDIA 214 217
220
223
226
DIVISLAB
2,725
2,763
2,806
2,844
2,887
DRREDDY
4,335
4,359
4,395
4,419
4,454
EICHERMOT
2,952
2,994
3,037
3,079
3,122
GRASIM
1,512
1,536
1,551
1,576
1,591
HCLTECH
1,059
1,066
1,077
1,083
1,094
HDFCBANK
1,521
1,536
1,548
1,563
1,575
HDFCLIFE
452
456
463
468
474
HDFC
2,481
2,506
2,527
2,552
2,573
HEROMOTOCO
2,348
2,359
2,377
2,388
2,406
HINDALCO 372 378
390
396
407
HINDUNILVR
2,384
2,422
2,445
2,483
2,507
ICICIBANK 801 812
822
833
843
INDUSINDBK 981 999
1,021
1,039
1,061
INFY
1,388
1,396
1,407
1,415
1,426
ITC 375 378
380
384
386
JSW STEEL 636 649
662
676
689
KOTAKBANK
1,633
1,648
1,664
1,679
1,694
LT
2,109
2,141
2,164
2,196
2,219
M&M
1,126
1,146
1,161
1,181
1,196
MARUTI
8,338
8,388
8,461
8,510
8,583
NESTLEIND
17,774
18,112
18,306
18,645
18,838
NTPC 176 178
179
181
182
ONGC 146 149
151
154
157
POWERGRID 227 229
231
234
236
RELIANCE
2,176
2,201
2,227
2,253
2,279
SBILIFE
1,035
1,049
1,069
1,083
1,103
SBIN 508 516
523
531
538
SUNPHARMA 945 956
963
974
981
TCS
3,144
3,165
3,192
3,213
3,240
TATACONSUM
686 690
693
697
701
TATAMOTORS 400 408
413
421
427
TATASTEEL 102 103
105
107
109
TECHM
1,092
1,105
1,114
1,127
1,135
TITAN
2,379
2,415
2,448
2,484
2,517
ULTRACEMCO
7,036
7,071
7,110
7,144
7,184
UPL 684 690
698
704
712
WIPRO 366 370
373
376
380

www.angelone.in
Technical & Derivatives Report
March 17, 2023
*
Technical and Derivatives Team:
Sameet Chavan Chief Analyst – Technical & Derivatives sameet.chavan@angelone.in
Sneha Seth Senior Analyst – Technical & Derivatives sneha.seth@angelone.in
Rajesh Bhosale Technical Analyst rajesh.bhosle@angelone.in
Osho Krishan Senior Analyst – Technical & Derivatives osho.krishan@angelone.in
Research Team Tel: 022 – 39357600 Website: www.angelone.in
For Technical Queries E-mail: technicalresearch-cso@angelone.in
For Derivatives Queries E-mail: derivatives.desk@angelone.in
DISCLAIMER
Angel One Limited (hereinafter referred to as “Angel”) is a registered Member of National Stock Exchange of India Limited, Bombay Stock Exchange
Limited and Metropolitan Stock Exchange Limited. It is also registered as a Depository Participant with CDSL and Portfolio Manager and investment
advisor with SEBI. It also has registration with AMFI as a Mutual Fund Distributor. Angel One Limited is a registered entity with SEBI for Research
Analyst in terms of SEBI (Research Analyst) Regulations, 2014 vide registration number INH000000164. Angel or its associates has not been
debarred/ suspended by SEBI or any other regulatory authority for accessing /dealing in securities Market.
This document is solely for the personal information of the recipient, and must not be singularly used as the basis of any investment decision.
Nothing in this document should be construed as investment or financial advice. Each recipient of this document should make such investigations
as they deem necessary to arrive at an independent evaluation of an investment in the securities of the companies referred to in this document
(including the merits and risks involved), and should consult their own advisors to determine the merits and risks of such an investment.
Angel or its associates or research analyst or his relative may have actual/beneficial ownership of 1% or more in the securities of the subject
company at the end of the month immediately preceding the date of publication of the research report. Neither Angel or its associates nor
Research Analysts or his relative has any material conflict of interest at the time of publication of research report.
Angel or its associates might have received any compensation from the companies mentioned in the report during the period preceding twelve
months from the date of this report for services in respect of managing or co-managing public offerings, corporate finance, investment banking or
merchant banking, brokerage services or other advisory service in a merger or specific transaction in the normal course of business. Angel or its
associates did not receive any compensation or other benefits from the companies mentioned in the report or third party in connection with the
research report. Neither Angel nor its research analyst entity has been engaged in market making activity for the subject company.
Reports based on technical and derivative analysis center on studying charts of a stock's price movement, outstanding positions and trading
volume, as opposed to focusing on a company's fundamentals and, as such, may not match with a report on a company's fundamentals. Investors
are advised to refer the Fundamental and Technical Research Reports available on our website to evaluate the contrary view, if any.
The information in this document has been printed on the basis of publicly available information, internal data and other reliable sources believed
to be true, but we do not represent that it is accurate or complete and it should not be relied on as such, as this document is for general guidance
only. Angel One Limited or any of its affiliates/ group companies shall not be in any way responsible for any loss or damage that may arise to any
person from any inadvertent error in the information contained in this report. Angel One Limited has not independently verified all the information
contained within this document. Accordingly, we cannot testify, nor make any representation or warranty, express or implied, to the accuracy,
contents or data contained within this document. While Angel One Limited endeavors to update on a reasonable basis the information discussed
in this material, there may be regulatory, compliance, or other reasons that prevent us from doing so.
This document is being supplied to you solely for your information, and its contents, information or data may not be reproduced, redistributed or
passed on, directly or indirectly.
Neither Angel One Limited, nor its directors, employees or affiliates shall be liable for any loss or damage that may arise from or in connection
with the use of this information. Angel or its associates or Research Analyst or his relative might have financial interest in the subject company.
Research analyst has not served as an officer, director or employee of the subject company.
