DEC 16, 2022
www.angelone.in
Technical & Derivatives Report
xOOOOOOOO
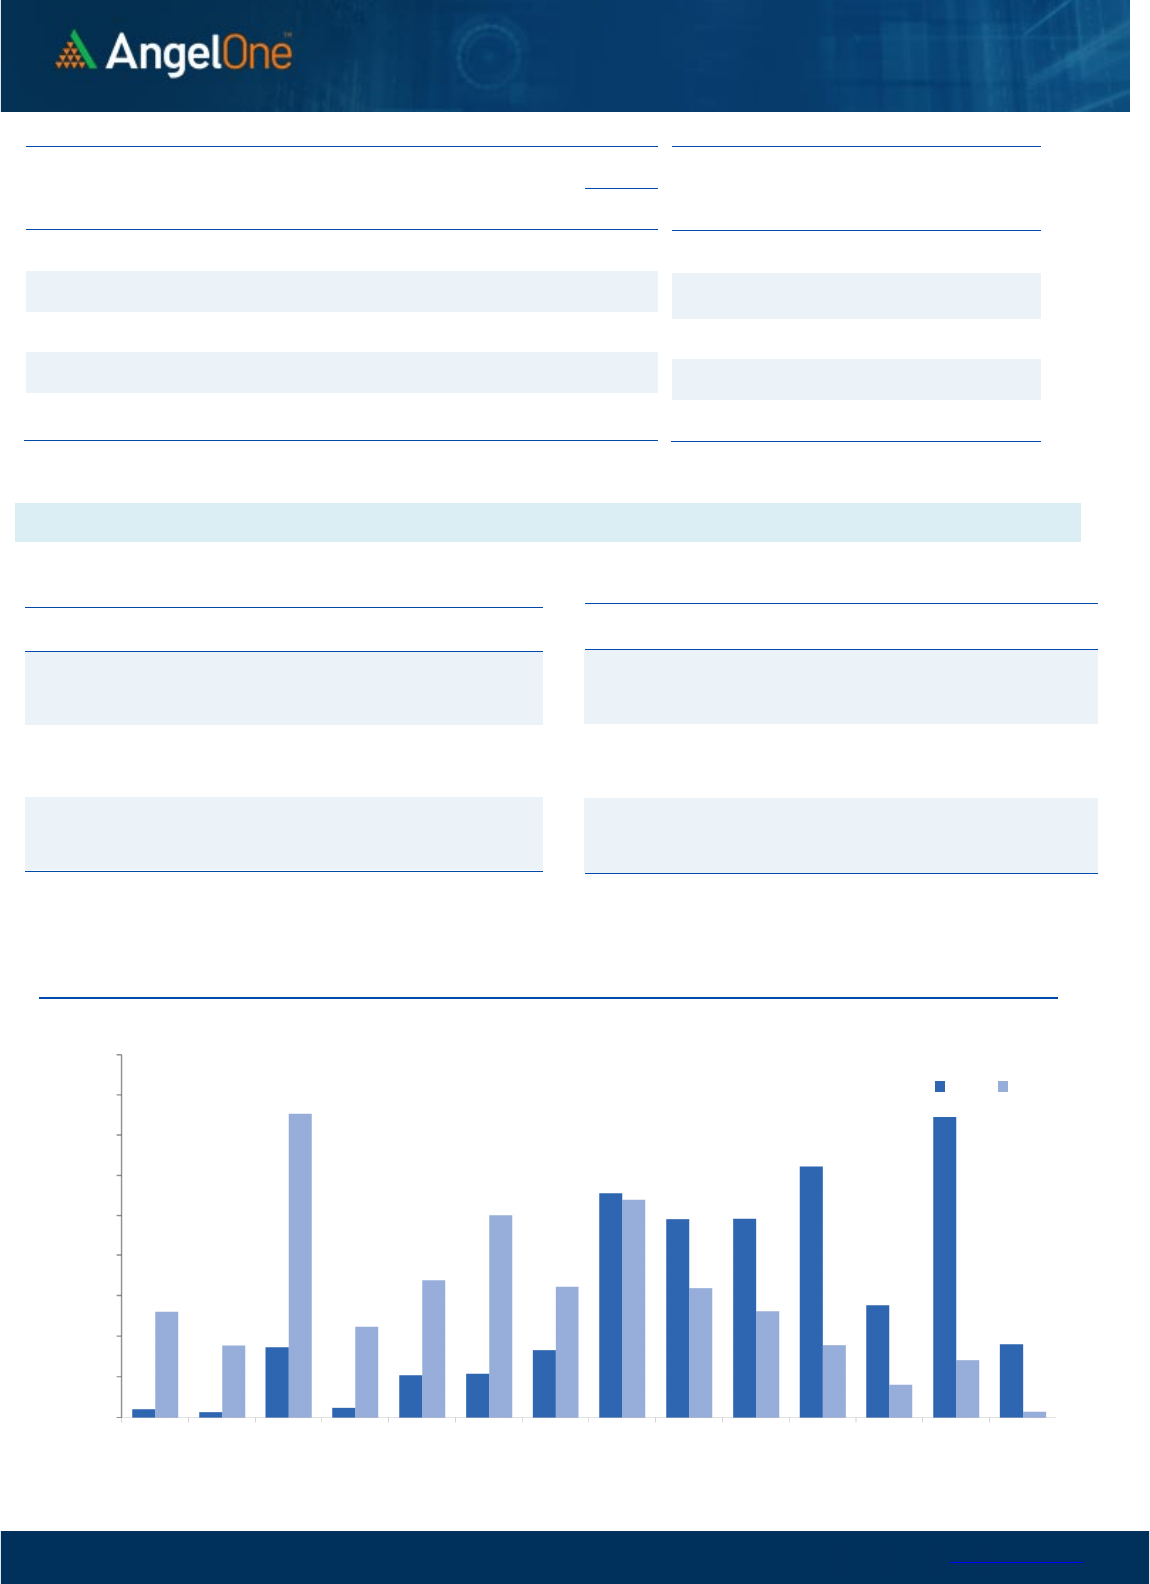
Nifty Bank Outlook (43498)
On the weekly expiry, Bank Nifty started on a weak note, and post
a modest recovery in the first hour there was sustained selling
pressure throughout the day. Bank Nifty eventually ended with a
loss of 1.25% tad below 43500.
Even though, the bank index was making fresh new highs; the
momentum was missing for the last few days as we were
witnessing small body candles indicating fatigue in the bulls' camp.
Yesterday, eventually a price-wise correction was triggered that
should be considered a breather for the bulls after the recent
relentless run. Technically, if we see we are witnessing a small
trend line breakdown on the daily chart and if the selling persists
in the coming session, then we can expect this correction to get
extended in the near term. The next key support in such
a scenario would be the 20ema placed around the 43100 levels. On
the flip side, 44000 - 44200 may act as sturdy resistance in case of
an immediate bounce back. Traders should understand that the
undertone remains bullish and in case of any price-wise correction
it should be considered as a buying opportunity to buy quality
propositions in a staggered manner.
Key Levels
Support 1 – 43100 Resistance 1 – 44000
Support 2 – 43000 Resistance 2 – 44200
Exhibit 1: Nifty
Daily
Chart
Exhibit 2: Nifty Bank
Daily
Chart
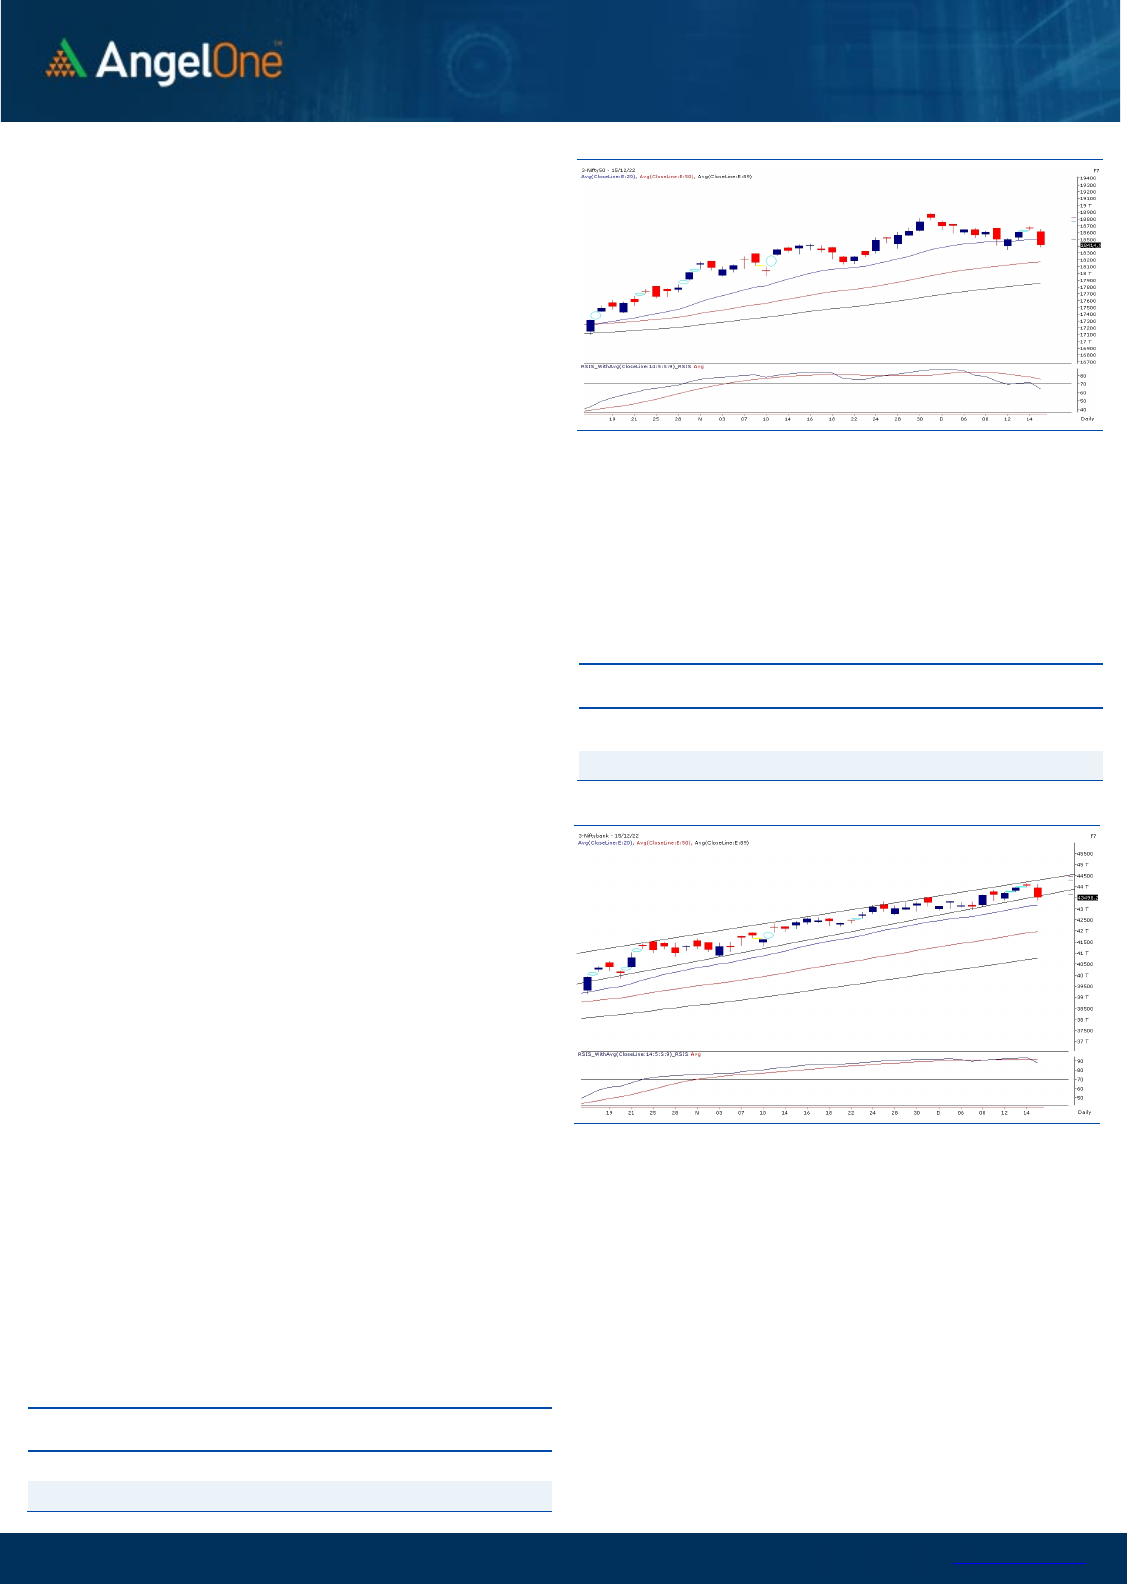
Sensex (61799) / Nifty (18415)
US markets wobbled a bit after the Fed policy on Wednesday. The
kind of reaction we witnessed overnight, it appeared as if global
markets have digested this development and no major damage was
done. However, yesterday morning, markets across the globe
started feeling some pressure, which augmented as the day
progressed. Hence, the initial gradual decline in our bourses
became the considerable correction at the close. Nifty shed more
than 1.30% to close convincingly below the 18450 mark.
With yesterday’s sharp decline, not only sentiments but recent
chart structure has also been dented now. Since last few months,
we did not have any discomfort in all in-between corrections; but
the kind of price action we witnessed yesterday, does not augur well
for the bulls. The coming session would be quite crucial for our
market in order to maintain the recent optimism intact. We are not
far away from the key swing low of 18350. If we extend the
correction and sustains below it, we may see at least 300 – 400
points in the following sessions. The next levels to watch out for
would be 18230 – 18100 levels. Hopefully, this doesn’t happen
because it will apply immediate brakes on recent positive trend.
On the flipside, it would be crucial to reclaim 18500 – 18600 in
coming couple of sessions. Once we surpass this crucial zone,
yesterday’s down move then can be construed as a running
correction and market then resumes its upwards trajectory. Let’s
see how things pan out. It would also be important to keep a
close eye on global developments, which are likely to dictate the
near term direction.
Key Levels
Support 1 – 18350 Resistance 1 – 18500
Support 2 – 18230 Resistance 2 – 18600

www.angelone.in
Technical & Derivatives Report
DEC 16, 2022
View
Our market tumbled over the weak global cues,
wherein the benchmark index Nifty50 witnessed a
one-sided sell-off and shed over 1.30 percent on the
weekly expiry session, settling a tad above 18400 level.
FIIs were net sellers in the cash market segment to
the tune of Rs. 711 crores. Simultaneously, in Index
futures, they sold worth Rs. 1935 crores with a minor
rise in open interest, indicating a short buildup.
Looking at the F&O data, we witnessed short
addition in Nifty and long unwinding in Bank Nifty.
On the options front, the piling up of OI is seen at
18400 put strike, followed by 18200 PE. On the flip
side, the maximum OI concentration is seen at the
18600-call strike, signifying a stiff resistance for the
Nifty. Meanwhile, the stronger hands have covered
their longs and added a few in the short side,
contracting the ‘Long Short Ratio’ to 54% from 59%.
Considering the recent price action, we would
advocate to avoid undue risk and also to stay
abreast with global developments in the near
period.
Comments
The Nifty futures open interest has increased by
4.20% and Bank Nifty futures open interest has
decreased by 6.64% as the market closed at 18414.90.
The Nifty December future closed with a premium of
52.10 point against a premium of 88.60 point in the
last trading session. The January series closed at a
premium of 167 point.
The INDIA VIX increased from 12.88 to 13.73. At the
same time, the PCR-OI of Nifty has decreased from
1.02 to 0.76.
Few of the liquid counters where we have seen high
cost of carry are IRCTC, TECHM, AMBUJACEM,
PAGEIND and BATAINDIA.
Historical Volatility
SCRIP HV
IDEA 72.97
IBULHSGFIN 69.25
RBLBANK 67.73
GNFC 58.45
HINDCOPPER 58.18
Nifty Vs OI
17800
18000
18200
18400
18600
18800
19000
8,000
9,000
10,000
11,000
12,000
13,000
14,000
15,000
16,000
11/28 11/30 12/2 12/6 12/9 12/13 12/15
Openinterest Nifty
OI Gainers
SCRIP OI
OI
CHG. (%)
PRICE
PRICE
CHG. (%)
IRCTC 21677250 25.09 689.05 -6.25
METROPOLIS 1723200 24.40 1322.05 -3.78
SRF 4648125 13.75 2400.65 -0.17
TECHM 13842000 13.48 1022.75 -3.88
AARTIIND 3806300 10.24 640.00 -3.23
INDIAMART 310350 8.38 4351.25 -1.79
CANBK 47744100 8.36 320.50 -2.46
TITAN 6816750 6.13 2522.70 -2.81
OI Losers
SCRIP OI
OI
CHG. (%)
PRICE
PRICE
CHG. (%)
CHAMBLFERT 8997000 -7.71 314.05 0.08
POLYCAB 1034700 -7.04 2981.45 -0.67
IBULHSGFIN 49204000 -6.71 149.80 2.88
ONGC 33895400 -6.69 147.45 -0.27
BHARATFORG 6388000 -6.49 899.25 -1.34
RAMCOCEM 3536850 -6.39 721.75 -0.65
VOLTAS 6234500 -5.71 850.40 -0.43
ABBOTINDIA 44160 -5.64 20571.60 -0.10
Put-Call Ratio
SCRIP PCR (OI) PCR (VOL)
NIFTY 0.76 0.99
BANKNIFTY 0.75 1.01
RELIANCE 0.42 0.43
ICICIBANK 0.46 0.67
INFY 0.40 0.52
www.angelone.in
Technical & Derivatives Report
DEC 16, 2022
Note: Above mentioned Bullish or Bearish Spreads in Nifty (Dec Series) are given as an information and not as a recommendation.
Nifty Spot =
1
8
414
.
9
0
FII Statistics for
December
1
5
, 2022
Detail Buy
Contracts
Open
Interest
Value
(in Cr.)
Sell
Net
CHANGE
INDEX
FUTURES
2644.80 4579.43 (1934.63) 174403 17017.51 0.27
INDEX
OPTIONS
2242286.89 2235169.17 7117.72
1431237 137386.17 (32.28)
STOCK
FUTURES
8165.27 10135.53 (1970.26) 1960584 135526.04 0.28
STOCK
OPTIONS
10336.19 10355.78 (19.59) 166286 11769.97 5.24
Total 2263433.15
2260239.91
3193.24
3732510
301699.69
(15.18)
Turnover on
December
1
5
, 2022
Instrument
No. of
Contracts
Turnover
( in Cr. )
Change
(%)
Index
Futures
308677 3085072.74
37.29
Index
Options
314059646 4531168.56
49.64
Stock
Futures
677913 4886740.24
-0.80
Stock
Options
3102676 316664.93
-12.65
Total
31,02,676 316664.93
21.35
Bull-Call Spreads
Action Strike Price Risk Reward BEP
Buy
18400 209.25
55.70
44.30
18455.70
Sell
18500 153.55
Buy
18400 209.25
103.25
96.75
18503.25
Sell
18600 106.00
Buy
18500 153.55
47.55 52.45 18547.55
Sell 18600 106.00
Bear
-
Put Spreads
Action Strike Price Risk Reward BEP
Buy 18400 142.55
35.25
64.75
18364.75
Sell
18300 107.30
Buy 18400 142.55
60.30
139.70
18339.70
Sell 18200 82.25
Buy
18300 107.30
25.05 74.95 18274.95
Sell 18200 82.25
Nifty Put
-
Call Analysis
,0
500,000
1000,000
1500,000
2000,000
2500,000
3000,000
3500,000
4000,000
4500,000
17800 17900 18000 18100 18200 18300 18400 18500 18600 18700 18800 18900 19000 19100
Call Put

www.angelone.in
Technical & Derivatives Report
DEC 16, 2022
`
Daily Pivot Levels for Nifty Constituents
Scrips
S2
S1
PIVOT
R1 R2
ADANIENT
3,999
4,021
4,047
4,070
4,095
ADANIPORTS
864
874
890
900
917
APOLLOHOSP 4,593 4,618
4,652
4,677
4,711
ASIANPAINT 3,092 3,111
3,136
3,156
3,181
AXISBANK 926 932
939
945
951
BAJAJ-AUTO 3,582 3,601
3,628 3,647 3,674
BAJFINANCE 6,538 6,582
6,648
6,692
6,758
BAJAJFINSV 1,581 1,593
1,612 1,624
1,644
BPCL
343
346
349
352
354
BHARTIARTL 821 823
827
830
834
BRITANNIA
4,381
4,423
4,454
4,496 4,527
CIPLA
1,088
1,095
1,106
1,113
1,125
COALINDIA
225
226
230
231
234
DIVISLAB
3,314
3,340
3,377
3,402 3,439
DRREDDY
4,419
4,444
4,486
4,511
4,552
EICHERMOT 3,242 3,273
3,327
3,358
3,413
GRASIM
1,749
1,768
1,797
1,815
1,844
HCLTECH
1,029
1,036
1,044
1,050
1,058
HDFCBANK
1,600
1,616
1,643
1,658
1,685
HDFCLIFE
570
575
581 586
592
HDFC
2,625
2,649
2,691
2,714
2,756
HEROMOTOCO
2,714
2,742
2,763
2,792
2,812
HINDALCO
452
456
464
468
475
HINDUNILVR 2,630 2,647
2,665
2,682 2,700
ICICIBANK
896
903
911
917
926
INDUSINDBK
1,211
1,225
1,249
1,264
1,288
INFY 1,514 1,527
1,549
1,562
1,583
ITC
333
336
341 344
349
JSW STEEL 727 735
749
757
771
KOTAKBANK
1,840
1,851
1,867
1,878
1,894
LT 2,151 2,164
2,187
2,200
2,222
M&M
1,276
1,281
1,287
1,293
1,299
MARUTI
8,512
8,548
8,611
8,647
8,710
NESTLEIND
19,325
19,532
19,841
20,047
20,356
NTPC
170
171
173
174
175
ONGC 145 146
148 149 150
POWERGRID
213
215
218
219
222
RELIANCE 2,544 2,561
2,588 2,605
2,632
SBILIFE
1,253
1,263
1,279
1,289
1,305
SBIN
605
610
620
626
635
SUNPHARMA
994
998
1,002
1,007
1,011
TCS
3,257
3,281
3,323
3,347 3,389
TATACONSUM
794
799
807
813 821
TATAMOTORS
411
414
418 421
426
TATASTEEL
109
110
112
113
114
TECHM
995
1,009
1,034
1,048
1,074
TITAN 2,468 2,495
2,542
2,569
2,616
ULTRACEMCO
7,010
7,062
7,140
7,192
7,269
UPL 752 761
775
784
798
WIPRO
391
393
396
399
402

www.angelone.in
Technical & Derivatives Report
DEC 16, 2022
*
Technical and Derivatives Team:
Sameet Chavan Chief Analyst – Technical & Derivatives sameet.chavan@angelone.in
Sneha Seth Senior Analyst – Technical & Derivatives sneha.seth@angelone.in
Rajesh Bhosale Technical Analyst rajesh.bhosle@angelone.in
Osho Krishan Senior Analyst – Technical & Derivatives osho.krishan@angelone.in
Research Team Tel: 022 – 39357600 Website: www.angelone.in
For Technical Queries E-mail: technicalresearch-cso@angelone.in
For Derivatives Queries E-mail: derivatives.desk@angelone.in
DISCLAIMER
Angel One Limited (hereinafter referred to as “Angel”) is a registered Member of National Stock Exchange of India Limited, Bombay
Stock Exchange Limited and Metropolitan Stock Exchange Limited. It is also registered as a Depository Participant with CDSL and
Portfolio Manager and investment advisor with SEBI. It also has registration with AMFI as a Mutual Fund Distributor. Angel One
Limited is a registered entity with SEBI for Research Analyst in terms of SEBI (Research Analyst) Regulations, 2014 vide registration
number INH000000164. Angel or its associates has not been debarred/ suspended by SEBI or any other regulatory authority for
accessing /dealing in securities Market.
This document is solely for the personal information of the recipient, and must not be singularly used as the basis of any investment
decision. Nothing in this document should be construed as investment or financial advice. Each recipient of this document should
make such investigations as they deem necessary to arrive at an independent evaluation of an investment in the securities of the
companies referred to in this document (including the merits and risks involved), and should consult their own advisors to determine
the merits and risks of such an investment.
Angel or its associates or research analyst or his relative may have actual/beneficial ownership of 1% or more in the securities of
the subject company at the end of the month immediately preceding the date of publication of the research report. Neither Angel or
its associates nor Research Analysts or his relative has any material conflict of interest at the time of publication of research report.
Angel or its associates might have received any compensation from the companies mentioned in the report during the period
preceding twelve months from the date of this report for services in respect of managing or co-managing public offerings, corporate
finance, investment banking or merchant banking, brokerage services or other advisory service in a merger or specific transaction
in the normal course of business. Angel or its associates did not receive any compensation or other benefits from the companies
mentioned in the report or third party in connection with the research report. Neither Angel nor its research analyst entity has been
engaged in market making activity for the subject company.
Reports based on technical and derivative analysis center on studying charts of a stock's price movement, outstanding positions and
trading volume, as opposed to focusing on a company's fundamentals and, as such, may not match with a report on a company's
fundamentals. Investors are advised to refer the Fundamental and Technical Research Reports available on our website to evaluate
the contrary view, if any.
The information in this document has been printed on the basis of publicly available information, internal data and other reliable
sources believed to be true, but we do not represent that it is accurate or complete and it should not be relied on as such, as this
document is for general guidance only. Angel One Limited or any of its affiliates/ group companies shall not be in any way responsible
for any loss or damage that may arise to any person from any inadvertent error in the information contained in this report. Angel One
Limited has not independently verified all the information contained within this document. Accordingly, we cannot testify, nor make
any representation or warranty, express or implied, to the accuracy, contents or data contained within this document. While Angel
One Limited endeavors to update on a reasonable basis the information discussed in this material, there may be regulatory,
compliance, or other reasons that prevent us from doing so.
This document is being supplied to you solely for your information, and its contents, information or data may not be reproduced,
redistributed or passed on, directly or indirectly.
Neither Angel One Limited, nor its directors, employees or affiliates shall be liable for any loss or damage that may arise from or in
connection with the use of this information. Angel or its associates or Research Analyst or his relative might have financial interest
in the subject company. Research analyst has not served as an officer, director or employee of the subject company.
