May 16, 2023
www.angelone.in
Technical & Derivatives Report
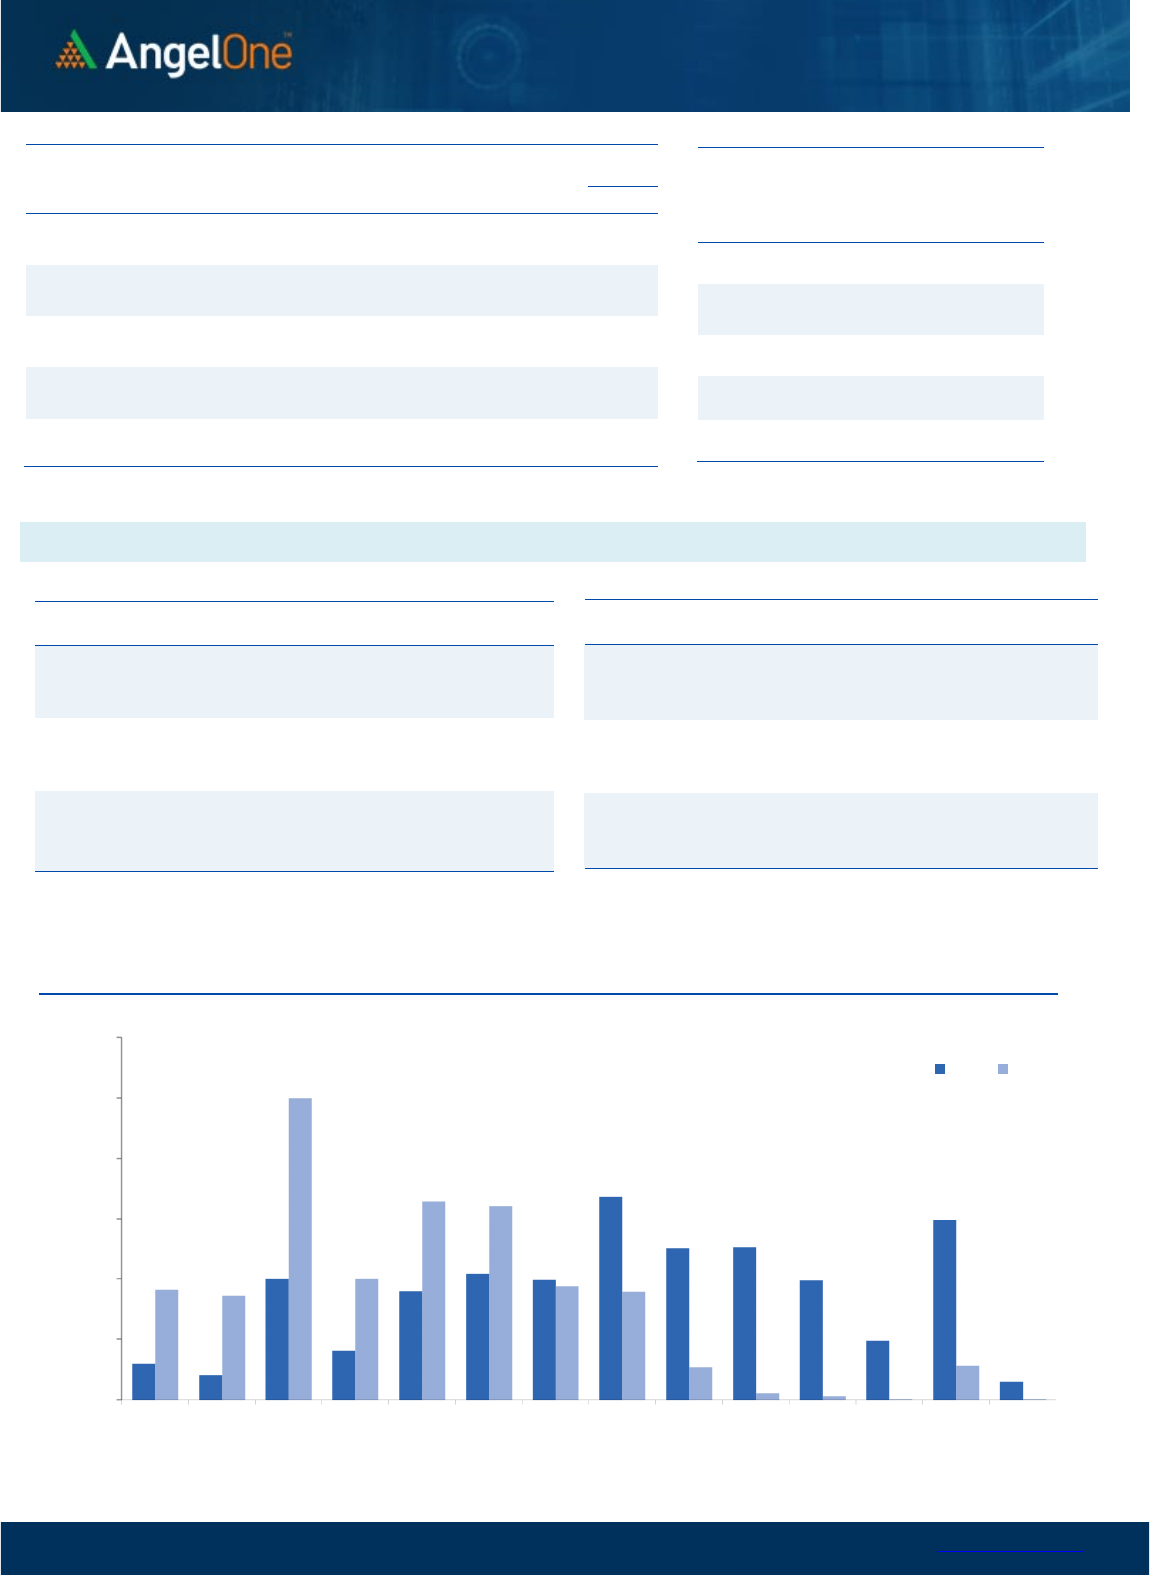
Nifty Bank
Outlook (
4
4072
)
The Bank Nifty index had a splendid run wherein it almost tested
the lifetime high levels amid the buoyancy in the heavyweight
counters. Also, the ease in the inflation data led to a sentimental
rush in the high beta index, which levitated the overall market
sentiments. Amidst the strong day of trade, the Banking index
witnessed the highest-ever close ending with gains of 0.64% tad
below 44100 levels.
Technically, the chart structure construes a robust development
and with the ongoing momentum, it is highly anticipated to surpass
the highs and enter uncharted territory in the near period. As far
as levels are concerned, 44000-43800 is likely to cushion any blip,
followed by the 43500 zone. On the flip side, 44500 could be seen
as the immediate pit-stop for the bulls. The undertone is strongly
bullish, wherein intraday correction could be seen as an
opportunity to add long positions in the index. Meanwhile, a pool
of BFSI counters showcased immense strength. Hence, one needs
to keep a close tab on the thematic movers for better trading
opportunities.
Key Levels
Support 1 – 43800 Resistance 1 – 44380
Support 2 – 43500 Resistance 2 – 44500
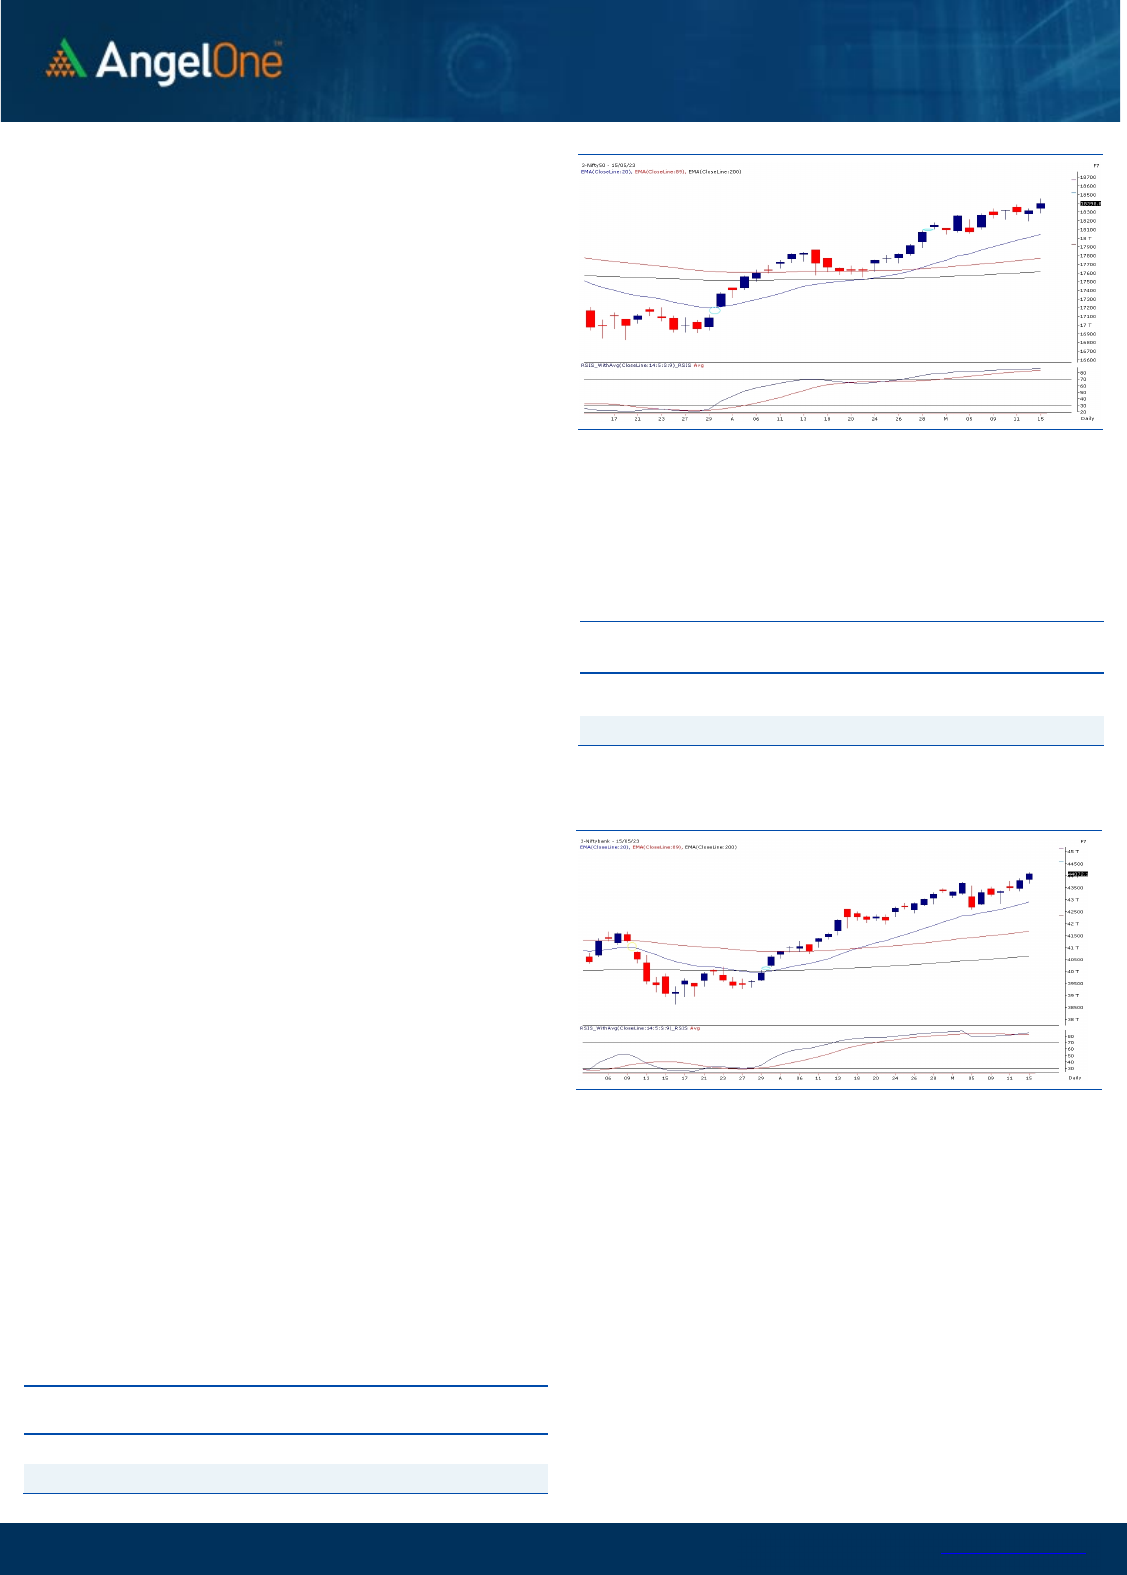
Exhibit 1: Nifty Daily Chart
Exhibit 2: Nifty Bank Daily Chart
Sensex (
6
2
346
) / Nifty (
18
3
99
)
Despite not so favourable global cues, our markets started the week
marginally in the green. After the initial seesaw, the bulls earned the
dominant position and then continued its northward move to even
surpass the 18450 mark on an intraday basis. However, with a
modest profit booking towards the fag end, Nifty concluded the
session around the 18400 mark by pocketing nearly half a percent
gains.
Yesterday’s up move is a sheer display of our inherent strength.
Over the weekend, the developments on the global as well as
domestic front indicated a bit shaky start; but our markets stabilised
in the initial trades to continue its northward journey. Towards the
end, although some profit booking was witnessed, the structure
remains strong, and we expect the benchmark index to challenge
the next resistance of 18500 quite soon. On the flipside, 18350 –
18290 are to be considered as immediate supports.
Any intraday decline towards this sacrosanct zone should ideally
be considered as a buying opportunity. In addition, the banking
index is on the verge of surpassing its previous record highs, we
expect the rally to gather some momentum going ahead. Traders
are advised to be with the trend and should focus on stock
centric approach.
Key Levels
Support 1 – 18350 Resistance 1 – 18500
Support 2 – 18290 Resistance 2 – 18600

www.angelone.in
Technical & Derivatives Report
May 16, 2023
View
The Indian equity markets had a splendid start to the
week, wherein a broad-based buying levitated the
market sentiments. The benchmark index Nifty50
surged nearly half a percent to settle near the 18400
level.
FIIs were net buyers in the cash market segment to
the tune of Rs. 1685 crores. Simultaneously, in Index
futures, they bought worth Rs. 1290 crores with an
increase in open interest, indicating long addition.
In the F&O segment, fresh longs were added to key
indices at the start of the week. The put writers
added a good amount of positions in 18300-18200
strikes and on the other side, build-up remained
scattered 18500-18700 call options. Stronger hands
continued their buying streaks in equities and added
a few longs in the index futures segment. Their Long
Short Ratio’ advanced to 50% from 46%. Considering
the above data point, we expect a continuation of
the ongoing rally towards 18400-18500 and hence,
would advocate using intraday declines to add longs.
Comments
The Nifty futures open interest has increased by 2.27%
and Bank Nifty futures open interest has increased by
7.02% as the market closed at 18398.85.
The Nifty May future closed with a premium of 18.70
point against a premium of 18.60 point in the last
trading session. The June series closed at a premium of
75.10 point.
The INDIA VIX has increased from 12.85 to 13.17. At the
same time, the PCR-OI of Nifty has increased from 1.24
to 1.35.
Few of the liquid counters where we have seen high
cost of carry are DLF, COLPAL, HEROMOTOCO,
OBEROIRLTY and DABUR.
Historical Volatility
SCRIP HV
ADANIENT 88.64
IDEA 66.68
IBULHSGFIN 63.02
RBLBANK 60.60
ADANIPORTS 56.51
Nifty Vs OI
17200
17400
17600
17800
18000
18200
18400
18600
4,000
6,000
8,000
10,000
12,000
14,000
16,000
4/26 4/28 5/3 5/5 5/9 5/12
Openinterest Nifty
OI Gainers
SCRIP OI
OI
CHG. (%)
PRICE
PRICE
CHG. (%)
COROMANDEL 1470700 14.06 960.80 -1.17
COLPAL 2815050 13.91 1673.65 3.07
BALRAMCHIN 8150400 10.24 384.60 -0.67
BERGEPAINT 9825200 7.93 629.20 -0.71
ASHOKLEY 45525000 7.89 153.35 2.10
CANFINHOME 3993600 7.53 658.95 2.69
SBICARD 8307200 7.47 890.95 2.63
MGL 2432000 7.04 1052.95 0.48
OI Losers
SCRIP OI
OI
CHG. (%)
PRICE
PRICE
CHG. (%)
HAL 17600 -13.53 3024.35 1.62
POLYCAB 1326900 -12.73 3381.15 -0.55
ABB 1534250 -11.94 3855.35 -2.18
ASTRAL 1615901 -10.92 1595.65 1.23
DABUR 13576250 -10.05 533.05 2.55
SIEMENS 2056175 -9.67 3833.40 -1.49
CIPLA 11711050 -8.03 922.80 -1.57
MCX 1366400 -6.67 1382.25 2.16
Put-Call Ratio
SCRIP PCR (OI) PCR (VOL)
NIFTY 1.35 1.00
BANKNIFTY 1.42 0.81
RELIANCE 0.72 0.51
ICICIBANK 1.01 0.62
INFY 0.47 0.46
www.angelone.in
Technical & Derivatives Report
May 16, 2023
Note: Above mentioned Bullish or Bearish Spreads in Nifty (May Series) are given as an information and not as a recommendation.
Nifty Spot =
18
3
98
.8
5
FII Statistics for
May
1
5
, 202
3
Detail Buy
Contracts
OI Value
(in Cr.)
Sell Net
CHANGE
INDEX
FUTURES
3461.90 2171.41 1290.49
192850 18565.81 3.65
INDEX
OPTIONS
840029.44 838575.85 1453.59
3367751 324732.49 20.89
STOCK
FUTURES
11707.95 11062.37 645.58
2335017 161514.16 0.05
STOCK
OPTIONS
17169.27 17294.04 (124.77) 253896 17913.87 2.14
Total
872368.56
869103.67
3264.89
6149514
522726.33
10.72
Turnover on
May
1
5
, 202
3
Instrument
No. of
Contracts
Turnover
( in Cr. )
Change
(%)
Index Futures
218399 21723.70 -48.27
Index Options
147551374
42835.06 -30.65
Stock Futures
784640 55047.67 -26.21
Stock Options
4018640 3651.57 -16.97
Total
40,18,640
3651.57 -32.56
Bull-Call Spreads
Action Strike Price Risk Reward BEP
Buy
18400 132.95
50.25
49.75
18450.25
Sell
18500 82.70
Buy
18400 132.95
87.75
112.25
18487.75
Sell
18600 45.20
Buy
18500 82.70
37.50 62.50 18537.50
Sell
18600 45.20
Bear-Put Spreads
Action Strike Price Risk Reward BEP
Buy
18400 112.00
34.50
65.50
18365.50
Sell 18300 77.50
Buy 18400 112.00
59.70
140.30
18340.30
Sell
18200 52.30
Buy
18300 77.50
25.20 74.80 18274.80
Sell 18200 52.30
Nifty Put-Call Analysis
,0
1000,000
2000,000
3000,000
4000,000
5000,000
6000,000
17800 17900 18000 18100 18200 18300 18400 18500 18600 18700 18800 18900 19000 19100
Call Put

www.angelone.in
Technical & Derivatives Report
May 16, 2023
`
Daily
Pivot Levels for Nifty Constituents
Scrips
S2
S1
PIVOT
R1
R2
ADANIENT
1,836
1,876
1,920
1,961
2,005
ADANIPORTS 680 687
694
701
709
APOLLOHOSP
4,537
4,582
4,635
4,680
4,733
ASIANPAINT
3,093
3,113
3,140
3,160
3,187
AXISBANK 904 910
915
920
925
BAJAJ-AUTO
4,505
4,535
4,572
4,601
4,638
BAJFINANCE
6,652
6,682
6,716
6,746
6,780
BAJAJFINSV
1,408
1,415
1,422
1,429
1,436
BPCL 352 354
359
362
367
BHARTIARTL 783 790
796
803
809
BRITANNIA
4,586
4,609
4,644
4,666
4,701
CIPLA 877 900
920
943
963
COALINDIA 231 235
237
240
243
DIVISLAB
3,221
3,249
3,293
3,320
3,364
DRREDDY
4,413
4,466
4,499
4,552
4,585
EICHERMOT
3,590
3,624
3,665
3,699
3,740
GRASIM
1,710
1,722
1,742
1,753
1,773
HCLTECH
1,086
1,093
1,100
1,106
1,113
HDFCBANK
1,658
1,667
1,674
1,683
1,690
HDFCLIFE
553
556
560
563
566
HDFC
2,759
2,772
2,784
2,797
2,809
HEROMOTOCO
2,559
2,625
2,673
2,739
2,787
HINDALCO 401 406
409
414
418
HINDUNILVR
2,604
2,633
2,652
2,681
2,700
ICICIBANK 934 940
944
950
955
INDUSINDBK
1,186
1,203
1,213
1,229
1,239
INFY
1,234
1,246
1,258
1,270
1,281
ITC 416 422
425
431
435
JSW STEEL 691 698
704
712
718
KOTAKBANK
1,943
1,958
1,967
1,983
1,992
LT
2,196
2,221
2,241
2,266
2,286
M&M
1,267
1,276
1,282
1,291
1,297
MARUTI
9,111
9,159
9,233
9,281
9,356
NESTLEIND
21,584
21,685
21,853
21,954
22,121
NTPC 173 174
176
177
178
ONGC 163 164
166
167
168
POWERGRID 240 242
244
245
247
RELIANCE
2,458
2,473
2,489
2,505
2,520
SBILIFE
1,175
1,182
1,188
1,196
1,202
SBIN 571 576
580
586
590
SUNPHARMA 945 949
952
956
960
TCS
3,221
3,238
3,265
3,282
3,309
TATACONSUM
780 784
788
791
795
TATAMOTORS 514 523
530
538
545
TATASTEEL 105 106
107
109
110
TECHM
1,031
1,048
1,059
1,076
1,087
TITAN
2,744
2,762
2,782
2,800
2,820
ULTRACEMCO
7,692
7,727
7,751
7,785
7,809
UPL 671 674
677
680
683
WIPRO 381 383
385
388
390

www.angelone.in
Technical & Derivatives Report
May 16, 2023
*
Technical and Derivatives Team:
Sameet Chavan Head Research – Technical & Derivatives sameet.chavan@angelone.in
Sneha Seth Senior Analyst – Technical & Derivatives sneha.seth@angelone.in
Rajesh Bhosale Technical Analyst rajesh.bhosle@angelone.in
Osho Krishan Senior Analyst – Technical & Derivatives osho.krishan@angelone.in
Research Team Tel: 022 – 39357600 Website: www.angelone.in
For Technical Queries E-mail: technicalresearch-cso@angelone.in
For Derivatives Queries E-mail: derivatives.desk@angelone.in
DISCLAIMER
Angel One Limited (hereinafter referred to as “Angel”) is a registered Member of National Stock Exchange of India Limited, Bombay Stock Exchange
Limited and Metropolitan Stock Exchange Limited. It is also registered as a Depository Participant with CDSL and Portfolio Manager and investment
advisor with SEBI. It also has registration with AMFI as a Mutual Fund Distributor. Angel One Limited is a registered entity with SEBI for Research
Analyst in terms of SEBI (Research Analyst) Regulations, 2014 vide registration number INH000000164. Angel or its associates has not been
debarred/ suspended by SEBI or any other regulatory authority for accessing /dealing in securities Market.
This document is solely for the personal information of the recipient, and must not be singularly used as the basis of any investment decision.
Nothing in this document should be construed as investment or financial advice. Each recipient of this document should make such investigations
as they deem necessary to arrive at an independent evaluation of an investment in the securities of the companies referred to in this document
(including the merits and risks involved), and should consult their own advisors to determine the merits and risks of such an investment.
Angel or its associates or research analyst or his relative may have actual/beneficial ownership of 1% or more in the securities of the subject
company at the end of the month immediately preceding the date of publication of the research report. Neither Angel or its associates nor
Research Analysts or his relative has any material conflict of interest at the time of publication of research report.
Angel or its associates might have received any compensation from the companies mentioned in the report during the period preceding twelve
months from the date of this report for services in respect of managing or co-managing public offerings, corporate finance, investment banking or
merchant banking, brokerage services or other advisory service in a merger or specific transaction in the normal course of business. Angel or its
associates did not receive any compensation or other benefits from the companies mentioned in the report or third party in connection with the
research report. Neither Angel nor its research analyst entity has been engaged in market making activity for the subject company.
Reports based on technical and derivative analysis center on studying charts of a stock's price movement, outstanding positions and trading
volume, as opposed to focusing on a company's fundamentals and, as such, may not match with a report on a company's fundamentals. Investors
are advised to refer the Fundamental and Technical Research Reports available on our website to evaluate the contrary view, if any.
The information in this document has been printed on the basis of publicly available information, internal data and other reliable sources believed
to be true, but we do not represent that it is accurate or complete and it should not be relied on as such, as this document is for general guidance
only. Angel One Limited or any of its affiliates/ group companies shall not be in any way responsible for any loss or damage that may arise to any
person from any inadvertent error in the information contained in this report. Angel One Limited has not independently verified all the information
contained within this document. Accordingly, we cannot testify, nor make any representation or warranty, express or implied, to the accuracy,
contents or data contained within this document. While Angel One Limited endeavors to update on a reasonable basis the information discussed
in this material, there may be regulatory, compliance, or other reasons that prevent us from doing so.
This document is being supplied to you solely for your information, and its contents, information or data may not be reproduced, redistributed or
passed on, directly or indirectly.
Neither Angel One Limited, nor its directors, employees or affiliates shall be liable for any loss or damage that may arise from or in connection
with the use of this information. Angel or its associates or Research Analyst or his relative might have financial interest in the subject company.
Research analyst has not served as an officer, director or employee of the subject company.
