March 16, 2023
www.angelone.in
Technical & Derivatives Report
Nifty Bank
Outlook (
39
051
)
The banking index also had a gap-up start but failed to sustain at
higher levels and gradually plunged throughout the day to slip
below the 200 SMA. The Bank Nifty index corrected for the fifth
straight session and settled a tad above the 39000 mark with a cut
of nearly a percent.
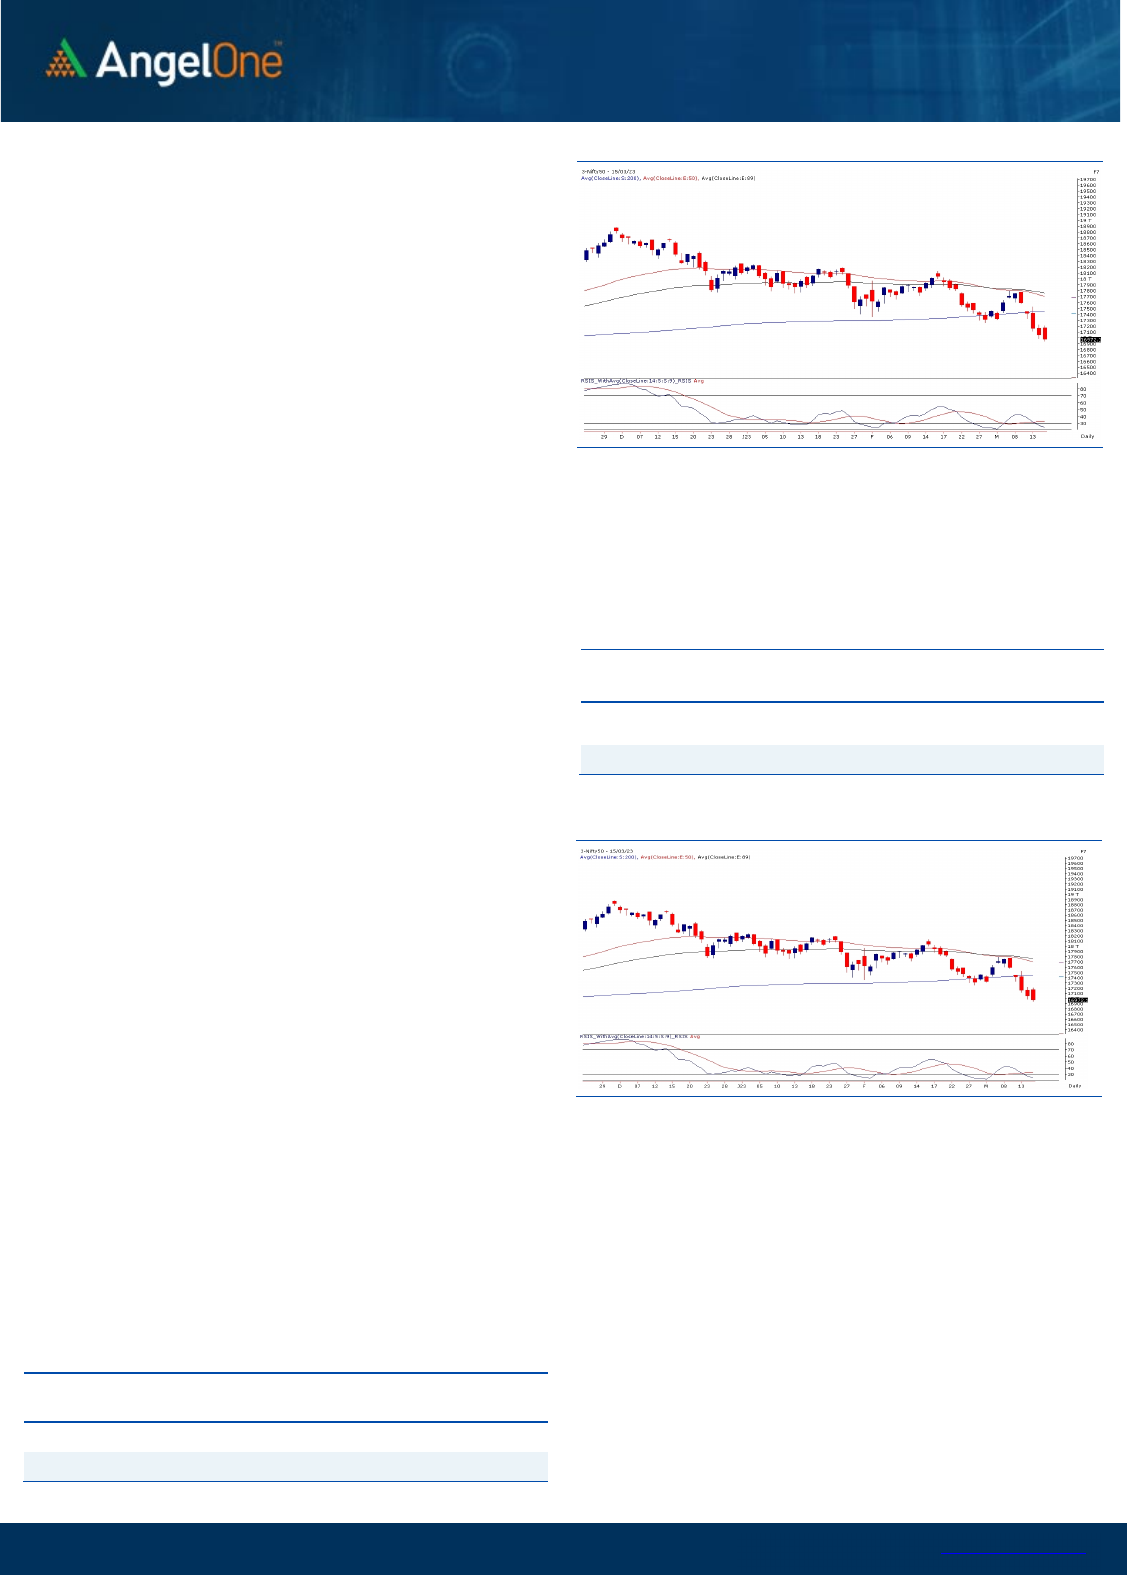
On the technical aspect, the index has made a strong bearish
candle on the daily chart and has plunged below the 200 SMA,
indicating intense selling pressure in the overall space. The recent
development has shaken the chart structure in the intermediate
period. However, the index has slipped way below into the
oversold territory, and one should avoid fresh shorts for the time
being. As far as levels are concerned, 38800-38600 is likely to
cushion any further blip. While on the higher end, 39600 is likely to
act as resistance, followed by the 39800-40000 zone in the
comparable period. Hence, one needs to keep a close tab on the
mentioned levels and avoid aggressive trade in the index for the
time being.
Key Levels
Support 1 – 38800 Resistance 1 – 39800
Support 2 – 38600 Resistance 2 – 40000
Exhibit 1: Nifty Daily Chart
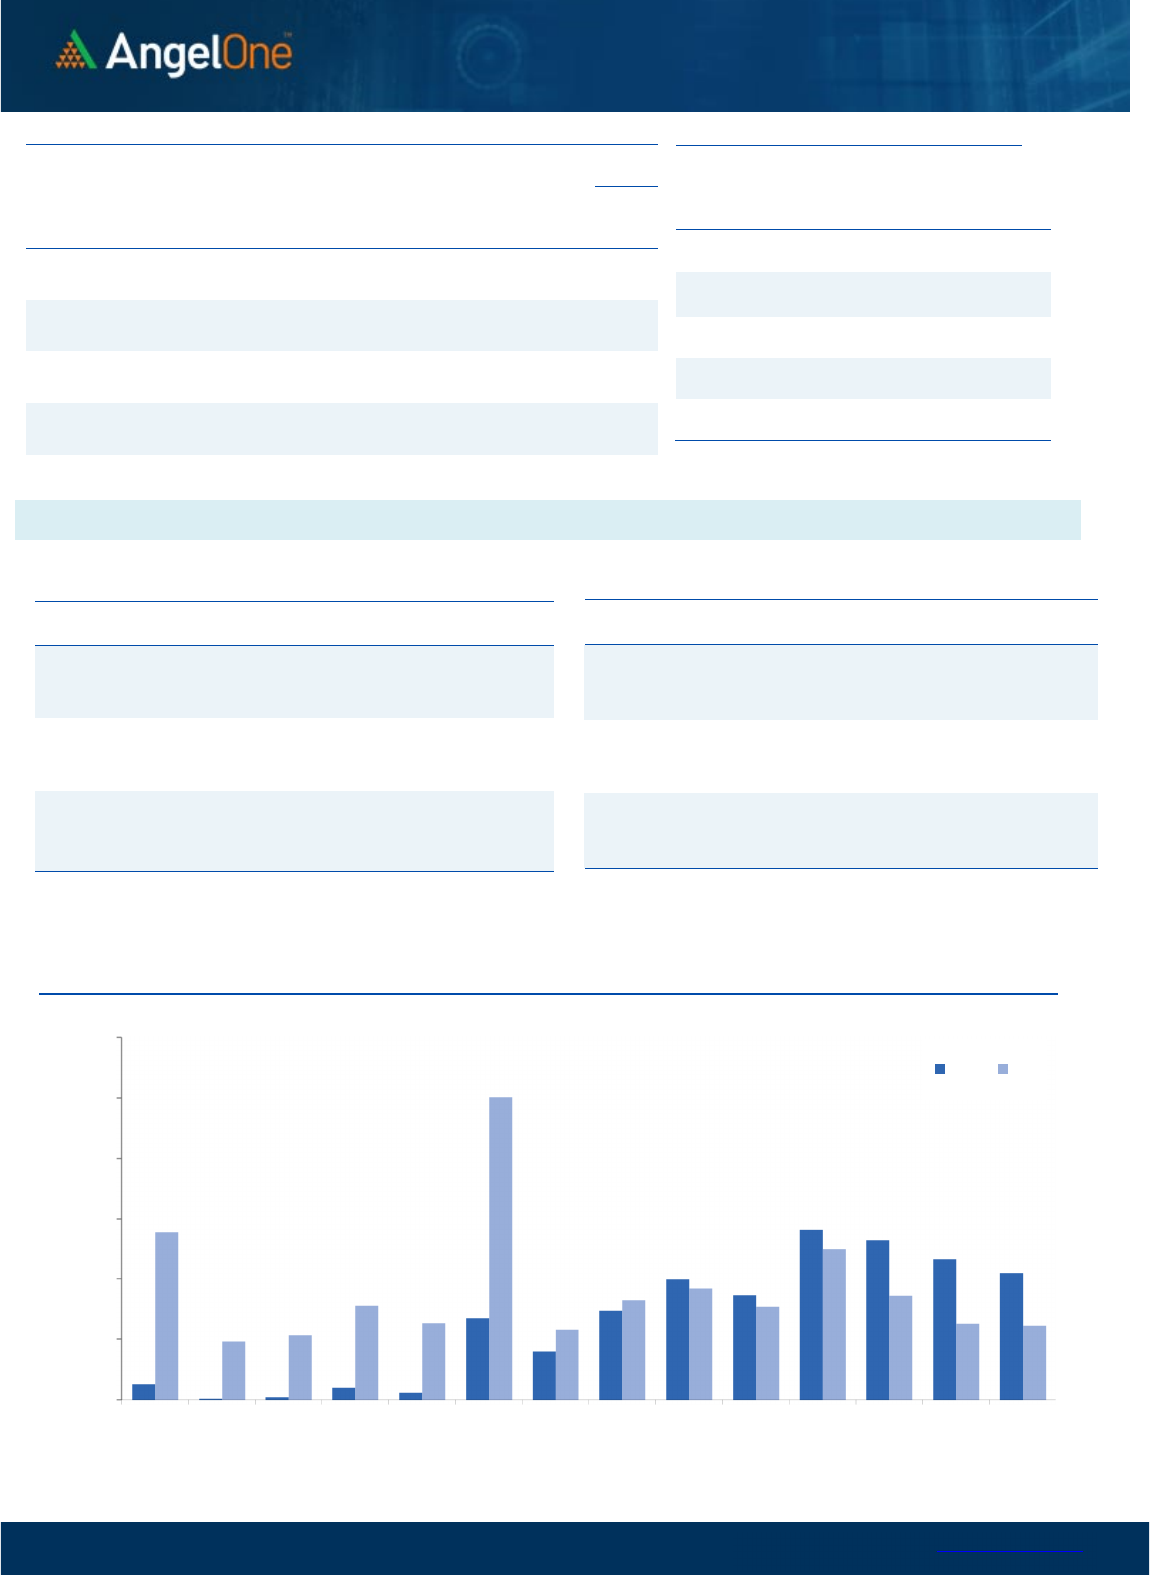
Exhibit 2: Nifty Bank Daily Chart
Sensex (
5
7
556
) / Nifty (
16972
)
The positive development in the overseas market led to a promising
start to our Indian market, wherein the benchmark index had a
decent gap up opening. But soon after the opening bell, the index
gradually slipped to test the previous days’ closure, trimming down
all the initial gains and sentiments. Also, by the fag end, the sell-off
aggravated which plunged the index into the negative terrain to
slide below the psychological mark of 17000. With no respite from
the sell-off, Nifty continued its down run for the fifth consecutive
session and settled a tad below the 17000 mark, shedding 0.42
percent.
Technically, the bulls failed to capitalize on the heads-up move and
the lack of buying emergence led the market to slip to lower levels,
signifying a strong sense of tentativeness among participants. The
decisive breach of the 17000 mark undoubtedly dented the
sentiments, but as we allude to our previous commentary, the
16900-17000 odd zone is expected to cushion the fall. And we
remain hopeful till the market withholds the range. On the higher
end, 17200-17250 is expected to act as an immediate hurdle,
followed by the sturdy wall of 200 SMA, placed around 17400-
17450 in a comparable period.
Considering the price action, our market looks bleak but at the
same time a bit oversold too. We advocate not to comply with
the ongoing sell-off and wait for some positive triggers to levitate
the markets. Meanwhile, one should keep a close tab on the
mentioned levels and avoid aggressive bets for the time being.
Simultaneously, stay abreast with global developments.
Key Levels
Support 1 – 16900 Resistance 1 – 17200
Support 2 – 16800 Resistance 2 – 17250

www.angelone.in
Technical & Derivatives Report
March 16, 2023
View
We had a promising start after recent sell-off but we
failed to capitalized the early morning gains as index
gradually inched lower to not only erase all the gains
but conclude the day tad below psychological mark
of 17000
FIIs were net sellers in the cash market segment to
the tune of Rs. 1271 crores. Simultaneously, in Index
futures, they bought marginally with good amount of
fall in open interest, indicating unwinding of both
long and short positions.
Looking at the F&O data, no relevant build-up
witnessed in key indices. On the options front, a
decent piling of OI is seen at the 17000-17300 call
strike, which is mostly short positions. On the flip
side, the highest open interest concentration is
visible in 16800 put strike; suggesting support has
shifted lower now. Meanwhile, the stronger hands
continue their selling streak not only in equities but
also in index futures recently. The ‘Long Short Ratio’
has declined further to 12% from 16% seen on Friday.
At this point in time, we believe market is extremely
oversold and 16800-16900 should act as a strong
support zone.
Comments
The Nifty futures open interest has increased by 0.97%
and Bank Nifty futures open interest has decreased by
0.83% as the market closed at 16972.15.
The Nifty March future closed with a premium of 65.20
point against a premium of 82.45 point in the last
trading session. The April series closed at a premium of
162.70 point.
The INDIA VIX has increased from 16.21 to 16.29. At the
same time, the PCR-OI of Nifty has decreased from 0.69
to 0.67.
Few of the liquid counters where we have seen high
cost of carry are IDEA, ASTRAL, TATACOMM, VEDL and
IOC.
Historical Volatility
SCRIP HV
PETRONET 28.31
GMRINFRA 44.19
ASIANPAINT 29.74
IEX 42.43
PAGEIND 32.61
Nifty Vs OI
16600
16800
17000
17200
17400
17600
17800
18000
,0
2,000
4,000
6,000
8,000
10,000
12,000
14,000
16,000
18,000
2/22 2/24 2/28 3/2 3/6 3/9 3/13 3/15
Openinterest Nifty
OI Gainers
SCRIP OI
OI
CHG. (%)
PRICE
PRICE
CHG. (%)
CUMMINSIND 3792000 11.74 1697.60 -0.06
GMRINFRA 132435000 10.76 41.35 4.66
PETRONET 15261000 9.05 236.70 3.55
ATUL 170325 8.97 6820.80 -0.08
NAVINFLUOR 543600 8.11 4176.10 1.11
MPHASIS 2855050 6.61 1899.35 0.13
POLYCAB 1308900 6.23 2928.25 0.87
MARUTI 2217000 5.20 8474.85 -0.54
OI Losers
SCRIP OI
OI
CHG. (%)
PRICE
PRICE
CHG. (%)
COFORGE 17600 -8.10 3950.00 0.72
JKCEMENT 453250 -8.06 2805.05 0.84
CROMPTON 6132000 -7.64 290.00 0.19
ASTRAL 2255582 -7.02 1349.80 -3.37
METROPOLIS 897200 -6.97 1264.85 2.79
GLENMARK 4821250 -6.81 428.15 2.75
GUJGASLTD 4645000 -6.77 491.65 -2.05
NATIONALUM 50407500 -6.65 83.70 1.64
Put-Call Ratio
SCRIP PCR (OI) PCR (VOL)
NIFTY 0.67 0.94
BANKNIFTY 0.53 1.02
RELIANCE 0.49 0.50
ICICIBANK 0.58 0.54
INFY 0.42 0.55
www.angelone.in
Technical & Derivatives Report
March 16, 2023
Note: Above mentioned Bullish or Bearish Spreads in Nifty (March Series) are given as an information and not as a recommendation.
Nifty Spot =
1
6972.15
0900
Lot Size = 75
FII Statistics for
March
1
5
, 202
3
Detail Buy
Contracts
Open
Interest
Value
(in Cr.)
Sell
Net
CHANGE
INDEX
FUTURES
5284.11
5202.52
81.59
188550
16648.66
(4.19)
INDEX
OPTIONS
1344005.66
1355994.72
(11989.06) 3088720
274695.39
(1.01)
STOCK
FUTURES
9739.22
9482.91
256.31
2214454
142467.37
(0.18)
STOCK
OPTIONS
12504.14
12608.17
(104.03) 174169
11277.38
2.14
Total 1371533.13
1383288.32
(11755.19) 5665893
445088.80
(0.70)
Turnover
on
March
1
5
, 202
3
Instrument
No. of
Contracts
Turnover
( in Cr. )
Change
(%)
Index Futures
429018 39766.83
-23.47
Index Options
229139189
64045.80
-22.24
Stock Futures
715996 45842.27
-11.68
Stock Options
3309320 3203.47 -3.98
Total
3,309,320 3203.47 -19.36
Bull-Call Spreads
Action Strike Price Risk Reward BEP
Buy
17000 228.95
53.75
46.25
17053.75
Sell
17100 175.20
Buy
17000 228.95
99.75
100.25
17099.75
Sell
17200 129.20
Buy
17100 175.20
46.00 54.00 17146.00
Sell
17200 129.20
Bear-Put Spreads
Action Strike Price Risk Reward BEP
Buy
17000 197.70
37.85
62.15
16962.15
Sell 16900 159.85
Buy 17000 197.70
70.55
129.45
16929.45
Sell
16800 127.15
Buy
16900 159.85
32.70 67.30 16867.30
Sell 16800 127.15
Nifty Put-Call Analysis
,0
1000,000
2000,000
3000,000
4000,000
5000,000
6000,000
16500 16600 16700 16800 16900 17000 17100 17200 17300 17400 17500 17600 17700 17800
Call Put

www.angelone.in
Technical & Derivatives Report
March 16, 2023
`
Daily
Pivot Levels for Nifty
Constituents
Scrips
S2
S1
PIVOT
R1
R2
ADANIENT
1,656
1,748
1,820
1,911
1,983
ADANIPORTS 644 662
675
692
705
APOLLOHOSP
4,277
4,303
4,335
4,361
4,394
ASIANPAINT
2,719
2,773
2,820
2,874
2,921
AXISBANK 805 814
829
839
853
BAJAJ-AUTO
3,679
3,705
3,746
3,771
3,813
BAJFINANCE
5,628
5,673
5,747
5,792
5,866
BAJAJFINSV
1,258
1,271
1,290
1,302
1,322
BPCL 324 327
330
333
336
BHARTIARTL 745 751
758
764
771
BRITANNIA
4,182
4,213
4,268
4,299
4,354
CIPLA 867 873
878
883
889
COALINDIA 217 219
221
222
225
DIVISLAB
2,731
2,754
2,779
2,801
2,827
DRREDDY
4,303
4,349
4,387
4,433
4,471
EICHERMOT
2,965
2,986
3,023
3,044
3,081
GRASIM
1,526
1,538
1,559
1,571
1,592
HCLTECH
1,062
1,071
1,084
1,093
1,107
HDFCBANK
1,508
1,525
1,554
1,571
1,600
HDFCLIFE
457
462
470
475
483
HDFC
2,479
2,504
2,545
2,570
2,612
HEROMOTOCO
2,348
2,364
2,386
2,402
2,424
HINDALCO 400 403
408
411
416
HINDUNILVR
2,353
2,380
2,420
2,446
2,486
ICICIBANK 809 817
831
839
852
INDUSINDBK
1,010
1,027
1,057
1,074
1,104
INFY
1,400
1,410
1,426
1,436
1,452
ITC 374 377
381
383
387
JSW STEEL 670 675
680
685
690
KOTAKBANK
1,645
1,656
1,672
1,682
1,698
LT
2,131
2,154
2,183
2,206
2,235
M&M
1,141
1,151
1,163
1,172
1,184
MARUTI
8,275
8,375
8,540
8,640
8,805
NESTLEIND
17,590
17,792
18,081
18,283
18,573
NTPC 177 177
179
179
180
ONGC 150 151
153
154
156
POWERGRID 224 226
228
230
232
RELIANCE
2,183
2,210
2,254
2,281
2,325
SBILIFE
1,048
1,056
1,068
1,076
1,087
SBIN 505 511
522
528
538
SUNPHARMA 940 946
955
961
971
TCS
3,149
3,174
3,217
3,242
3,285
TATACONSUM
678 683
691
696
705
TATAMOTORS 401 406
415
421
430
TATASTEEL 107 108
108
109
110
TECHM
1,097
1,106
1,119
1,128
1,141
TITAN
2,364
2,381
2,398
2,415
2,432
ULTRACEMCO
7,018
7,059
7,124
7,165
7,229
UPL 691 697
706
712
721
WIPRO 369 373
378
381
387
www.angelone.in
Technical & Derivatives Report
March 16, 2023
*
Technical and Derivatives Team:
Sameet Chavan Chief Analyst – Technical & Derivatives sameet.chavan@angelone.in
Sneha Seth Senior Analyst – Technical & Derivatives sneha.seth@angelone.in
Rajesh Bhosale Technical Analyst rajesh.bhosle@angelone.in
Osho Krishan Senior Analyst – Technical & Derivatives osho.krishan@angelone.in
Research Team Tel: 022 – 39357600 Website: www.angelone.in
For Technical Queries E-mail: technicalresearch-cso@angelone.in
For Derivatives Queries E-mail: derivatives.desk@angelone.in
DISCLAIMER
Angel One Limited (hereinafter referred to as “Angel”) is a registered Member of National Stock Exchange of India Limited, Bombay Stock Exchange
Limited and Metropolitan Stock Exchange Limited. It is also registered as a Depository Participant with CDSL and Portfolio Manager and investment
advisor with SEBI. It also has registration with AMFI as a Mutual Fund Distributor. Angel One Limited is a registered entity with SEBI for Research
Analyst in terms of SEBI (Research Analyst) Regulations, 2014 vide registration number INH000000164. Angel or its associates has not been
debarred/ suspended by SEBI or any other regulatory authority for accessing /dealing in securities Market.
This document is solely for the personal information of the recipient, and must not be singularly used as the basis of any investment decision.
Nothing in this document should be construed as investment or financial advice. Each recipient of this document should make such investigations
as they deem necessary to arrive at an independent evaluation of an investment in the securities of the companies referred to in this document
(including the merits and risks involved), and should consult their own advisors to determine the merits and risks of such an investment.
Angel or its associates or research analyst or his relative may have actual/beneficial ownership of 1% or more in the securities of the subject
company at the end of the month immediately preceding the date of publication of the research report. Neither Angel or its associates nor
Research Analysts or his relative has any material conflict of interest at the time of publication of research report.
Angel or its associates might have received any compensation from the companies mentioned in the report during the period preceding twelve
months from the date of this report for services in respect of managing or co-managing public offerings, corporate finance, investment banking or
merchant banking, brokerage services or other advisory service in a merger or specific transaction in the normal course of business. Angel or its
associates did not receive any compensation or other benefits from the companies mentioned in the report or third party in connection with the
research report. Neither Angel nor its research analyst entity has been engaged in market making activity for the subject company.
Reports based on technical and derivative analysis center on studying charts of a stock's price movement, outstanding positions and trading
volume, as opposed to focusing on a company's fundamentals and, as such, may not match with a report on a company's fundamentals. Investors
are advised to refer the Fundamental and Technical Research Reports available on our website to evaluate the contrary view, if any.
The information in this document has been printed on the basis of publicly available information, internal data and other reliable sources believed
to be true, but we do not represent that it is accurate or complete and it should not be relied on as such, as this document is for general guidance
only. Angel One Limited or any of its affiliates/ group companies shall not be in any way responsible for any loss or damage that may arise to any
person from any inadvertent error in the information contained in this report. Angel One Limited has not independently verified all the information
contained within this document. Accordingly, we cannot testify, nor make any representation or warranty, express or implied, to the accuracy,
contents or data contained within this document. While Angel One Limited endeavors to update on a reasonable basis the information discussed
in this material, there may be regulatory, compliance, or other reasons that prevent us from doing so.
This document is being supplied to you solely for your information, and its contents, information or data may not be reproduced, redistributed or
passed on, directly or indirectly.
Neither Angel One Limited, nor its directors, employees or affiliates shall be liable for any loss or damage that may arise from or in connection
with the use of this information. Angel or its associates or Research Analyst or his relative might have financial interest in the subject company.
Research analyst has not served as an officer, director or employee of the subject company.
