November 15, 2021
www.angelone.in
Technical & Derivatives Report
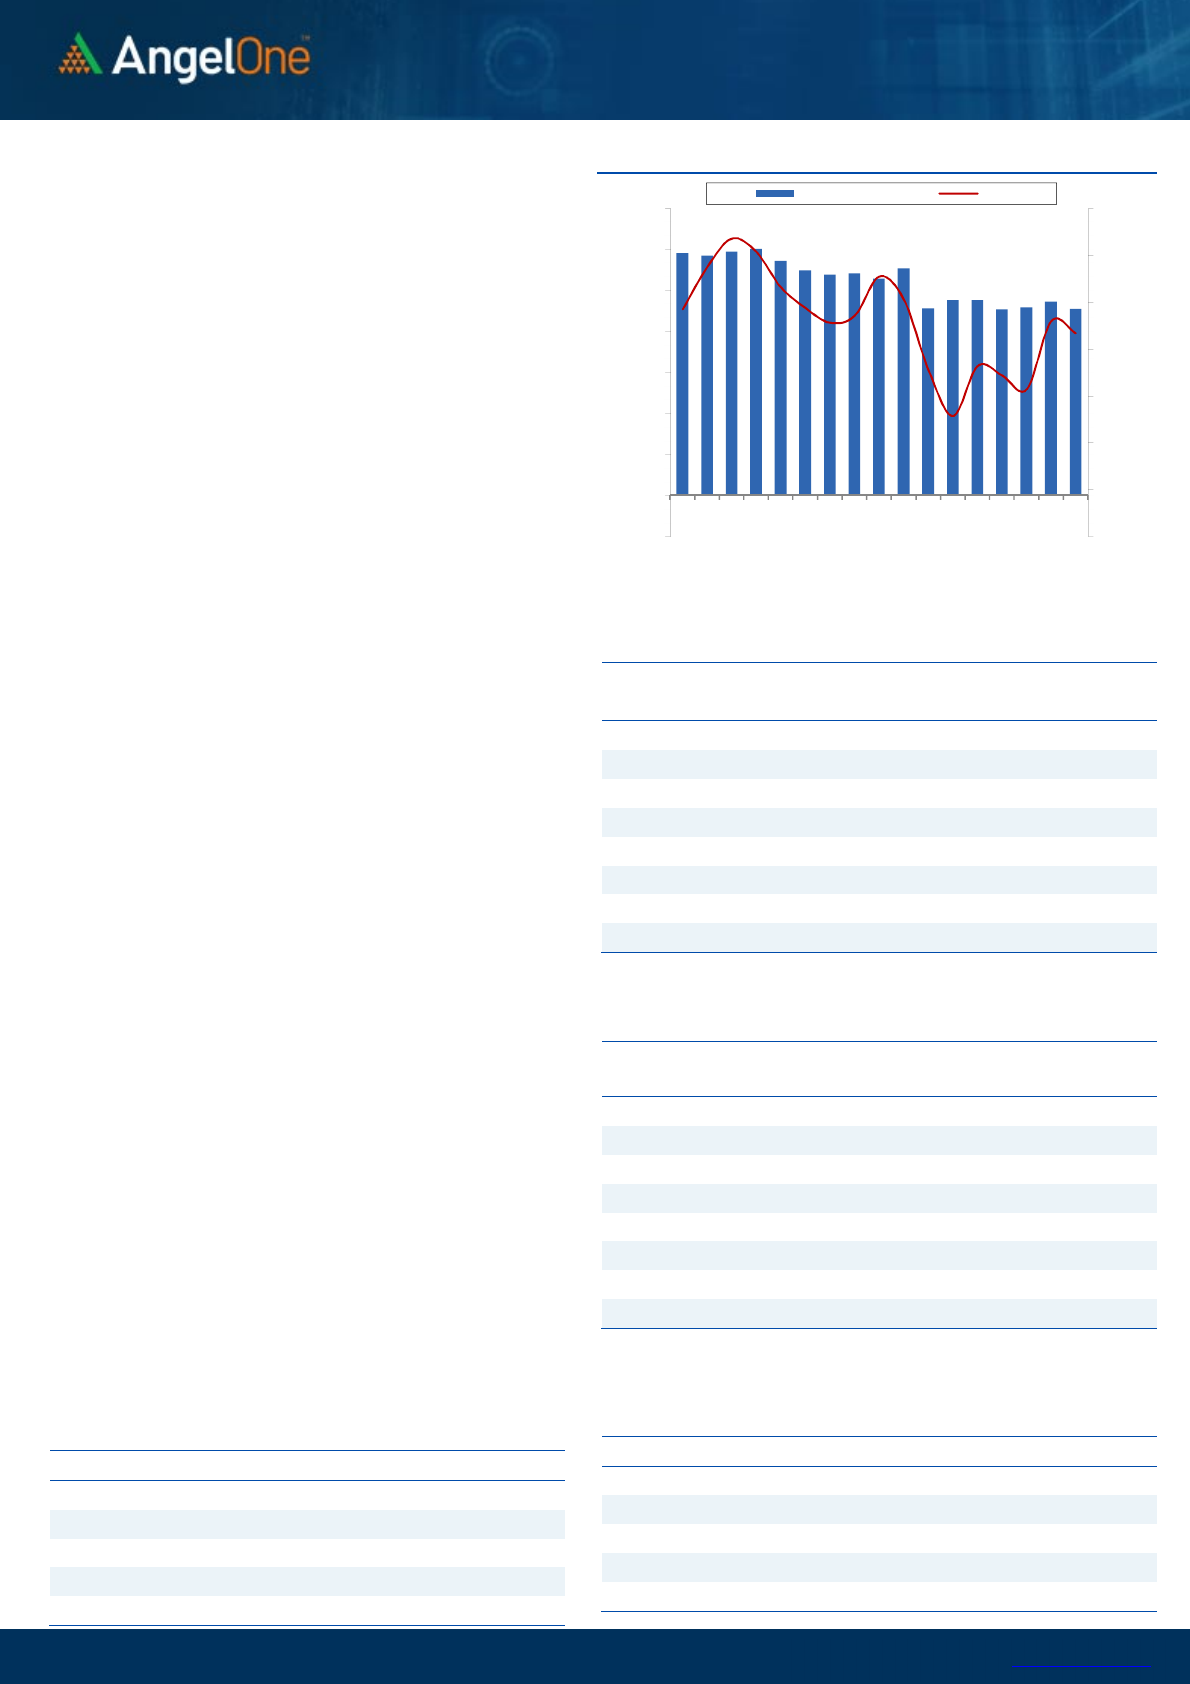
Nifty Bank Outlook - (38733)
On Friday, Bank Nifty started on a positive note however it slipped
lower in the first couple of hours. Subsequently, as the benchmark
index picked positive momentum the banking index as well bounced
back to re-test the opening levels and around the same with half a
percent gains at 38733.
In our previous outlook, we had mentioned Bank Nifty placed on the
50SMA and we may see a bounce back. Now the Bank Index has
formed a ‘Doji’ pattern which indicates uncertainty and is placed
between the trendline breakdown levels and 50SMA. In this week it
would be crucial to see the follow up move. However with the charts
already distorted we would suggest avoiding aggressive longs and
infact using any further bounce to lighten up longs. As far as levels are
concerned, immediate resistance is at 39000 – 39150 whereas support
is placed around 38400 – 38250.
Key Levels
Support 1 – 38250 Resistance 1 – 38900
Support 2 – 37900 Resistance 2 – 39150
Exhibit 2: Nifty Bank Daily Chart
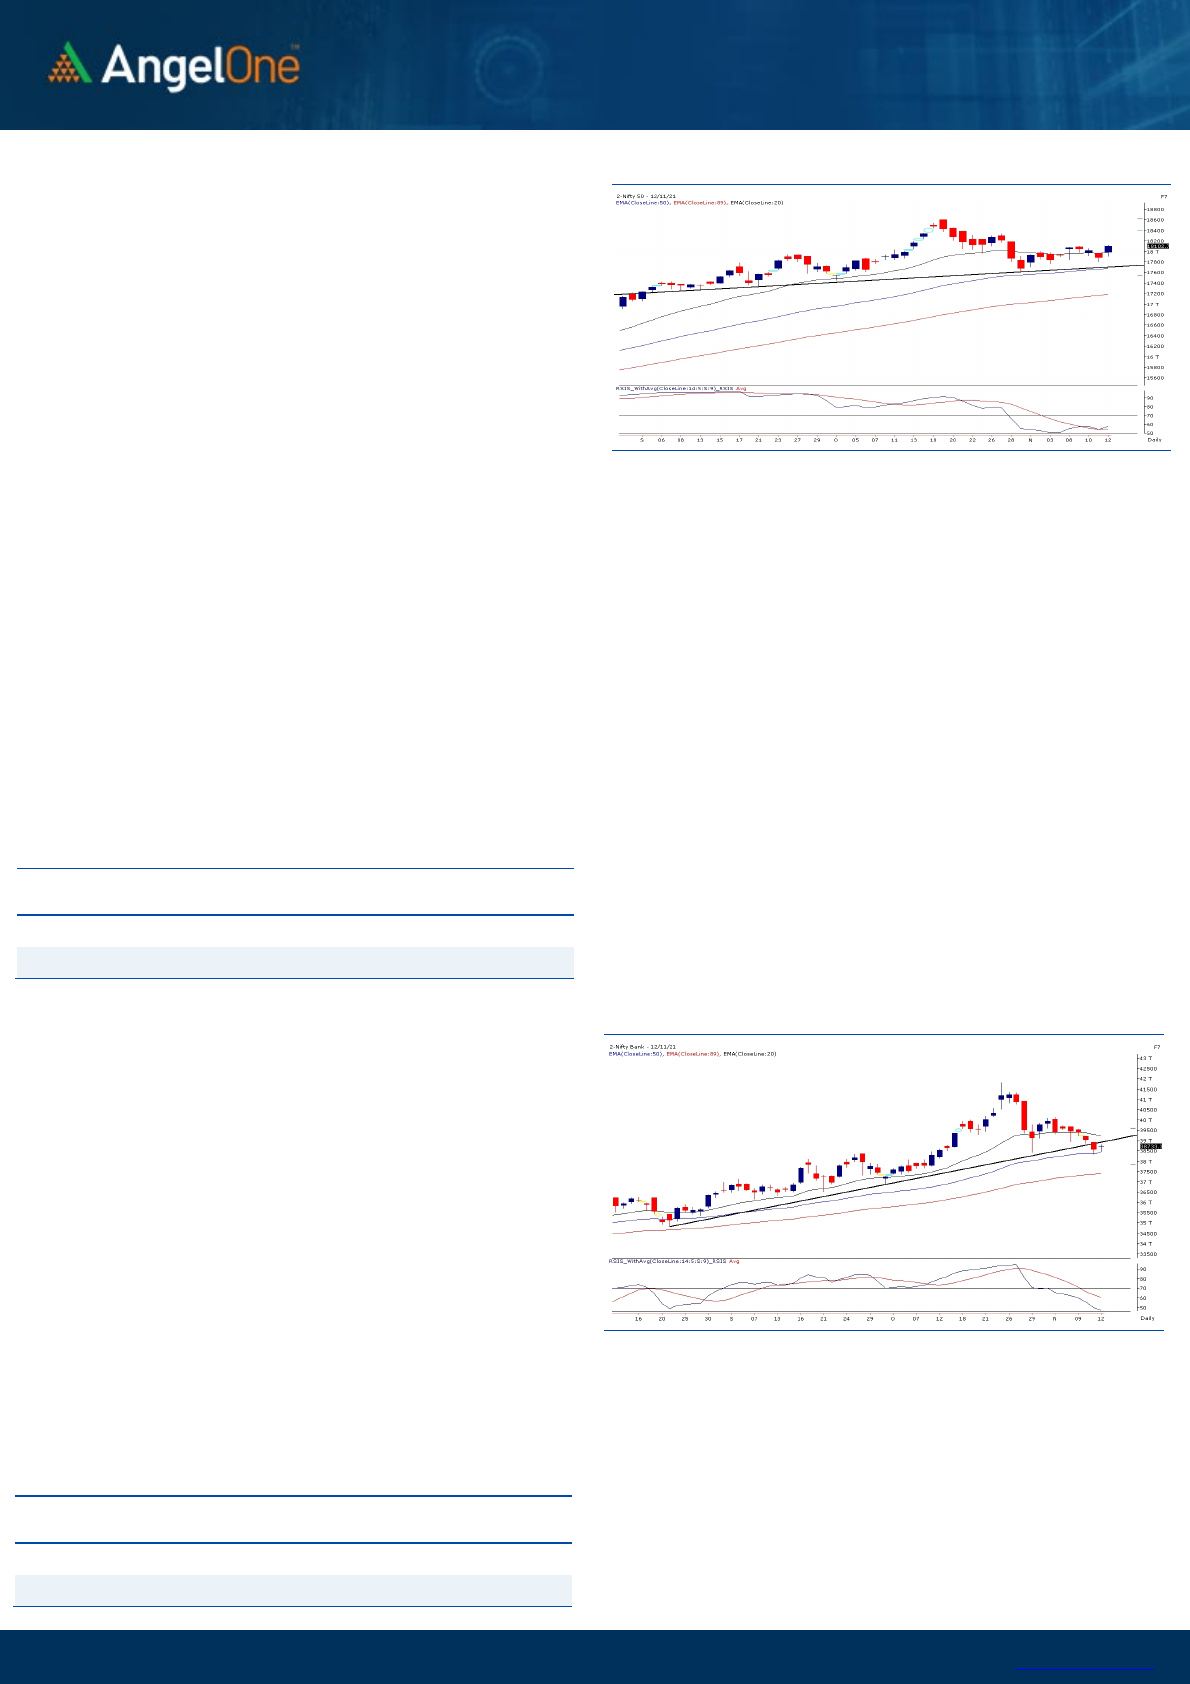
Sensex (60687) / Nifty (18103)
As compared to Thursday’s move, we witnessed a complete opposite
action on Friday as we witnessed a gap up opening first and then due
to sustained buying in some of the heavyweights, Nifty went on to
reclaim the 18100 mark at the close. Market seems to have trapped in
a range and during the last week although point wise we gyrated within
300 points, it’s hardly one and half a percent range for the Nifty. So we
would rather call it a consolidation in the range of 17800 – 18100. For
this week, 18200 – 18350 is to be seen as a crucial range and till the
time we do not surpass it convincingly, we are not completely out of
the woods yet. In fact, it would be too early to comment on it; but we
can clearly see a bearish formation of ‘Head and Shoulder’ being in
process on the daily chart of Nifty. The neckline support is around
17700 – 17600, which if gets broken, we could see difficult days for
market in the short run. With reference to our recent cautious stance
on the market, we will not be surprised to see it happening soon, if we
fail to go beyond the mentioned zone of 18200 – 18350 in the
forthcoming week.
The main reason for us to continue with the cautious stance is the
formation of ‘Shooting Star’ pattern on monthly chart. As long as we do
not break the high of the candle, it can prove its significance anytime.
Hence, we reiterate on avoiding aggressive longs and even if one wants
to follow stock specific moves, needs to be very selective.
Key Levels
Support 1 – 18000 Resistance 1 – 18200
Support 2 – 17900 Resistance 2 – 18350
Exhibit 1: Nifty Daily Chart
www.angelone.in
Technical &
Derivatives Report
November 15, 2021
View
Last week was full of action, as we began the week on a
cheerful note and saw sharp selling in the initial hour of
trade to plunge below 17850. Luckily, index recovered to
recoup all the losses on the same day and reclaimed
18100 on Tuesday early morning. However, index
witnessed some nervousness at the higher levels and
hence corrected below 17800 on Thursday. On Friday, we
had a strong opening and follow-up buying led weekly
closing tad above 18100 mark.
FIIs were net buyers in the cash market segment to the
tune of Rs. 511 crores. In index futures, they bought
worth Rs. 2103 crores with good amount of rise in open
interest indicating formation of long positions.
In F&O space, we hardly saw any relevant build-up in
Nifty; the recovery seen on Friday was mainly due to
short covering; whereas, banking index witnessed
decent open interest reduction. In options front, out the
money calls of 18300 and 18500 added meaningful
positions and in case of puts, 18000 puts added massive
positions. This has resulted highest open interest
addition shifting higher to 18000 put and 18500 call
options. Considering the options data, we would
advocate traders to trade with a positive bias until we
managed to sustain above 18000.
Comments
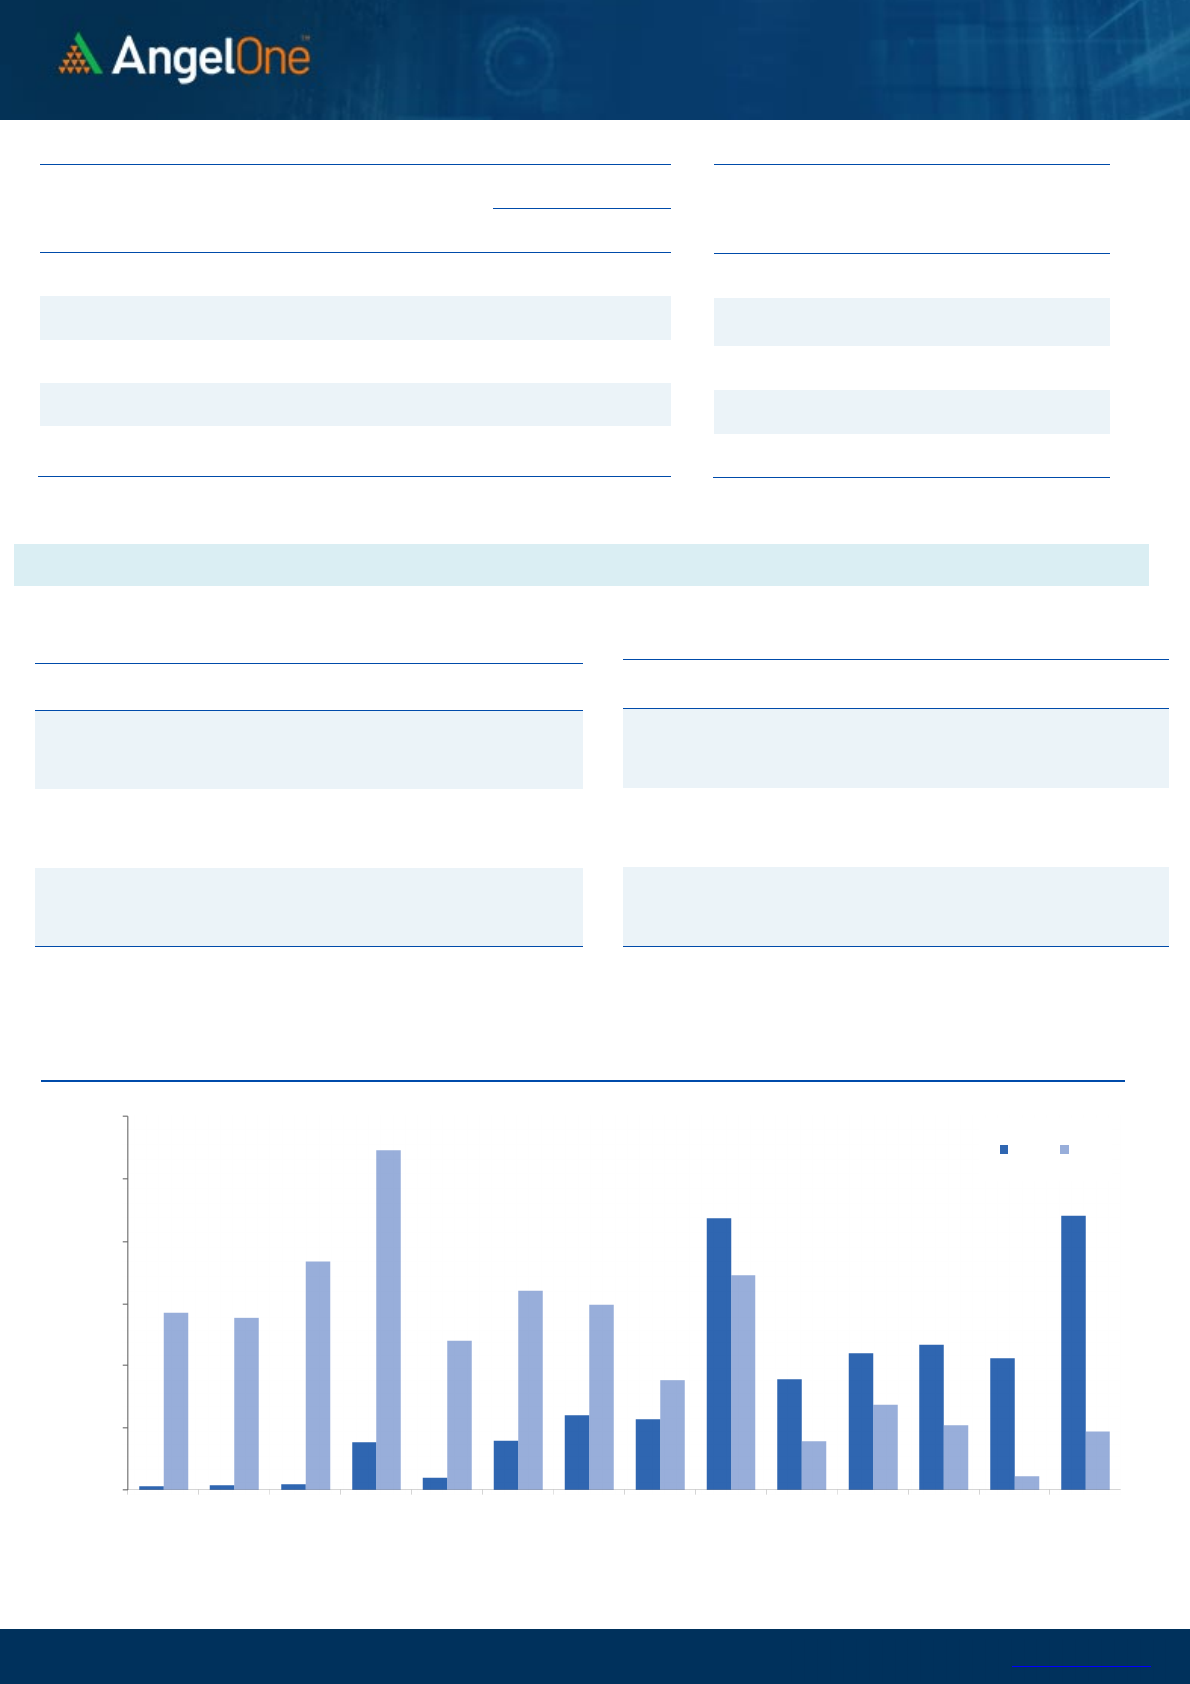
The Nifty futures open interest has decreased by 5.40%.
Bank Nifty futures open interest has decreased by 11.57%
as market closed at 18102.75 levels.
The Nifty November future closed with a premium of
30.70 point against a premium of 23.25 point in last
trading session. The December series closed at a
premium of 86.95 point.
The INDIA VIX decreased from 16.35 to 15.21. At the same
time, the PCR-OI of Nifty has increased from 0.83 to 1.16.
Few of the liquid counters where we have seen high cost
of carry are IDEA, BHEL, LICHSGFIN, ALKEM and PFIZER.
Nifty Vs OI
17200
17400
17600
17800
18000
18200
18400
18600
,0
2,000
4,000
6,000
8,000
10,000
12,000
14,000
16,000
10-13 10-18 10-20 10-22 10-26 10-28 11-1 11-3 11-5
(`000)
Openinterest Nifty
OI Gainers
SCRIP OI
OI
CHG. (%)
PRICE
PRICE
CHG. (%)
TORNTPHARM
770500 16.17 2791.30 -1.56
IPCALAB
2245500 14.79 2219.05 0.01
BAJAJ-AUTO
3079000 13.87 3635.20 -3.24
ALKEM
695400 13.00 3550.20 0.61
RECLTD
35454000 12.72 145.65 -2.80
NATIONALUM
115736000 11.30 101.45 1.92
INDIGO
3754000 8.00 2306.20 7.40
TATASTEEL
48216250 7.55 1287.25 -0.97
OI Losers
SCRIP OI
OI
CHG. (%)
PRICE
PRICE
CHG. (%)
BERGEPAINT
4374700 -10.37 794.50 1.81
NAUKRI
898250 -9.61 6406.35 4.21
PFC
45663000 -8.53 138.10 -1.81
TITAN
5360625 -8.08 2539.50 0.47
PAGEIND
94920 -7.73 40439.95 0.29
JUBLFOOD
1584875 -7.05 4003.75 2.60
HINDALCO
25621550 -7.00 468.55 3.05
HDFCLIFE
16907000 -6.18 720.60 2.57
Put-Call Ratio
SCRIP PCR-OI PCR-VOL
NIFTY
1.16 0.85
BANKNIFTY
0.70 0.86
RELIANCE
0.50 0.47
ICICIBANK
0.43 0.37
INFY
0.50 0.40
Historical Volatility
SCRIP HV
INDIGO
46.70
TECHM
38.78
ICICIPRULI
45.11
BAJAJ-AUTO
32.44
LTI
47.62
www.angelone.in
Technical &
Derivatives Report
November 15, 2021
Note: Above mentioned Bullish or Bearish Spreads in Nifty (November Series) are given as an information and not as a recommendation.
Nifty Spot = 1
8102.75
FII Statistics for November 12, 2021
Detail Buy
Net Contracts
Open Interest
Sell
Value
(in Cr.)
Change
INDEX
FUTURES
4825.22 2722.16 2103.06
166552 15367.54 10.98
INDEX
OPTIONS
312130.80 308828.70 3302.10
1470188 135530.78 (1.86)
297314.41
STOCK
FUTURES
14107.59 13226.72 880.87
1794874 135439.17 1.19
STOCK
OPTIONS
18348.10 18459.74 (111.64) 327157 25414.24 5.74
Total
349411.71
343237.32
6174.39
3758771
311751.73
0.74
43446.77
Turnover on November 12, 2021
Instrument
No. of
Contracts
Turnover
( in Cr. )
Change
(%)
Index Futures
282238 26220.20 -12.31
Index Options
38118332 3578483.92 -70.24
Stock Futures
852586 65136.46 11.05
Stock Options
3165109 245425.34 25.37
Total
4,24,18,265
3915265.92 -68.19
Bull-Call Spreads
Action Strike Price Risk Reward BEP
Buy
18100 193.60
51.30 48.70 18151.30
Sell
18200 142.30
Buy
18100 193.60
92.95 107.05 18192.95
Sell
18300 100.65
Buy
18200 142.30
41.65 58.35 18241.65
Sell
18300 100.65
Bear-Put Spreads
Action Strike Price Risk Reward BEP
Buy
18100 158.40
38.30 61.70 18061.70
Sell
18000 120.10
Buy
18100 158.40
69.00 131.00 18031.00
Sell
17900 89.40
Buy
18000 120.10
30.70 69.30 17969.30
Sell
17900 89.40
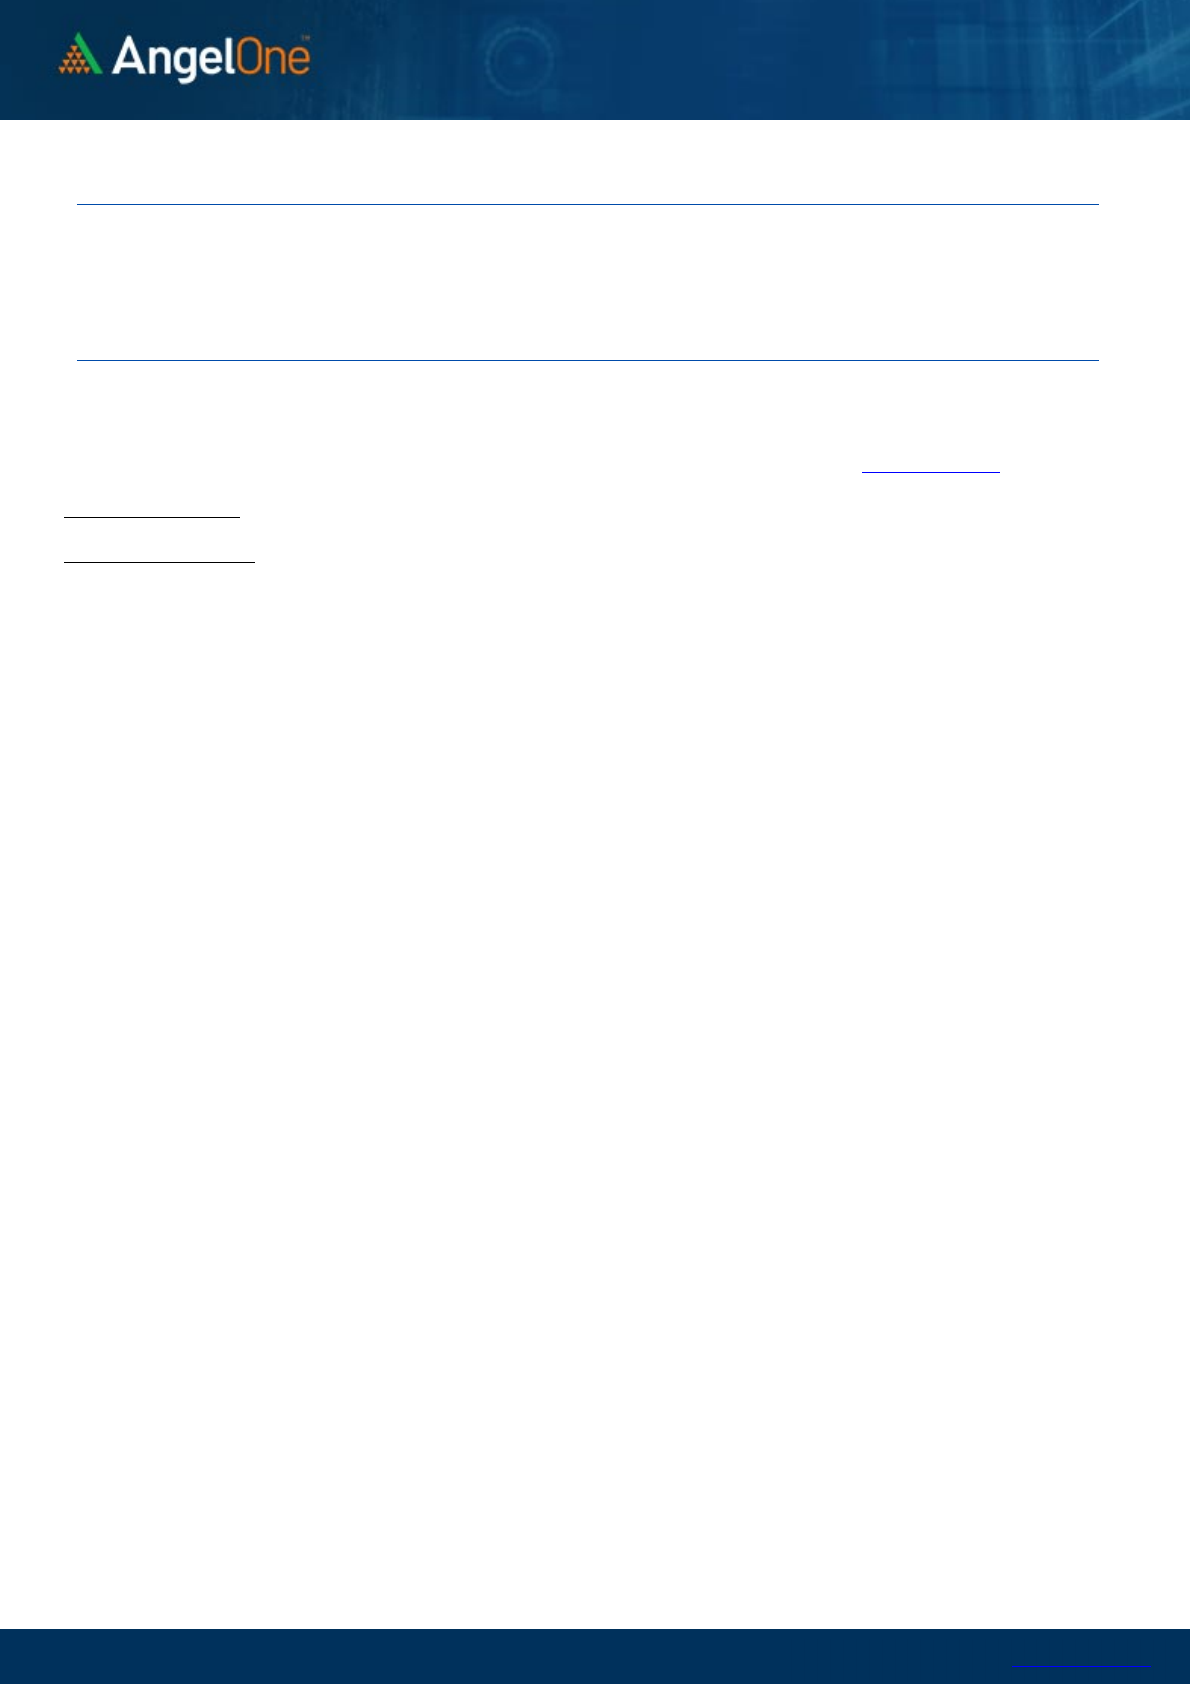
Nifty Put-Call Analysis
,0
500,000
1000,000
1500,000
2000,000
2500,000
3000,000
17200 17300 17400 17500 17600 17700 17800 17900 18000 18100 18200 18300 18400 18500
Call Put

www.angelone.in
Technical &
Derivatives Report
November 15, 2021
`
Daily Pivot Levels for Nifty Constituents
Scrips S2 S1 PIVOT R1 R2
ADANIPORTS 725 738
747 759 768
ASIANPAINT 3,057 3,090
3,109 3,142 3,161
AXISBANK 728 732
737 741 747
BAJAJ-AUTO 3,511 3,573
3,678 3,739 3,844
BAJFINANCE 7,397 7,488
7,544 7,635 7,691
BAJAJFINSV 17,759 18,016
18,183 18,440 18,607
BPCL 424 426
428 430 432
BHARTIARTL 718 731
738 751 758
BRITANNIA 3,616 3,652
3,677 3,713 3,738
CIPLA 901 908
913 920 925
COALINDIA 164 165
167 169 170
DIVISLAB 4,764 4,804
4,850 4,890 4,935
DRREDDY 4,788 4,816
4,843 4,871 4,898
EICHERMOT 2,677 2,700
2,721 2,744 2,764
GRASIM 1,826 1,842
1,859 1,875 1,891
HCLTECH 1,156 1,164
1,171 1,179 1,186
HDFCBANK 1,538 1,546
1,552 1,560 1,566
HDFCLIFE 699 710
716 727 733
HDFC 2,873 2,933
2,965 3,025 3,058
HEROMOTOCO 2,654 2,669
2,694 2,709 2,734
HINDALCO 454 462
466 473 478
HINDUNILVR 2,361 2,383
2,398 2,420 2,436
ICICIBANK 767 772
776 781 785
IOC 131 132
133 134 136
INDUSINDBK 1,021 1,029
1,036 1,044 1,051
INFY 1,722 1,751
1,767 1,796 1,812
ITC 227 230
232 235 237
JSW STEEL 658 665
670 677 683
KOTAKBANK 2,042 2,059
2,069 2,085 2,096
LT 1,914 1,937
1,951 1,974 1,988
M&M 920 929
934 943 949
MARUTI 7,387 7,433
7,489 7,535 7,591
NESTLEIND 18,689 18,916
19,088 19,314 19,486
NTPC 133 135
136 138 140
ONGC 152 153
155 156 157
POWERGRID 179 180
182 184 185
RELIANCE 2,541 2,567
2,583 2,609 2,625
SBILIFE 1,137 1,156
1,167 1,185 1,196
SHREECEM 28,596 28,992
29,266 29,663 29,936
SBIN 499 505
509 515 519
SUNPHARMA 791 799
804 811 816
TCS 3,467 3,496
3,515 3,545 3,564
TATACONSUM
834 841
847 854 860
TATAMOTORS 492 500
505 512 517
TATASTEEL 1,231 1,259
1,299 1,328 1,368
TECHM 1,510 1,548
1,569 1,606 1,627
TITAN 2,503 2,521
2,541 2,560 2,580
ULTRACEMCO 7,958 8,019
8,067 8,128 8,175
UPL 760 765
770 774 779
WIPRO 639 650
656 666 673
www.angelone.in
Technical &
Derivatives Report
November 15, 2021
*
Research Team Tel: 022 – 39357600 (Extn. 6844) Website: www.angelone.in
For Technical Queries E-mail: technicalresearch-cso@angelbroking.com
For Derivatives Queries E-mail: derivatives.desk@angelbroking.com
DISCLAIMER
Angel Broking Limited (hereinafter referred to as “Angel”) is a registered Member of National Stock Exchange of India Limited,
Bombay Stock Exchange Limited and Metropolitan Stock Exchange Limited. It is also registered as a Depository Participant with
CDSL and Portfolio Manager and Investment Adviser with SEBI. It also has registration with AMFI as a Mutual Fund Distributor. Angel
Broking Limited is a registered entity with SEBI for Research Analyst in terms of SEBI (Research Analyst) Regulations, 2014 vide
registration number INH000000164. Angel or its associates has not been debarred/ suspended by SEBI or any other regulatory
authority for accessing /dealing in securities Market. Angel or its associates/analyst has not received any compensation / managed
or co-managed public offering of securities of the company covered by Analyst during the past twelve months.
This document is solely for the personal information of the recipient, and must not be singularly used as the basis of any investment
decision. Nothing in this document should be construed as investment or financial advice. Each recipient of this document should
make such investigations as they deem necessary to arrive at an independent evaluation of an investment in the securities of the
companies referred to in this document (including the merits and risks involved), and should consult their own advisors to determine
the merits and risks of such an investment.
Reports based on technical and derivative analysis center on studying charts of a stock's price movement, outstanding positions and
trading volume, as opposed to focusing on a company's fundamentals and, as such, may not match with a report on a company's
fundamentals. Investors are advised to refer the Fundamental and Technical Research Reports available on our website to evaluate
the contrary view, if any.
The information in this document has been printed on the basis of publicly available information, internal data and other reliable
sources believed to be true, but we do not represent that it is accurate or complete and it should not be relied on as such, as this
document is for general guidance only. Angel Broking Limited or any of its affiliates/ group companies shall not be in any way
responsible for any loss or damage that may arise to any person from any inadvertent error in the information contained in this
report. Angel Broking Limited has not independently verified all the information contained within this document. Accordingly, we
cannot testify, nor make any representation or warranty, express or implied, to the accuracy, contents or data contained within this
document. While Angel Broking Limited endeavors to update on a reasonable basis the information discussed in this material, there
may be regulatory, compliance, or other reasons that prevent us from doing so.
This document is being supplied to you solely for your information, and its contents, information or data may not be reproduced,
redistributed or passed on, directly or indirectly.
Neither Angel Broking Limited, nor its directors, employees or affiliates shall be liable for any loss or damage that may arise from
or in connection with the use of this information.
Technical and Derivatives Team:
Sameet Chavan Chief Analyst – Technical & Derivatives sameet.chavan@angelone.in
Rajesh Bhosale Technical Analyst rajesh.bhosle@angelone.in
Sneha Seth Derivatives Analyst sneha.seth@angelone.in
