SEPT 15, 2022
www.angelone.in
Technical & Derivatives Report
xOOOOOOOO
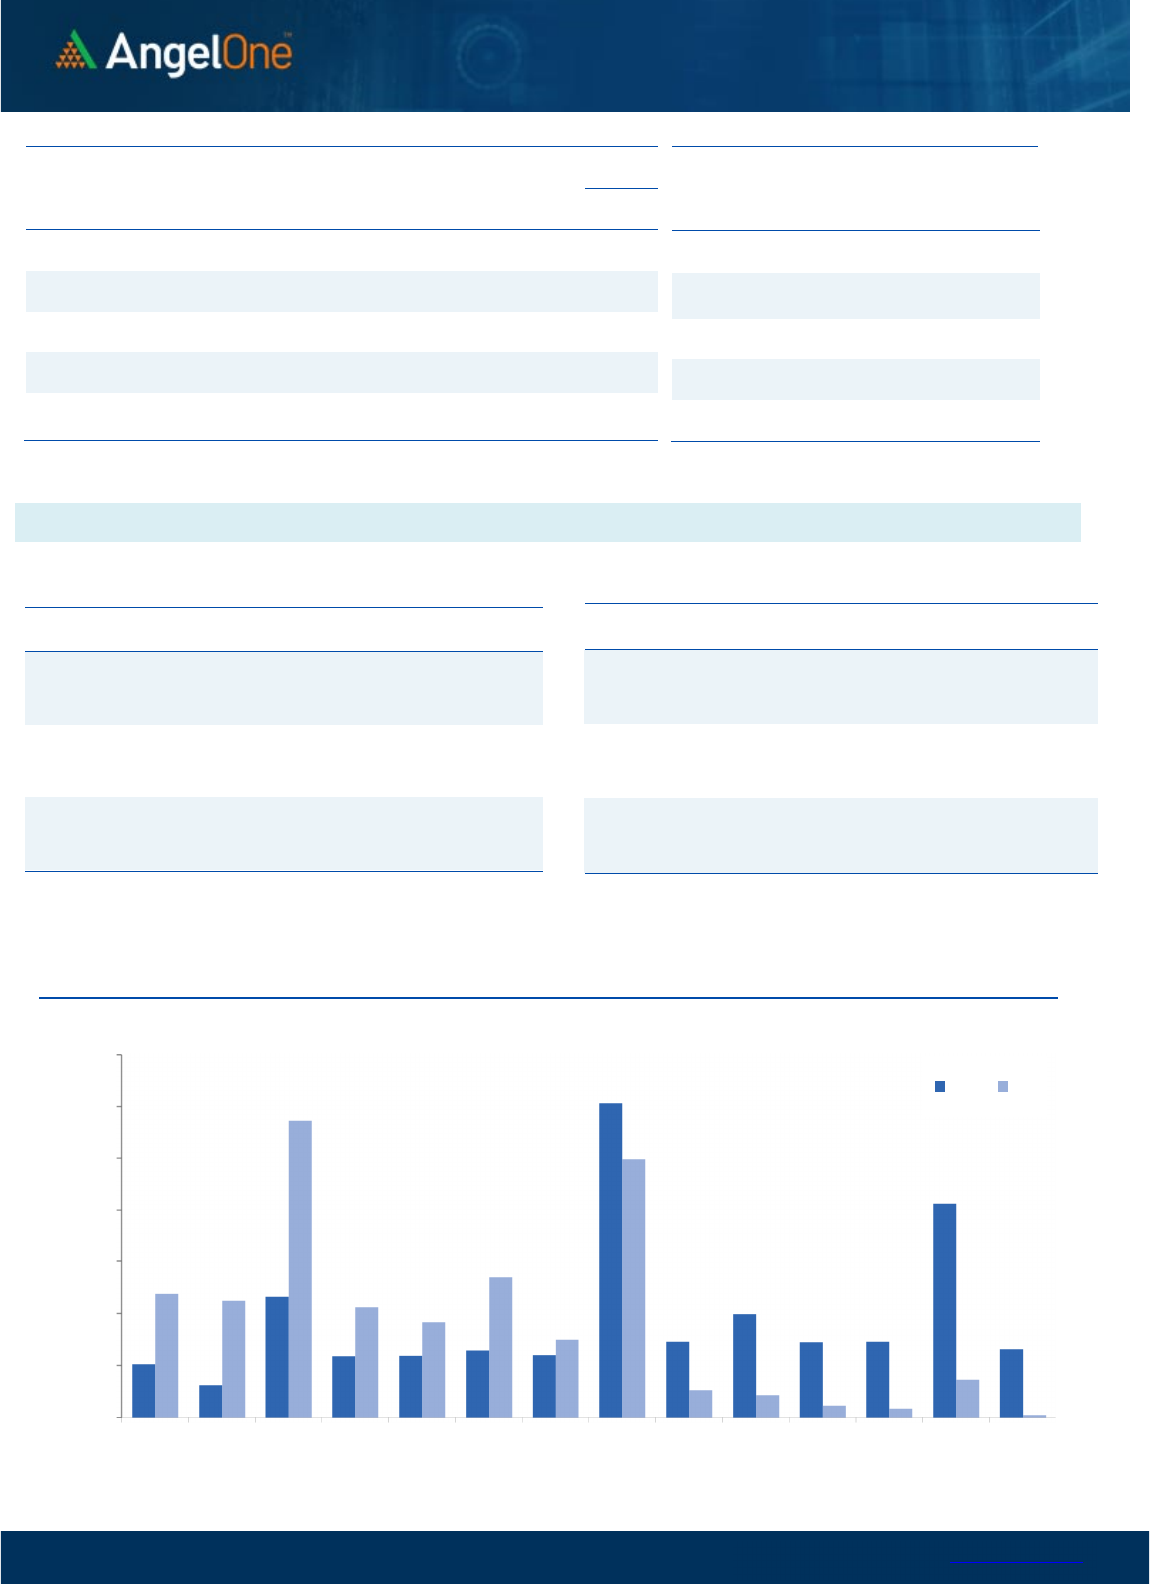
Nifty Bank Outlook (41405)
Bank Nifty as well started with a gap-down opening however
mighty bulls took this as an opportunity and right from the word
go the prices started moving higher. In this process, the bank
index not only recovered its lost ground of more than 500 points
but went on to add strong gains of 1.30% closing tad above
41400 levels. Things were looking extremely bleak at the
opening however the way we closed definitely indicates that
the bulls are in a dominating place and they are not willing to
give up so soon. The ongoing rally is mostly driven by the
banking space and yesterday as well it showed its mettle. We
have been advocating for the last few weeks that any dip should
be taken as a buying opportunity and we reiterate the same as
we see this space heading towards the all-time high levels and
beyond in the very near term. Yesterday many individual stocks
from this space gave a strong up move and one should ideally
focus on such counters for outperforming moves. As far as levels
for the bank index is concerned, immediate support is at 40900
- 40750 levels whereas resistance is at 41600 - 41830 levels.
Key Levels
Support 1 – 40900 Resistance 1 – 41600
Support 2 – 40750 Resistance 2 – 41830
Exhibit 1: Nifty
Daily
Chart
Exhibit 2: Nifty Bank
Daily
Chart
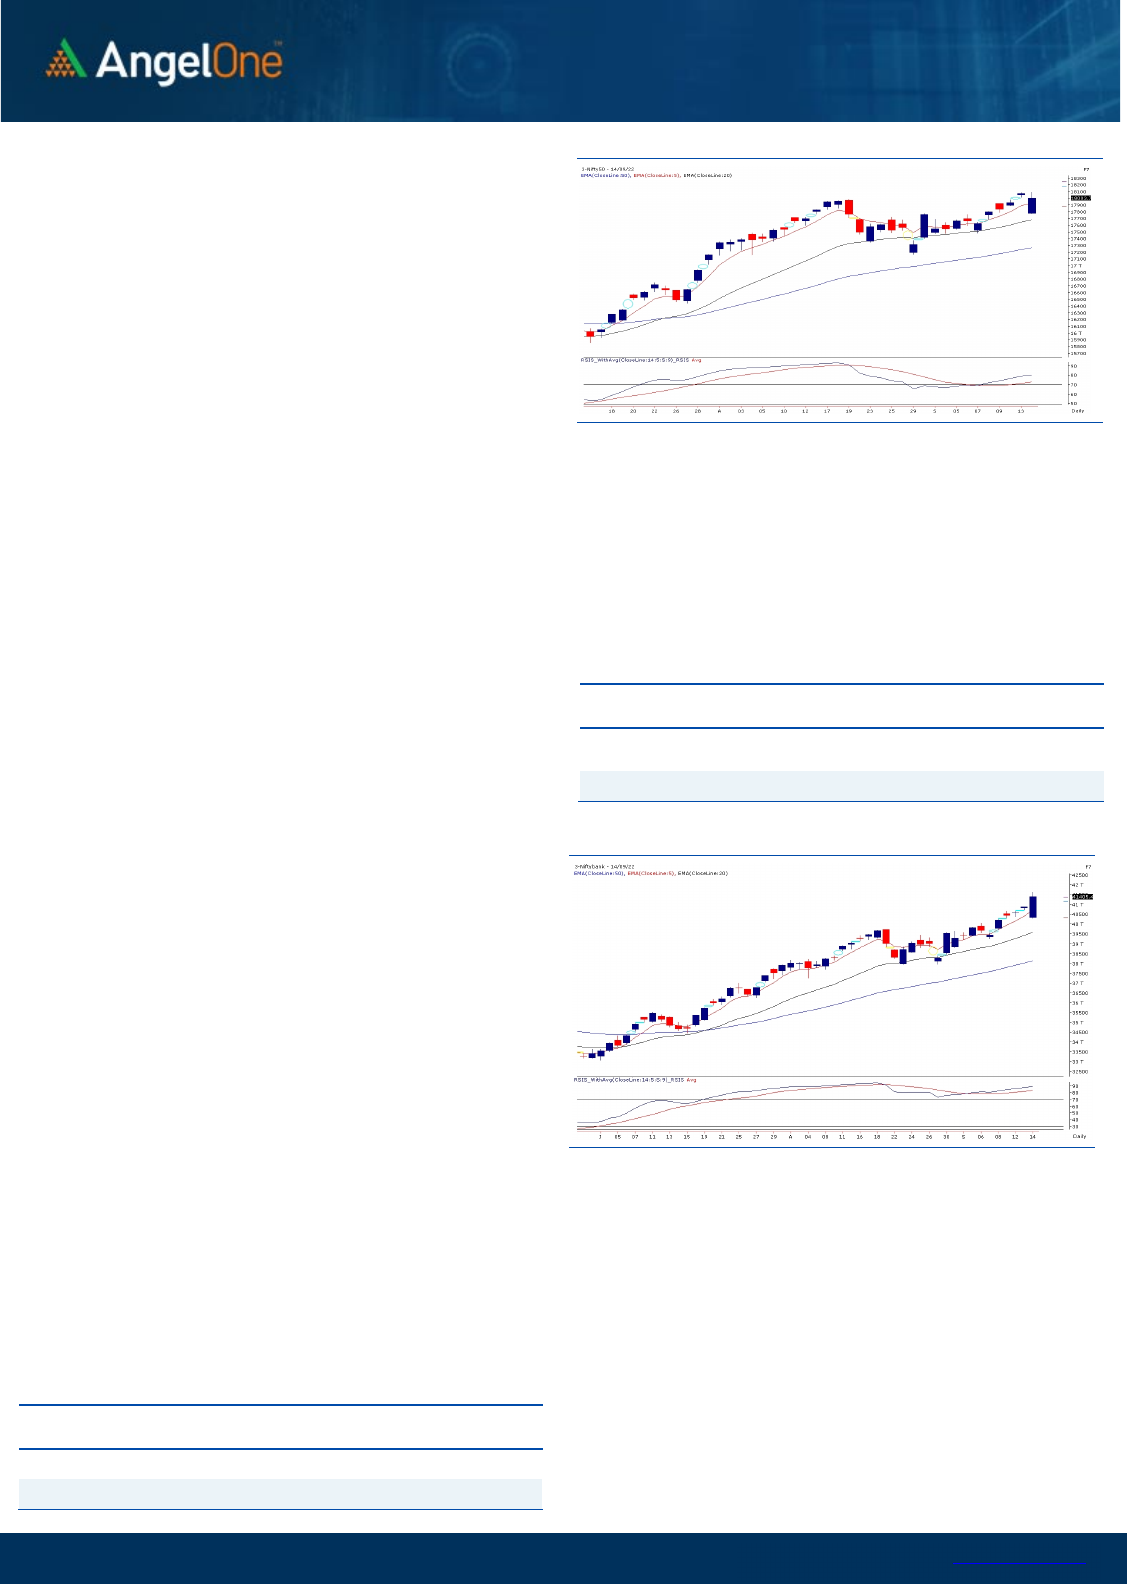
Sensex (60345) / Nifty (18004)
The way Nifty closed beyond 18000 on Tuesday, market
participants were a bit complacent and took US macro data for
granted. But US markets took a complete nosedive in the evening
post the rising inflation data. Due to this brutal knock, last 3-4
day’s gains in US markets went for a toss. Needless to say, we
reacted yesterday morning with a massive gap down towards
17800. However, after an opening blip, the banking came for a
rescue and then (except IT) others too started participating in the
recovery. In the process, we not only managed to pare down
significant portion of losses but also reclaimed the 18000 mark
on a closing basis.
Yesterday’s session has clearly validated the level of strength our
domestic market has as compared to the global peers. Despite
such unfavourable environment, we remained firm and
managed to pull the market higher back into the safe terrain.
Now unless there is major aberration on the global front, we are
good to test 18200 - 18350 first and then record highs. On the
flipside, 17900 - 17800 now becomes a sacrosanct zone. This rally
is strongly back by the financial space and hence, it provides
credence to the move.
With reference to our commentary on Monday, the
BANKNIFTY is within a touching distance of previous highs and
is likely to make new one before Nifty does. Also, the stock
specific on the bullish side kept on accelerating as the day
progressed which again is an indication of overall breadth.
Traders are advised not to get carried away by such in
between hiccups and continue to focus on stock specific
moves.
Key Levels
Support 1 – 17900 Resistance 1 – 18100
Support 2 – 17800 Resistance 2 – 18240

www.angelone.in
Technical & Derivatives Report
SEPT 15, 2022
View
Our market has witnessed a gap down opening,
tracking weakness in global bourses. However, the
bulls got aggravated at the lower zone, resulting in a
modest recovery in the benchmark index that settled
above the 18000 mark with a mere cut of 0.37 percent.
FIIs were net sellers in the cash market segment to
the tune of Rs. 1397 crores. Simultaneously, in Index
futures, they sold worth Rs. 2030 crores with an
increase in open interest, indicating short formation.
Looking at the overall F&O data, we have witnessed
mixed positions in both indices. On the options front,
piling up of positions is visible in the 17900-17800 put
strikes, indicating a nearby support zone. While on the
higher end, the 18200 call strike has a decent piling in
the OI concentration, indicating an immediate
resistance. The stronger hands have contracted their
‘Long Short Ratio’, which plunged to 28% from 35%.
Considering the recent price action, the undertone is
likely to remain bullish, and any intraday dip could be
seen as an opportunity to add longs in the indices.
Meanwhile, we advocate keeping a close tab on global
developments and looking for opportunities in the
broader market.
Comments
The Nifty futures open interest has decreased by
0.96%. and Bank Nifty futures open interest has
increased by 7.72% as the market closed at 18003.75.
The Nifty Sep future closed with a premium of 16.65
point against a premium of 35.45 point in the last
trading session. The Oct series closed at a premium
of 69.70 point.
The INDIA VIX increased from 17.47 to 18.27. At the
same time, the PCR-OI of Nifty has decreased from
1.39 to 1.20.
Few of the liquid counters where we have seen high
cost of carry are AMBUJACEM, ACC, VEDL,
INDIACEM and INFY.
Historical Volatility
SCRIP HV
IDEA 81.74
RBLBANK 72.87
IBULHSGFIN 72.78
ZEEL 64.13
HINDCOPPER 62.95
Nifty Vs OI
17300
17400
17500
17600
17700
17800
17900
18000
18100
18200
8,000
9,000
10,000
11,000
12,000
13,000
14,000
15,000
16,000
17,000
18,000
8/25 9/1 9/5 9/7 9/9 9/13
Openinterest Nifty
OI
Gainers
SCRIP OI
OI
CHG. (%)
PRICE
PRICE
CHG. (%)
ACC 5508000 23.23 2743.20 6.69
INFY 43181700 21.07 1475.40 -4.66
BEL 30707800 20.20 335.90 0.24
LTTS 999000 15.84 3676.95 -4.49
HONAUT 13545 15.03 42616.60 2.81
TATACONSUM 9202500 13.02 840.25 -1.15
RBLBANK 70550000 11.70 133.25 3.00
COFORGE 927000 10.34 3471.05 -4.09
OI Losers
SCRIP OI
OI
CHG. (%)
PRICE
PRICE
CHG. (%)
PVR 2957669 -9.76 1929.35 1.18
IBULHSGFIN 43708000 -7.77 138.10 2.28
CUB 7765000 -7.61 185.25 2.63
BAJAJFINSV 9331500 -6.69 1805.40 0.82
AMBUJACEM 67759200 -6.07 524.60 7.85
JUBLFOOD 10511250 -5.93 635.30 1.73
ESCORTS 1742950 -5.49 2002.30 0.74
TRENT 4368125 -5.28 1430.65 -1.97
Put-Call Ratio
SCRIP PCR (OI) PCR (VOL)
NIFTY 1.20 0.83
BANKNIFTY 1.46 0.85
RELIANCE 0.54 0.42
ICICIBANK 0.90 0.54
INFY 0.35 0.43
www.angelone.in
Technical & Derivatives Report
SEPT 15, 2022
Note: Above mentioned Bullish or Bearish Spreads in Nifty (Sep Series) are given as an information and not as a recommendation.
Nifty Spot =
1
8
,
0
03
.
7
5
FII Statistics for
September
1
4
, 2022
Detail Buy
Contracts
Open
Interest
Value
(in Cr.)
Sell
Net
CHANGE
INDEX
FUTURES
3842.37 5872.52 (2030.15) 128069 12148.68 10.88
INDEX
OPTIONS
1223196.67 1222215.36 981.31
1406466 132978.10 3.30
STOCK
FUTURES
13145.14 14885.68 (1740.54) 2138425 153043.53 2.24
STOCK
OPTIONS
11589.00 11768.19 (179.19) 190405 13923.47 5.77
Total 1251773.18
1254741.75
(2968.57) 3863365
312093.78
3.06
Turnover on
September
1
4
, 2022
Instrument
No. of
Contracts
Turnover
( in Cr. )
Change
(%)
Index
Futures
519052 49879.80 111.07
Index
Options
166785108
16317833.62
113.05
Stock
Futures
1103592 78832.94 27.35
Stock
Options
4531028 340657.22 29.52
Total
45,31,028
340657.22 109.64
Bull-Call Spreads
Action Strike Price Risk Reward BEP
Buy
17900 317.55
57.45
42.55
17957.45
Sell
18000 260.10
Buy
17900 317.55
109.50
90.50
18009.50
Sell
18100 208.05
Buy
18000 260.10
52.05 47.95 18052.05
Sell 18100 208.05
Bear
-
Put Spreads
Action Strike Price Risk Reward BEP
Buy 17900 199.25
34.10
65.90
17865.90
Sell
17800 165.15
Buy 17900 199.25
65.05
134.95
17834.95
Sell 17700 134.20
Buy
17800 165.15
30.95 69.05 17769.05
Sell 17700 134.20
Nifty Put
-
Call Analysis
,0
500,000
1000,000
1500,000
2000,000
2500,000
3000,000
3500,000
17300 17400 17500 17600 17700 17800 17900 18000 18100 18200 18300 18400 18500 18600
Call Put

www.angelone.in
Technical & Derivatives Report
SEPT 15, 2022
`
Daily Pivot Levels for Nifty Constituents
Scrips
S2
S1
PIVOT
R1 R2
ADANIPORTS 929 938
949
958
968
APOLLOHOSP 4,363 4,395
4,438
4,470
4,512
ASIANPAINT 3,354 3,396
3,422 3,465
3,491
AXISBANK
786
795
803
811
820
BAJAJ-AUTO 3,753 3,802
3,860 3,909 3,968
BAJFINANCE 7,151 7,317
7,439 7,605
7,726
BAJAJFINSV
1,729
1,767
1,790
1,829
1,852
BPCL
332
334
337
340
343
BHARTIARTL 770 777
783
789
795
BRITANNIA 3,685 3,716
3,739
3,770
3,793
CIPLA
1,028
1,044
1,056
1,072
1,084
COALINDIA
228
230
232
234
236
DIVISLAB
3,571
3,620
3,654 3,703 3,738
DRREDDY 4,117 4,166
4,214
4,263
4,311
EICHERMOT 3,407 3,475
3,519
3,587
3,631
GRASIM
1,747
1,765
1,782
1,800
1,817
HCLTECH
920
926
932
938
944
HDFCBANK
1,473
1,501
1,520
1,548
1,567
HDFCLIFE
568
572
579
583
590
HDFC
2,363
2,408
2,443 2,489 2,524
HEROMOTOCO 2,811 2,831
2,850 2,871 2,890
HINDALCO 414 428
438
452
462
HINDUNILVR
2,515
2,543
2,575 2,603 2,634
ICICIBANK
889
903
913
928
937
INDUSINDBK
1,112
1,164
1,194
1,246
1,277
INFY
1,455
1,465
1,482
1,492
1,509
ITC 327 331
335
339
343
JSW STEEL 672 683
692
702
712
KOTAKBANK
1,856
1,905
1,942
1,991
2,027
LT
1,935
1,945
1,959
1,968
1,982
M&M
1,263
1,281
1,297
1,315
1,331
MARUTI 8,757 8,862
8,931
9,036
9,105
NESTLEIND
18,708
18,908
19,071
19,272
19,435
NTPC
162
167
170
175
178
ONGC
131
132
133
134 135
POWERGRID 222 227
230
236
239
RELIANCE 2,553 2,571
2,590 2,608 2,628
SBILIFE
1,288
1,296
1,308
1,316
1,328
SHREECEM
23,185
23,658
23,978 24,452 24,772
SBIN
540
556
565
581
591
SUNPHARMA
870
877
887
894
905
TCS 3,098 3,109
3,125
3,137
3,153
TATACONSUM
824
832
847
855
869
TATAMOTORS
443
447
451 454
458
TATASTEEL 104 107
108 111
113
TECHM
1,084
1,099
1,111
1,126
1,137
TITAN
2,619
2,660
2,686
2,727
2,753
ULTRACEMCO
6,662
6,769
6,867
6,973
7,071
UPL
734
741
751
758
767
WIPRO
402
409
416 423
430

www.angelone.in
Technical & Derivatives Report
SEPT 15, 2022
*
Technical and Derivatives Team:
Sameet Chavan Chief Analyst – Technical & Derivatives sameet.chavan@angelone.in
Sneha Seth Senior Analyst – Technical & Derivatives sneha.seth@angelone.in
Rajesh Bhosale Technical Analyst rajesh.bhosle@angelone.in
Osho Krishan Senior Analyst – Technical & Derivatives osho.krishan@angelone.in
Research Team Tel: 022 – 39357600 Website: www.angelone.in
For Technical Queries E-mail: technicalresearch-cso@angelone.in
For Derivatives Queries E-mail: derivatives.desk@angelone.in
DISCLAIMER
Angel One Limited (hereinafter referred to as “Angel”) is a registered Member of National Stock Exchange of India Limited, Bombay
Stock Exchange Limited and Metropolitan Stock Exchange Limited. It is also registered as a Depository Participant with CDSL and
Portfolio Manager and investment advisor with SEBI. It also has registration with AMFI as a Mutual Fund Distributor. Angel One
Limited is a registered entity with SEBI for Research Analyst in terms of SEBI (Research Analyst) Regulations, 2014 vide registration
number INH000000164. Angel or its associates has not been debarred/ suspended by SEBI or any other regulatory authority for
accessing /dealing in securities Market.
This document is solely for the personal information of the recipient, and must not be singularly used as the basis of any investment
decision. Nothing in this document should be construed as investment or financial advice. Each recipient of this document should
make such investigations as they deem necessary to arrive at an independent evaluation of an investment in the securities of the
companies referred to in this document (including the merits and risks involved), and should consult their own advisors to determine
the merits and risks of such an investment.
Angel or its associates or research analyst or his relative may have actual/beneficial ownership of 1% or more in the securities of
the subject company at the end of the month immediately preceding the date of publication of the research report. Neither Angel or
its associates nor Research Analysts or his relative has any material conflict of interest at the time of publication of research report.
Angel or its associates might have received any compensation from the companies mentioned in the report during the period
preceding twelve months from the date of this report for services in respect of managing or co-managing public offerings, corporate
finance, investment banking or merchant banking, brokerage services or other advisory service in a merger or specific transaction
in the normal course of business. Angel or its associates did not receive any compensation or other benefits from the companies
mentioned in the report or third party in connection with the research report. Neither Angel nor its research analyst entity has been
engaged in market making activity for the subject company.
Reports based on technical and derivative analysis center on studying charts of a stock's price movement, outstanding positions and
trading volume, as opposed to focusing on a company's fundamentals and, as such, may not match with a report on a company's
fundamentals. Investors are advised to refer the Fundamental and Technical Research Reports available on our website to evaluate
the contrary view, if any.
The information in this document has been printed on the basis of publicly available information, internal data and other reliable
sources believed to be true, but we do not represent that it is accurate or complete and it should not be relied on as such, as this
document is for general guidance only. Angel One Limited or any of its affiliates/ group companies shall not be in any way responsible
for any loss or damage that may arise to any person from any inadvertent error in the information contained in this report. Angel One
Limited has not independently verified all the information contained within this document. Accordingly, we cannot testify, nor make
any representation or warranty, express or implied, to the accuracy, contents or data contained within this document. While Angel
One Limited endeavors to update on a reasonable basis the information discussed in this material, there may be regulatory,
compliance, or other reasons that prevent us from doing so.
This document is being supplied to you solely for your information, and its contents, information or data may not be reproduced,
redistributed or passed on, directly or indirectly.
Neither Angel One Limited, nor its directors, employees or affiliates shall be liable for any loss or damage that may arise from or in
connection with the use of this information. Angel or its associates or Research Analyst or his relative might have financial interest
in the subject company. Research analyst has not served as an officer, director or employee of the subject company.
