SEPT 14, 2022
www.angelone.in
Technical & Derivatives Report
xOOOOOOOO
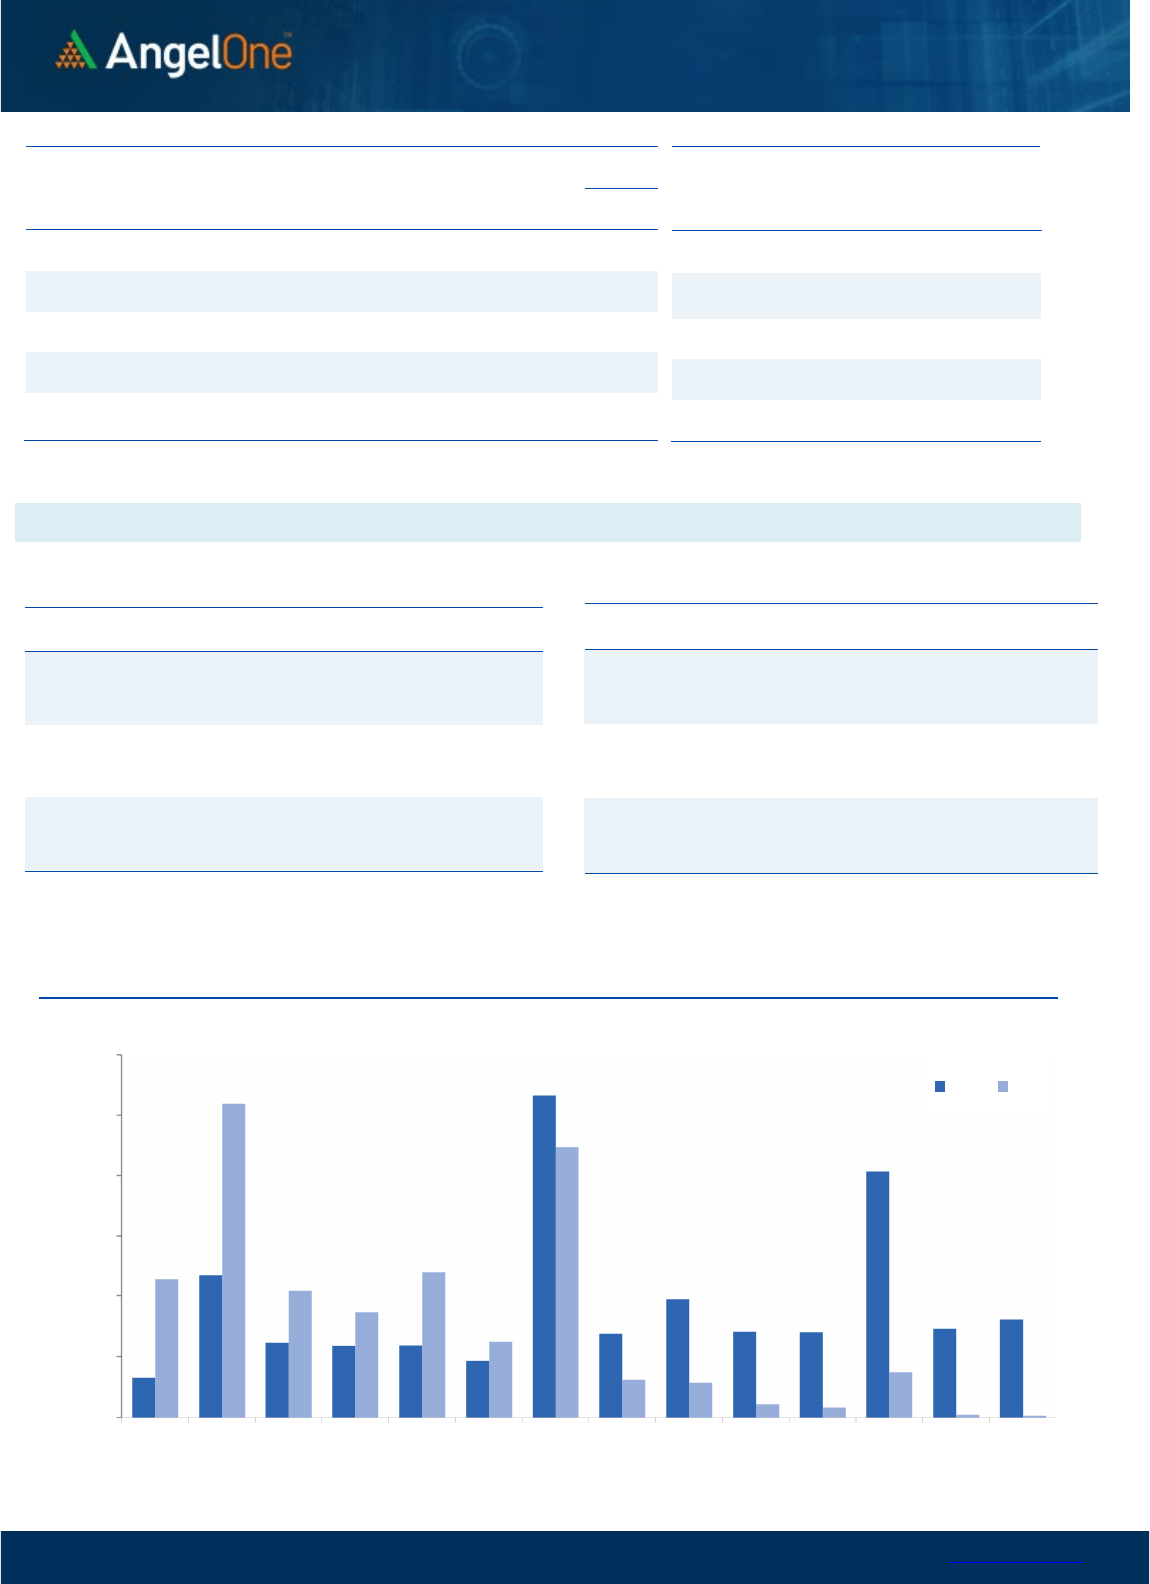
Nifty Bank Outlook (40873)
Once again, the Bank Index started on a positive note however
there was no major traction after opening gains. Eventually,
after trading in a slender range the bank index ended with gains
of 0.74% at 40873.
The bulls continue with their bull run as for the fourth
consecutive session markets ended higher however if we
consider the index-specific action then there's no major action
for the intraday traders. The major action continues outside the
Index as individual stocks continue to give mesmerizing moves.
Traders are hence advised to focus on such outperforming
opportunities. We expect the bank index to move towards all-
time high levels and hence one should avoid contra bets and
rather any dip should be considered as a buying opportunity. As
mentioned above, we are likely to see a gap down opening in
such scenario, immediate support is seen at 40250 - 40000
whereas resistance is at 40600 - 40800 levels.
Key Levels
Support 1 – 40250 Resistance 1 – 40600
Support 2 – 40000 Resistance 2 – 40800
Exhibit 1: Nifty
Daily
Chart
Exhibit 2: Nifty Bank
Daily
Chart
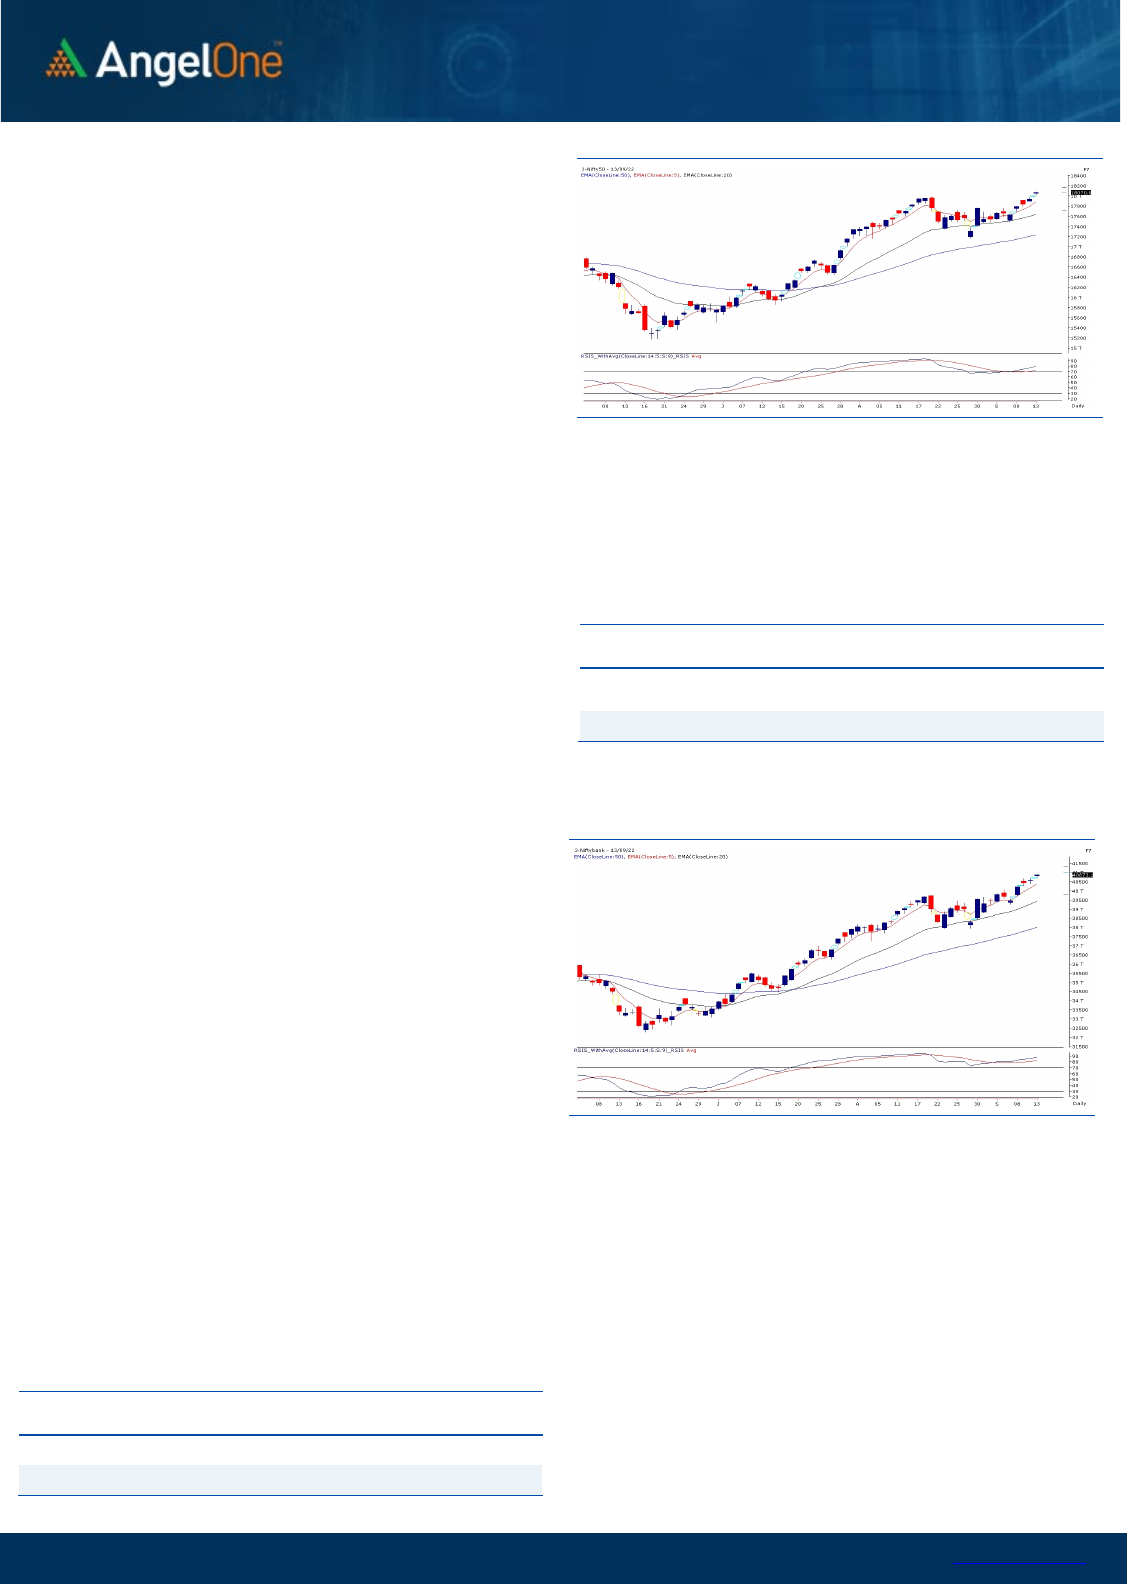
Sensex (60571) / Nifty (18070)
The global set up was positive yesterday morning and as a result,
the Nifty started the session with a decent gap above the
psychological mark of 18000. However, the follow up buying was
clearly missing like the previous session in most of the
heavyweight index movers. In fact, the range shrunk to merely
30 points during the latter half. Eventually, the Nifty concluded
the session convincingly above 18000, first time in last seven
months.
Nifty surpassing 18000 this time wasn’t a surprise, because the
way our market behaved in last week or so, things were pretty
evident. Additionally, the global markets have been supportive
since last 4 – 5 days, which provided the much needed push.
Now, heavyweight constituents seem to have slipped into a
consolidation mode and hence, we are not seeing the follow the
momentum in key indices. However, market is not at all short of
any action if we take a glance at the broader market. We
reiterate that one can continue to remain bullish and focus more
on stock specific movements, which are likely to provide better
trading opportunities.
The SGX Nifty is indicating a big gap down opening and we are
likely to start around the strong support levels at 17800 -
17700 levels. In the recent past, it has been observed of such
openings getting bought into, and hence it would be crucial to
see how our markets react post the opening. On the flip side,
18000 - 18100 will be seen as immediate resistance.
Key Levels
Support 1 – 17800 Resistance 1 – 18000
Support 2 – 17700 Resistance 2 – 18100

www.angelone.in
Technical & Derivatives Report
SEPT 14, 2022
View
Our market has witnessed a gap up opening amid
favorable global bourses, wherein the benchmark
index Nifty50 saw a decisive closure above the
psychological mark of 18000 with gains of 0.75%.
FIIs were net buyers in the cash market segment to
the tune of Rs. 1957 crores. Simultaneously, in Index
futures, they bought worth Rs. 2936 crores with a
decrease in open interest, indicating short covering.
Looking at the overall F&O data, we have witnessed a
long formation in the banking index while a short
covering rally in the benchmark index. On the options
front, piling up of positions is visible in the 18000-17900
put strikes, indicating a shift in the support base. While
on the higher end, the 18200 call strike has a decent
piling in the OI concentration. Considering the recent
price action, the undertone is likely to remain bullish,
and any intraday dip could be seen as an opportunity
to add longs in the indices. Meanwhile, we advocate
keeping a close tab on global developments and
looking for opportunities in the broader market.
Comments
The Nifty futures open interest has decreased by
1.31%. and Bank Nifty futures open interest has
increased by 4.00% as the market closed at 18070.05.
The Nifty Sep future closed with a premium of 35.45
point against a premium of 28.00 point in the last
trading session. The Oct series closed at a premium
of 85.25 point.
The INDIA VIX decreased from 17.93 to 17.47. At the
same time, the PCR-OI of Nifty has increased from
1.18 to 1.39.
Few of the liquid counters where we have seen high
cost of carry are TRENT, BAJAJFINSV, SIEMENS, ACC
and BRITANNIA.
Historical Volatility
SCRIP HV
IDEA 81.92
RBLBANK 72.95
IBULHSGFIN 72.90
ZEEL 64.19
HINDCOPPER 63.10
Nifty Vs OI
17300
17400
17500
17600
17700
17800
17900
18000
18100
18200
8,000
9,000
10,000
11,000
12,000
13,000
14,000
15,000
16,000
17,000
18,000
8/24 8/30 9/2 9/6 9/8 9/12
Openinterest Nifty
OI
Gainers
SCRIP OI
OI
CHG. (%)
PRICE
PRICE
CHG. (%)
ABBOTINDIA 62360 14.80 17920.70 -1.41
POLYCAB 942600 11.97 2638.50 3.38
MFSL 2237950 11.50 795.75 1.05
VOLTAS 6091500 10.51 970.15 0.26
LALPATHLAB 1634000 9.02 2434.70 -2.52
JKCEMENT 423250 8.87 2858.05 0.15
SUNTV 11745000 8.15 531.65 2.16
CROMPTON 4282500 7.98 412.40 -2.17
OI Losers
SCRIP OI
OI
CHG. (%)
PRICE
PRICE
CHG. (%)
AARTIIND 2955450 -8.23 894.55 0.41
LTTS 862400 -7.74 3840.60 0.54
NAVINFLUOR 581850 -7.64 4719.05 1.21
CUB 8405000 -6.25 181.65 -0.66
IBULHSGFIN 47392000 -5.52 135.75 0.67
AXISBANK 41065200 -5.22 805.55 0.55
AMBUJACEM 72135000 -5.22 486.50 2.29
AUBANK 6289000 -5.09 674.80 2.05
Put-Call Ratio
SCRIP PCR (OI) PCR (VOL)
NIFTY 1.39 0.95
BANKNIFTY 1.20 0.96
RELIANCE 0.58 0.40
ICICIBANK 0.79 0.83
INFY 0.45 0.40
www.angelone.in
Technical & Derivatives Report
SEPT 14, 2022
Note: Above mentioned Bullish or Bearish Spreads in Nifty (Sep Series) are given as an information and not as a recommendation.
Nifty Spot =
1
8
,
070
.
0
5
FII Statistics for
September
1
3
, 2022
Detail Buy
Contracts
Open
Interest
Value
(in Cr.)
Sell
Net
CHANGE
INDEX
FUTURES
4745.03 1808.78 2936.25
115503 10999.38 (13.88)
INDEX
OPTIONS
179808.29 182042.55 (2234.26) 1361515 127607.14 (0.16)
STOCK
FUTURES
10816.17 12060.88 (1244.71) 2091527 150517.76 (0.63)
STOCK
OPTIONS
6969.77 7168.59 (198.82) 180024 13243.22 5.26
Total 202339.26
203080.80
(741.54) 3748569
302367.50
(0.67)
Turnover on
September
1
3
, 2022
Instrument
No. of
Contracts
Turnover
( in Cr. )
Change
(%)
Index
Futures
248149 23631.96 -0.94
Index
Options
83437223
7659192.60 21.88
Stock
Futures
818662 61902.63 6.06
Stock
Options
3332189 263023.77 11.42
Total
33,32,189 263023.77 21.28
Bull-Call Spreads
Action Strike Price Risk Reward BEP
Buy
18000 296.15
57.70
42.30
18057.70
Sell
18100 238.45
Buy
18000 296.15
110.10
89.90
18110.10
Sell
18200 186.05
Buy
18100 238.45
52.40 47.60 18152.40
Sell 18200 186.05
Bear
-
Put Spreads
Action Strike Price Risk Reward BEP
Buy 18000 193.25
34.90
65.10
17965.10
Sell
17900 158.35
Buy 18000 193.25
63.55
136.45
17936.45
Sell 17800 129.70
Buy
17900 158.35
28.65 71.35 17871.35
Sell 17800 129.70
Nifty Put
-
Call Analysis
,0
500,000
1000,000
1500,000
2000,000
2500,000
3000,000
17400 17500 17600 17700 17800 17900 18000 18100 18200 18300 18400 18500 18600 18700
Call Put

www.angelone.in
Technical & Derivatives Report
SEPT 14, 2022
`
Daily Pivot Levels for Nifty Constituents
Scrips
S2
S1
PIVOT
R1 R2
ADANIPORTS
924
937
945
957
966
APOLLOHOSP 4,438 4,464
4,492
4,518
4,546
ASIANPAINT 3,388 3,405
3,432 3,449 3,476
AXISBANK
800
803
806
809 812
BAJAJ-AUTO 3,836 3,851
3,871
3,886 3,906
BAJFINANCE 7,255 7,329
7,387
7,461
7,518
BAJAJFINSV
1,699
1,742
1,793
1,836
1,887
BPCL 337 339
342
344
348
BHARTIARTL 762 773
781 792
800
BRITANNIA
3,629
3,693
3,729
3,793
3,829
CIPLA
1,048
1,053
1,058
1,064
1,069
COALINDIA
228
230
232
234
237
DIVISLAB
3,617
3,642
3,675
3,700
3,733
DRREDDY
4,196
4,224
4,266 4,294 4,336
EICHERMOT 3,467 3,494
3,538
3,566
3,610
GRASIM
1,752
1,771
1,790
1,809
1,827
HCLTECH
946
951
955
960
965
HDFCBANK
1,492
1,502
1,509
1,520
1,527
HDFCLIFE 572 579
593
600 614
HDFC
2,419
2,435
2,446 2,463 2,474
HEROMOTOCO
2,797
2,834
2,868 2,905
2,939
HINDALCO
429
433
436
440
443
HINDUNILVR
2,562
2,574
2,592
2,604
2,622
ICICIBANK
901
906
910
914 918
INDUSINDBK 1,127 1,145
1,155
1,174
1,184
INFY
1,535
1,540
1,546
1,552
1,558
ITC 329 332
333
336
338
JSW STEEL 681 686
692
697
703
KOTAKBANK
1,908
1,916
1,928
1,936
1,948
LT 1,951 1,971
1,983
2,003
2,015
M&M 1,281 1,291
1,300
1,310
1,319
MARUTI 8,864 8,895
8,942 8,973 9,020
NESTLEIND
18,804
18,934
19,100
19,230
19,397
NTPC 164 166
167
169
171
ONGC
133
133
134 135
136
POWERGRID 222 225
226
228
230
RELIANCE 2,588 2,604
2,617
2,633
2,646
SBILIFE
1,299
1,312
1,323
1,336
1,347
SHREECEM
23,145
23,539
24,243
24,637
25,341
SBIN 551 555
557
561
564
SUNPHARMA
879
885
889
894
899
TCS
3,201
3,215
3,239
3,254 3,278
TATACONSUM
821 835
844
857
866
TATAMOTORS 451 454
456
459
462
TATASTEEL
107
107
108 108
109
TECHM 1,130 1,139
1,152 1,160
1,173
TITAN 2,649 2,677
2,700
2,728
2,751
ULTRACEMCO
6,792
6,844
6,907
6,959
7,022
UPL
744
750
759
765
774
WIPRO 419 421
423
425
428

www.angelone.in
Technical & Derivatives Report
SEPT 14, 2022
*
Technical and Derivatives Team:
Sameet Chavan Chief Analyst – Technical & Derivatives sameet.chavan@angelone.in
Sneha Seth Senior Analyst – Technical & Derivatives sneha.seth@angelone.in
Rajesh Bhosale Technical Analyst rajesh.bhosle@angelone.in
Osho Krishan Senior Analyst – Technical & Derivatives osho.krishan@angelone.in
Research Team Tel: 022 – 39357600 Website: www.angelone.in
For Technical Queries E-mail: technicalresearch-cso@angelone.in
For Derivatives Queries E-mail: derivatives.desk@angelone.in
DISCLAIMER
Angel One Limited (hereinafter referred to as “Angel”) is a registered Member of National Stock Exchange of India Limited, Bombay
Stock Exchange Limited and Metropolitan Stock Exchange Limited. It is also registered as a Depository Participant with CDSL and
Portfolio Manager and investment advisor with SEBI. It also has registration with AMFI as a Mutual Fund Distributor. Angel One
Limited is a registered entity with SEBI for Research Analyst in terms of SEBI (Research Analyst) Regulations, 2014 vide registration
number INH000000164. Angel or its associates has not been debarred/ suspended by SEBI or any other regulatory authority for
accessing /dealing in securities Market.
This document is solely for the personal information of the recipient, and must not be singularly used as the basis of any investment
decision. Nothing in this document should be construed as investment or financial advice. Each recipient of this document should
make such investigations as they deem necessary to arrive at an independent evaluation of an investment in the securities of the
companies referred to in this document (including the merits and risks involved), and should consult their own advisors to determine
the merits and risks of such an investment.
Angel or its associates or research analyst or his relative may have actual/beneficial ownership of 1% or more in the securities of
the subject company at the end of the month immediately preceding the date of publication of the research report. Neither Angel or
its associates nor Research Analysts or his relative has any material conflict of interest at the time of publication of research report.
Angel or its associates might have received any compensation from the companies mentioned in the report during the period
preceding twelve months from the date of this report for services in respect of managing or co-managing public offerings, corporate
finance, investment banking or merchant banking, brokerage services or other advisory service in a merger or specific transaction
in the normal course of business. Angel or its associates did not receive any compensation or other benefits from the companies
mentioned in the report or third party in connection with the research report. Neither Angel nor its research analyst entity has been
engaged in market making activity for the subject company.
Reports based on technical and derivative analysis center on studying charts of a stock's price movement, outstanding positions and
trading volume, as opposed to focusing on a company's fundamentals and, as such, may not match with a report on a company's
fundamentals. Investors are advised to refer the Fundamental and Technical Research Reports available on our website to evaluate
the contrary view, if any.
The information in this document has been printed on the basis of publicly available information, internal data and other reliable
sources believed to be true, but we do not represent that it is accurate or complete and it should not be relied on as such, as this
document is for general guidance only. Angel One Limited or any of its affiliates/ group companies shall not be in any way responsible
for any loss or damage that may arise to any person from any inadvertent error in the information contained in this report. Angel One
Limited has not independently verified all the information contained within this document. Accordingly, we cannot testify, nor make
any representation or warranty, express or implied, to the accuracy, contents or data contained within this document. While Angel
One Limited endeavors to update on a reasonable basis the information discussed in this material, there may be regulatory,
compliance, or other reasons that prevent us from doing so.
This document is being supplied to you solely for your information, and its contents, information or data may not be reproduced,
redistributed or passed on, directly or indirectly.
Neither Angel One Limited, nor its directors, employees or affiliates shall be liable for any loss or damage that may arise from or in
connection with the use of this information. Angel or its associates or Research Analyst or his relative might have financial interest
in the subject company. Research analyst has not served as an officer, director or employee of the subject company.
