September 14, 2021
www.angelone.in
Technical & Derivatives Report
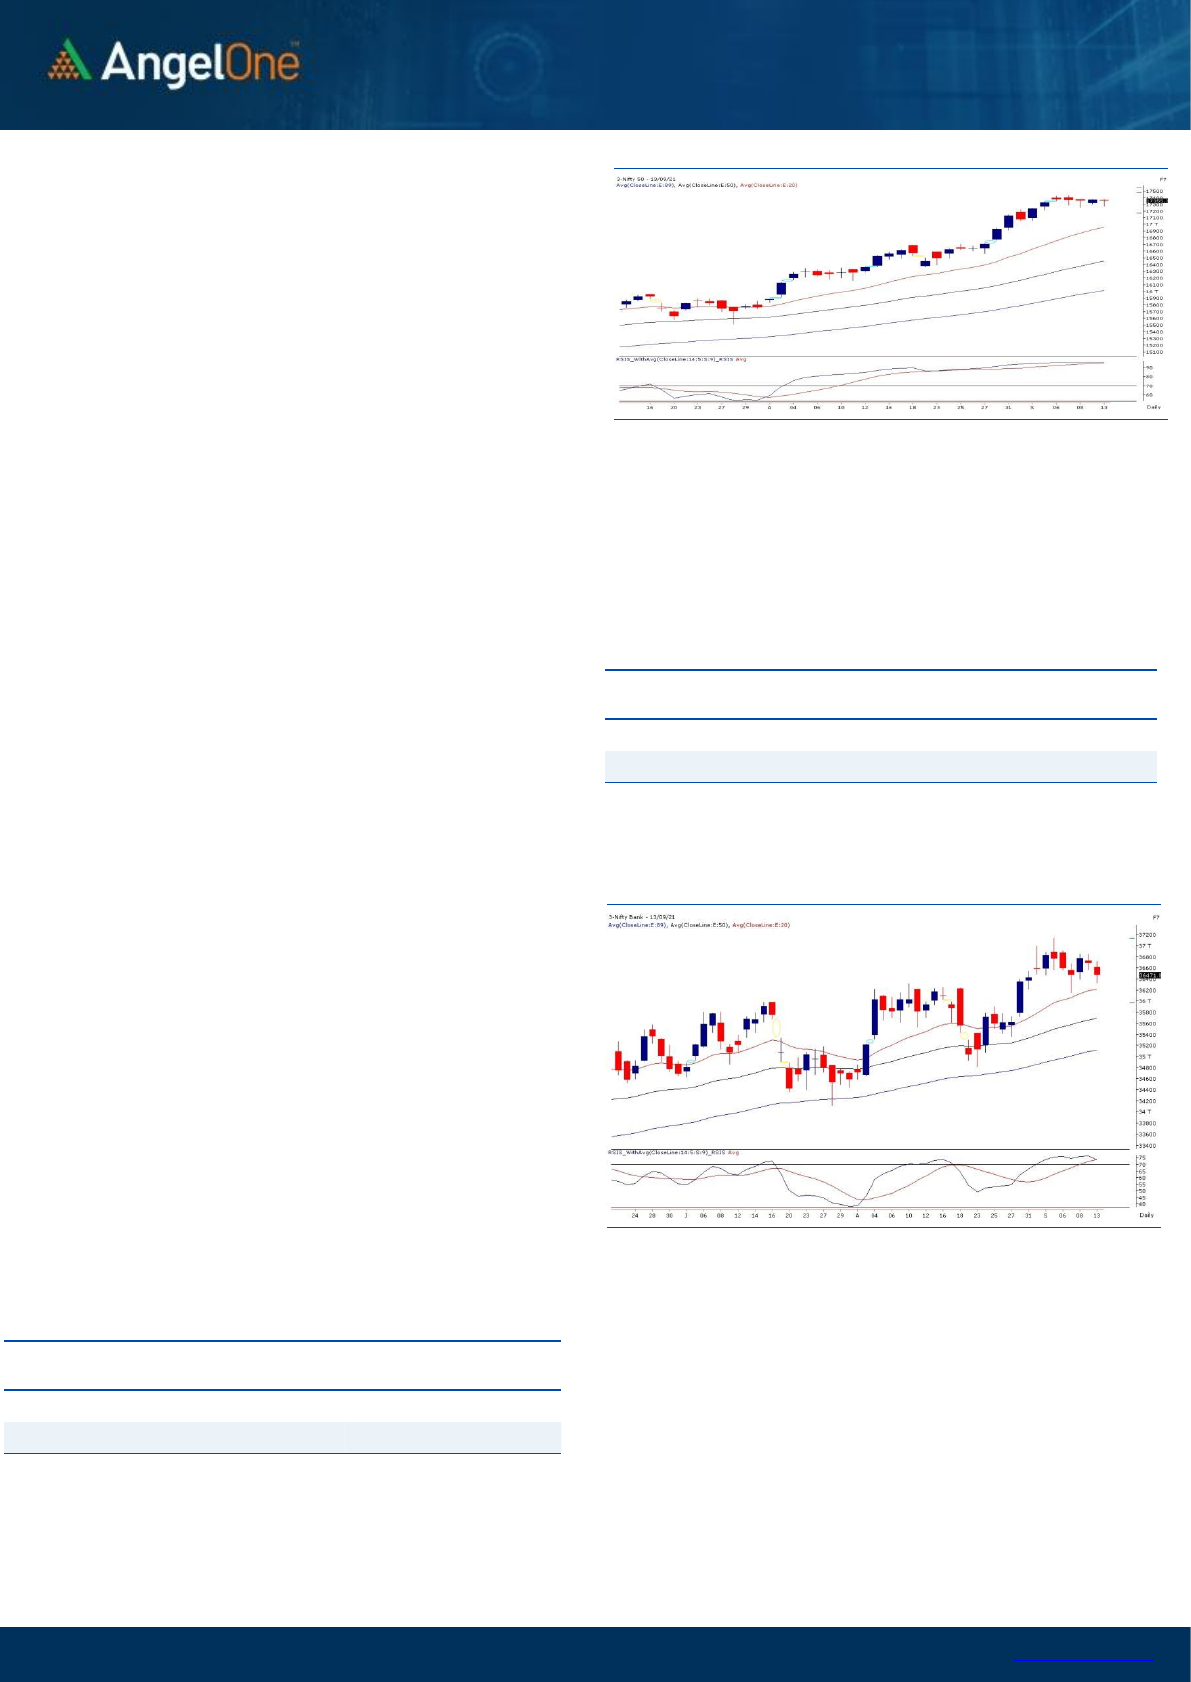
Exhibit 1: Nifty Daily Chart
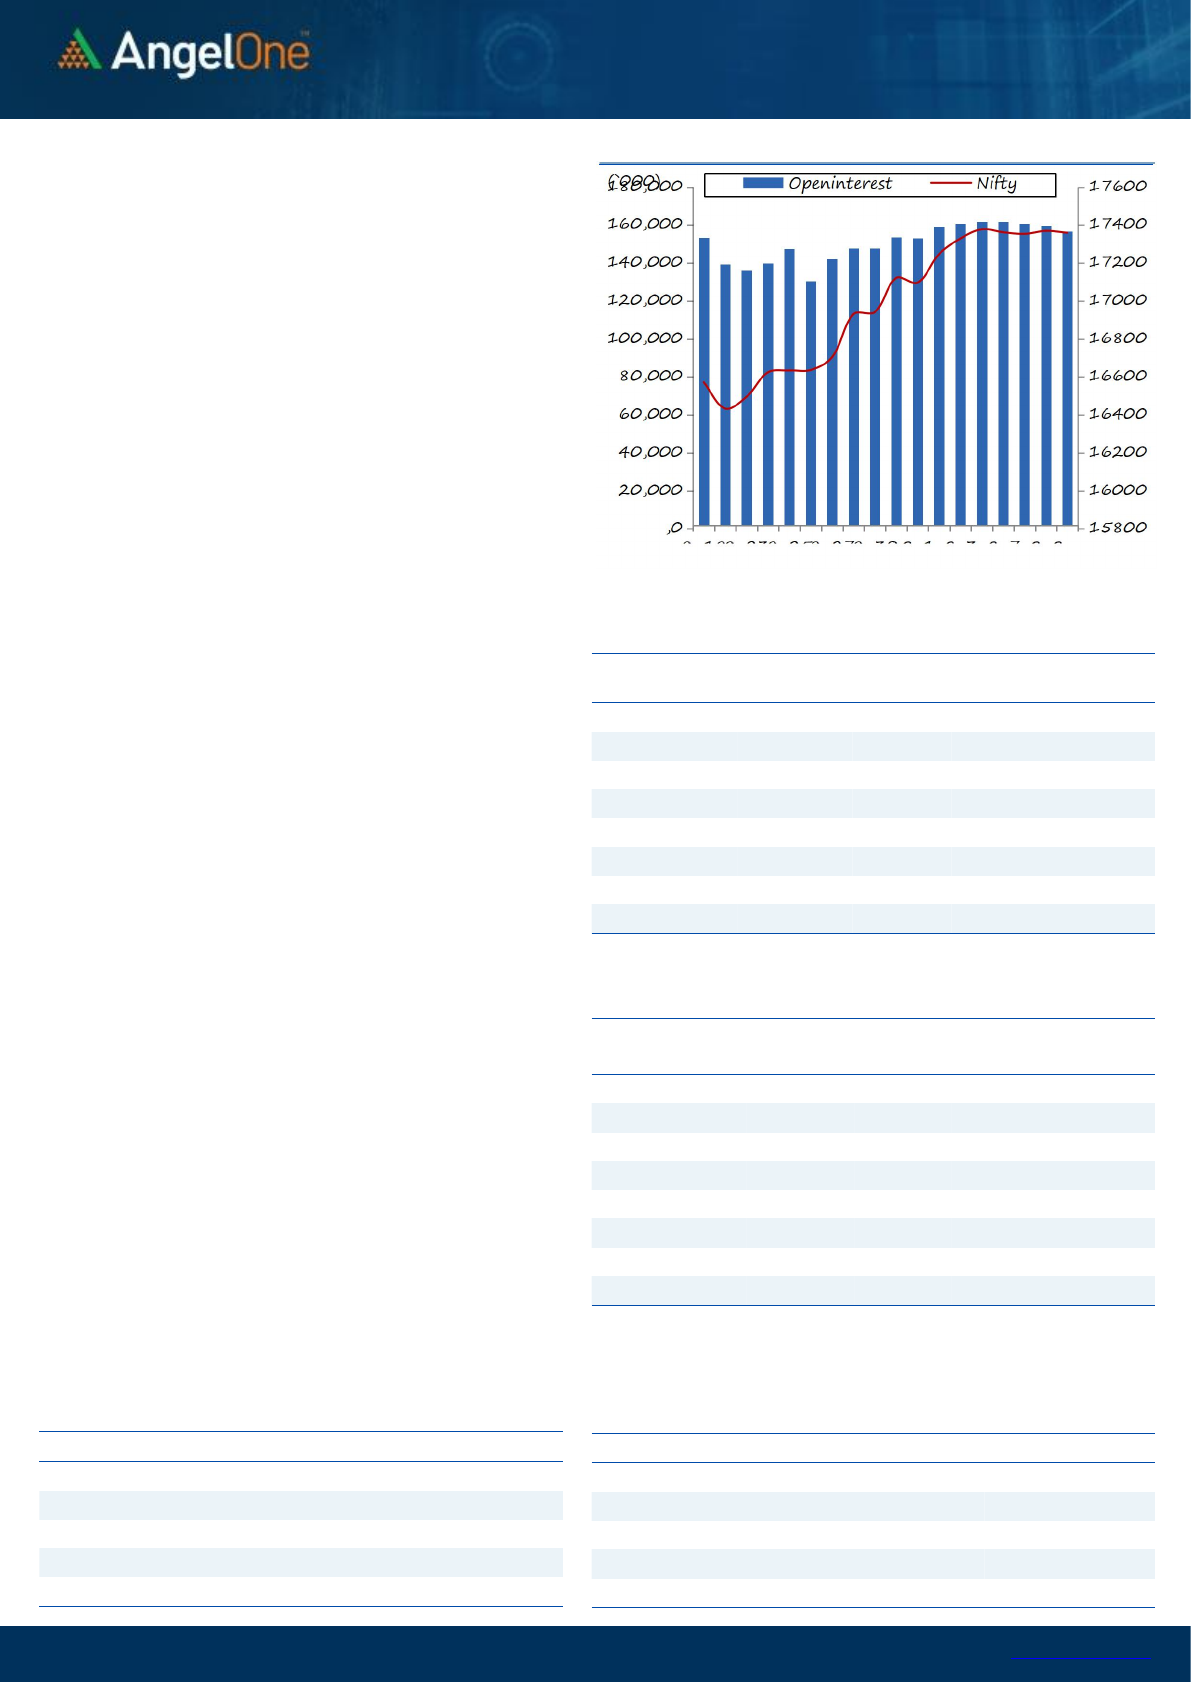
Nifty Bank Outlook - (36472)
The banking index opened marginally in the red and then
immediately extended its losses to some extent. Fortunately
going by the recent trend, no major damage done as the banking
index stabilised around its intraday support.
Although banking index did not aggravate its morning losses, it
remained sulking for the remaining part of the day. As far as
levels are concerned, 36300-36000 are to be seen as key
supports; whereas on the flipside, 36600-36800 continues to be
strong intraday hurdles.
Key Levels
Support 1 – 36300
Resistance 1 – 36600
Support 2 – 36000
Resistance 2 – 36800
Exhibit 2: Nifty Bank Daily Chart
The banking sector underperformed along with the heavyweight
RIL which restricted the upmove in the index. On the flipside, the
Metals and the PSU names were buzzing which provided good
stock specific momentum for traders. It is advisable to focus on
such thematic moves and trade with proper risk management.
Key Levels
Support 1 – 17300
Resistance 1 – 17450
Support 2 – 17250
Resistance 2 – 17500
Sensex (58178) / Nifty (17355)
After an extended weekend, Nifty started the day on a flat note, but
it witnessed some selling pressure in the first hour of trade. As the
index entered sub-17300 level, some buying interest was seen and
the index recovered much of the losses and consolidated to end
with a marginal loss at 17350.
Yesterday’s price action in Nifty was similar to what we had seen
during the last week. We witnessed some selling pressure during the
day wherein the index breached 17300 mark. But again, buying
interest was seen there and the markets recovered the losses during
the day. Nifty traded within a range of 110 points but a lot of stock
specific action was seen. Clearly, it seems to be a time-wise
correction in the index and Nifty has formed a range of 17250-
17450. Now the next directional move is expected only when we
see a breakout on either side and until then, traders should trade
with a stock specific approach where better trading opportunities
are seen.
www.angelone.in
Technical & Derivatives Report
September 14, 2021
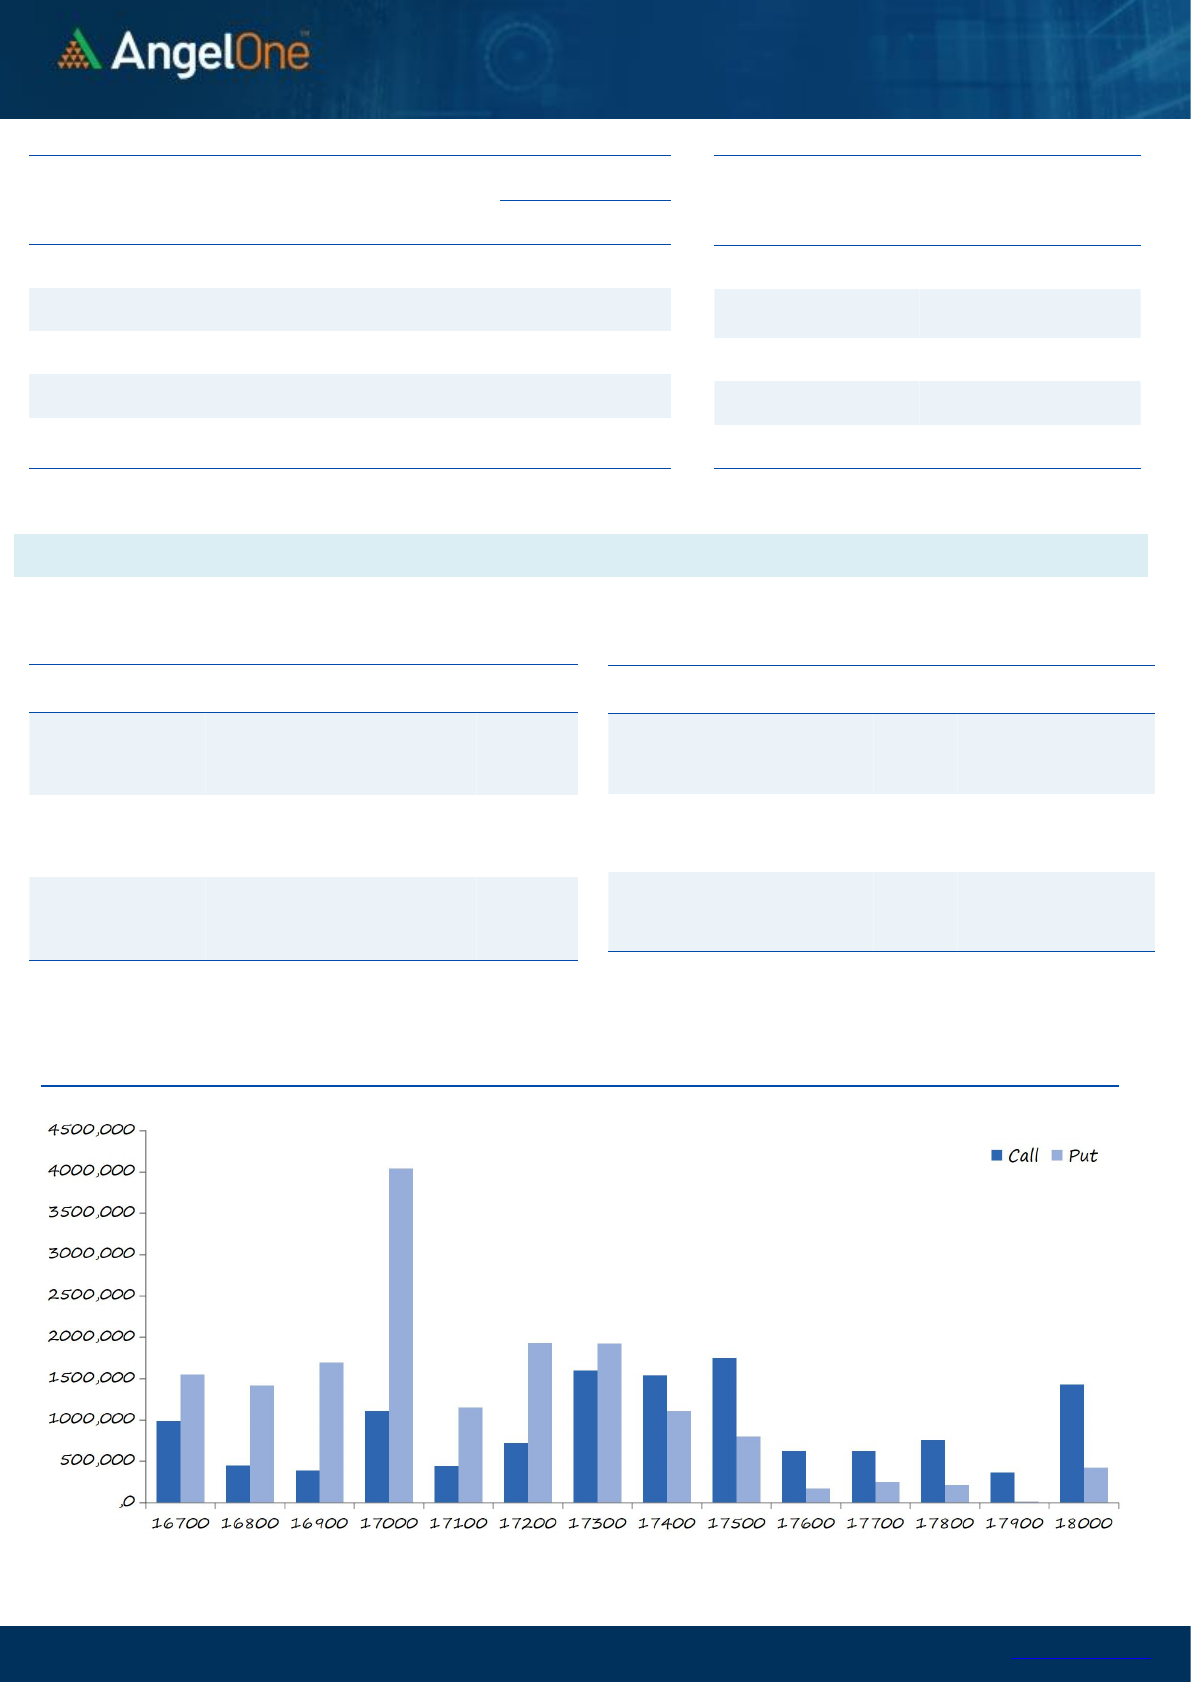
Nifty Vs OI
View
We began the week on a muted note and saw some
selling in the early morning trade to drag index below
17300. However, once again smart recovery was seen to
eventually conclude the day with marginal cuts.
FIIs were net buyers in cash market segment to the tune
of Rs. 1419 crores. In index futures, they sold worth
Rs. 647 crores with rise in open interest indicating short
formation on Monday.
In F&O space, we hardly saw any relevant open interest
activities in both the indices. Stronger hands continued
with their buying in equities but remained sellers in
index and stock futures segment. In Nifty options front,
the overall build-up was scattered between 17300-
17600 call and 17000-17350 put strikes. Highest open
interest concentration is placed at 17400 call and 17300
put options; hinting narrow range for Nifty. Considering
the above data points, its seems Nitfy may continue to
remain range bound and hence we would advise trader
continuing with stock specific approach for the time
being.
Comments
The Nifty futures open interest has decreased by 1.88%.
Bank Nifty futures open interest has increased by 2.73%
as market closed at 17355.30 levels.
The Nifty September future closed with a premium of
4.00 point against a premium of 10.80 point in last
trading session. The October series closed at a premium
of 32.10 point.
The INDIA VIX increased from 13.94 to 14.02. At the
same time, the PCR-OI of Nifty has increased from 1.27
to 1.33.
Few of the liquid counters where we have seen high cost
of carry are IDEA, OFSS, BHEL, INDHOTEL and
AMARAJABAT.
OI Gainers
SCRIP
OI
OI
CHG. (%)
PRICE
PRICE
CHG. (%)
SYNGENE
1800300
69.71
668.85
6.10
IPCALAB
217350
23.85
2596.10
2.96
POLYCAB
700500
22.32
2442.30
2.47
EXIDEIND
38606400
14.16
184.05
0.90
GUJGASLTD
4325000
12.16
676.15
-0.56
OFSS
521000
11.12
4856.20
1.73
HINDALCO
38702150
8.39
478.35
2.95
ASTRAL
506825
7.59
2135.60
4.28
OI Losers
SCRIP
OI
OI
CHG. (%)
PRICE
PRICE
CHG. (%)
IRCTC
1691300
-10.55
3435.80
3.90
NAM-INDIA
4531200
-5.32
436.80
-0.78
MPHASIS
1876550
-4.15
3000.05
2.13
MUTHOOTFIN
2951250
-4.00
1544.55
0.19
SRTRANSFIN
4261200
-3.86
1341.70
-0.65
CUMMINSIND
2270400
-3.74
1044.15
-0.07
BHARTIARTL
70478676
-3.72
693.45
0.92
JUBLFOOD
1523750
-3.51
4135.20
0.88
Put-Call Ratio
SCRIP
PCR-OI
PCR-VOL
NIFTY
1.33
0.95
BANKNIFTY
0.77
0.93
RELIANCE
0.47
0.41
ICICIBANK
0.44
0.54
INFY
0.51
0.31
Historical Volatility
SCRIP
HV
SYNGENE
38.77
IGL
39.17
COALINDIA
38.33
MINDTREE
47.95
ASTRAL
51.59
www.angelone.in
Technical & Derivatives Report
September 14, 2021
Note: Above mentioned Bullish or Bearish Spreads in Nifty (September Series) are given as an information and not as a recommendation.
Nifty Spot = 17355.30
FII Statistics for September 13, 2021
Detail
Buy
Net
Contracts
Open Interest
Sell
Value
(in Cr.)
Change
INDEX
FUTURES
2733.00
3379.57
(646.57)
174959
15378.66
3.24
INDEX
OPTIONS
198204.72
198761.48
(556.76)
1356700
119095.52
19.38
STOCK
FUTURES
9742.51
10902.33
(1159.82)
1473174
126036.39
0.84
STOCK
OPTIONS
13839.32
13867.04
(27.72)
271959
23230.46
1.77
Total
224519.55
226910.42
(2390.87)
3276792
283741.03
8.00
Turnover on September 13, 2021
Instrument
No. of
Contracts
Turnover
( in Cr. )
Change
(%)
Index Futures
220676
19624.81
11.66
Index Options
35033416
3135613.68
-67.28
Stock Futures
539747
46593.35
0.92
Stock Options
2272936
204818.87
13.81
Total
3,80,66,775
3406650.71
-65.34
Bull-Call Spreads
Action
Strike
Price
Risk
Reward
BEP
Buy
17400
155.20
43.70
56.30
17443.70
Sell
17500
111.50
Buy
17400
155.20
78.10
121.90
17478.10
Sell
17600
77.10
Buy
17500
111.50
34.40
65.60
17534.40
Sell
17600
77.10
Bear-Put Spreads
Action
Strike
Price
Risk
Reward
BEP
Buy
17300
196.85
47.60
52.40
17252.40
Sell
17200
149.25
Buy
17300
196.85
83.85
116.15
17216.15
Sell
17100
113.00
Buy
17200
149.25
36.25
63.75
17163.75
Sell
17100
113.00
Nifty Put-Call Analysis

www.angelone.in
Technical & Derivatives Report
September 14, 2021
Daily Pivot Levels for Nifty Constituents
Scrips
S2
S1
PIVOT
R1
R2
ADANIPORTS
734
740
746
752
758
ASIANPAINT
3,313
3,340
3,357
3,384
3,401
AXISBANK
780
784
787
791
794
BAJAJ-AUTO
3,660
3,680
3,700
3,720
3,740
BAJFINANCE
7,288
7,367
7,431
7,510
7,574
BAJAJFINSV
16,423
16,681
16,837
17,095
17,251
BPCL
489
493
496
501
504
BHARTIARTL
681
687
692
698
703
BRITANNIA
4,041
4,067
4,085
4,112
4,129
CIPLA
938
944
949
955
960
COALINDIA
147
151
153
157
160
DIVISLAB
4,966
5,025
5,061
5,120
5,156
DRREDDY
4,843
4,887
4,917
4,961
4,991
EICHERMOT
2,761
2,783
2,799
2,821
2,837
GRASIM
1,566
1,586
1,600
1,620
1,634
HCLTECH
1,161
1,185
1,200
1,223
1,239
HDFCBANK
1,534
1,545
1,564
1,575
1,595
HDFCLIFE
714
725
734
744
753
HDFC
2,810
2,830
2,853
2,873
2,896
HEROMOTOCO
2,748
2,769
2,791
2,812
2,834
HINDALCO
464
471
476
483
488
HINDUNILVR
2,747
2,767
2,795
2,814
2,842
ICICIBANK
697
702
710
715
723
IOC
112
113
114
115
115
INDUSINDBK
986
991
998
1,003
1,009
INFY
1,663
1,678
1,690
1,704
1,716
ITC
210
212
214
216
217
JSW STEEL
681
688
694
700
706
KOTAKBANK
1,773
1,807
1,828
1,862
1,883
LT
1,654
1,663
1,669
1,678
1,684
M&M
733
739
746
753
760
MARUTI
6,779
6,826
6,861
6,908
6,943
NESTLEIND
20,124
20,288
20,394
20,558
20,664
NTPC
114
114
115
116
116
ONGC
120
122
123
124
125
POWERGRID
172
173
174
175
175
RELIANCE
2,326
2,349
2,391
2,414
2,456
SBILIFE
1,140
1,153
1,166
1,178
1,192
SHREECEM
30,103
30,383
30,608
30,888
31,113
SBIN
427
430
432
435
437
SUNPHARMA
767
774
778
785
790
TCS
3,736
3,791
3,822
3,876
3,907
TATACONSUM
866
874
879
887
892
TATAMOTORS
293
297
300
304
306
TATASTEEL
1,422
1,443
1,457
1,478
1,493
TECHM
1,410
1,420
1,430
1,439
1,449
TITAN
2,009
2,020
2,032
2,042
2,054
ULTRACEMCO
7,878
7,911
7,938
7,971
7,998
UPL
742
749
758
765
775
WIPRO
653
662
667
676
681

www.angelone.in
Technical & Derivatives Report
September 14, 2021
*
Research Team Tel: 022 – 39357600 (Extn. 6844) Website: www.angelone.in
For Technical Queries E-mail: technicalresearch-cso@angelbroking.com
For Derivatives Queries E-mail: derivatives.desk@angelbroking.com
DISCLAIMER
Angel Broking Limited (hereinafter referred to as “Angel”) is a registered Member of National Stock Exchange of India Limited,
Bombay Stock Exchange Limited and Metropolitan Stock Exchange Limited. It is also registered as a Depository Participant with CDSL
and Portfolio Manager and Investment Adviser with SEBI. It also has registration with AMFI as a Mutual Fund Distributor. Angel
Broking Limited is a registered entity with SEBI for Research Analyst in terms of SEBI (Research Analyst) Regulations, 2014 vide
registration number INH000000164. Angel or its associates has not been debarred/ suspended by SEBI or any other regulatory
authority for accessing /dealing in securities Market. Angel or its associates/analyst has not received any compensation / managed
or co-managed public offering of securities of the company covered by Analyst during the past twelve months.
This document is solely for the personal information of the recipient, and must not be singularly used as the basis of any investment
decision. Nothing in this document should be construed as investment or financial advice. Each recipient of this document should
make such investigations as they deem necessary to arrive at an independent evaluation of an investment in the securities of the
companies referred to in this document (including the merits and risks involved), and should consult their own advisors to determine
the merits and risks of such an investment.
Reports based on technical and derivative analysis center on studying charts of a stock's price movement, outstanding positions and
trading volume, as opposed to focusing on a company's fundamentals and, as such, may not match with a report on a company's
fundamentals. Investors are advised to refer the Fundamental and Technical Research Reports available on our website to evaluate
the contrary view, if any.
The information in this document has been printed on the basis of publicly available information, internal data and other reliable
sources believed to be true, but we do not represent that it is accurate or complete and it should not be relied on as such, as this
document is for general guidance only. Angel Broking Limited or any of its affiliates/ group companies shall not be in any way
responsible for any loss or damage that may arise to any person from any inadvertent error in the information contained in this
report. Angel Broking Limited has not independently verified all the information contained within this document. Accordingly, we
cannot testify, nor make any representation or warranty, express or implied, to the accuracy, contents or data contained within this
document. While Angel Broking Limited endeavors to update on a reasonable basis the information discussed in this material, there
may be regulatory, compliance, or other reasons that prevent us from doing so.
This document is being supplied to you solely for your information, and its contents, information or data may not be reproduced,
redistributed or passed on, directly or indirectly.
