March 14, 2023
www.angelone.in
Technical & Derivatives Report
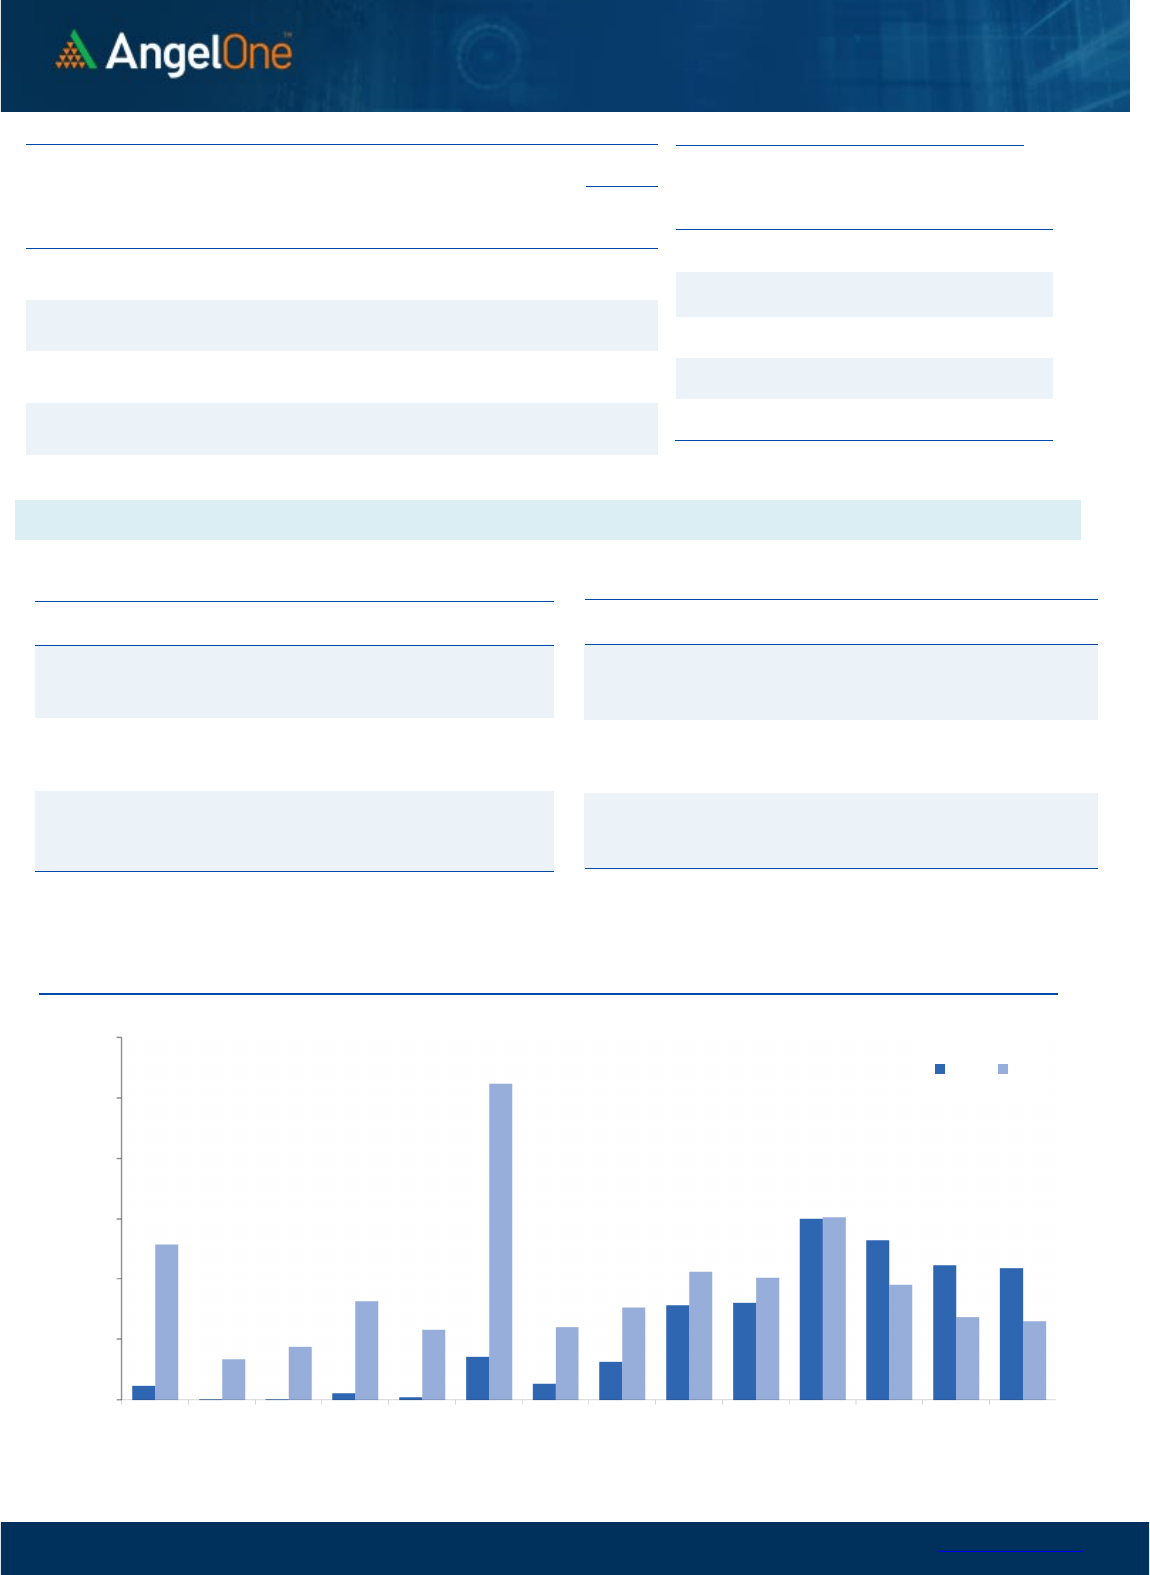
Nifty Bank
Outlook (
39565
)
Despite starting negatively, the Bank Index experienced strong
positive movement during the initial few minutes. However, this
was short-lived as a sharp selloff erased morning gains and further
weakness resulted in a sharp cut of 2.27% to end at 39565.
Over the last three sessions, the index has declined by more than
2000 points, and it is now approaching a key support zone
between 39400-39200 levels. These levels coincide with the
200SMA and recent swing lows. Even if this support zone is
breached, it may not be advisable to take fresh short positions
because the hourly indicators are oversold, and there is positive
divergence in the RSI. Due to the high volatility in the banking
counters, it is best to avoid undue risk. Instead, investors should
wait for bullish reversal signs and accumulate high-quality
propositions in a staggered manner. In terms of resistance
levels, 40000-40350 is likely to act as immediate resistance.
Key Levels
Support 1 – 39400 Resistance 1 – 40000
Support 2 – 39200 Resistance 2 – 40350
Exhibit 1: Nifty Daily Chart
Exhibit 2: Nifty Bank Daily Chart
Sensex (
58238
) / Nifty (
1
7
154
)
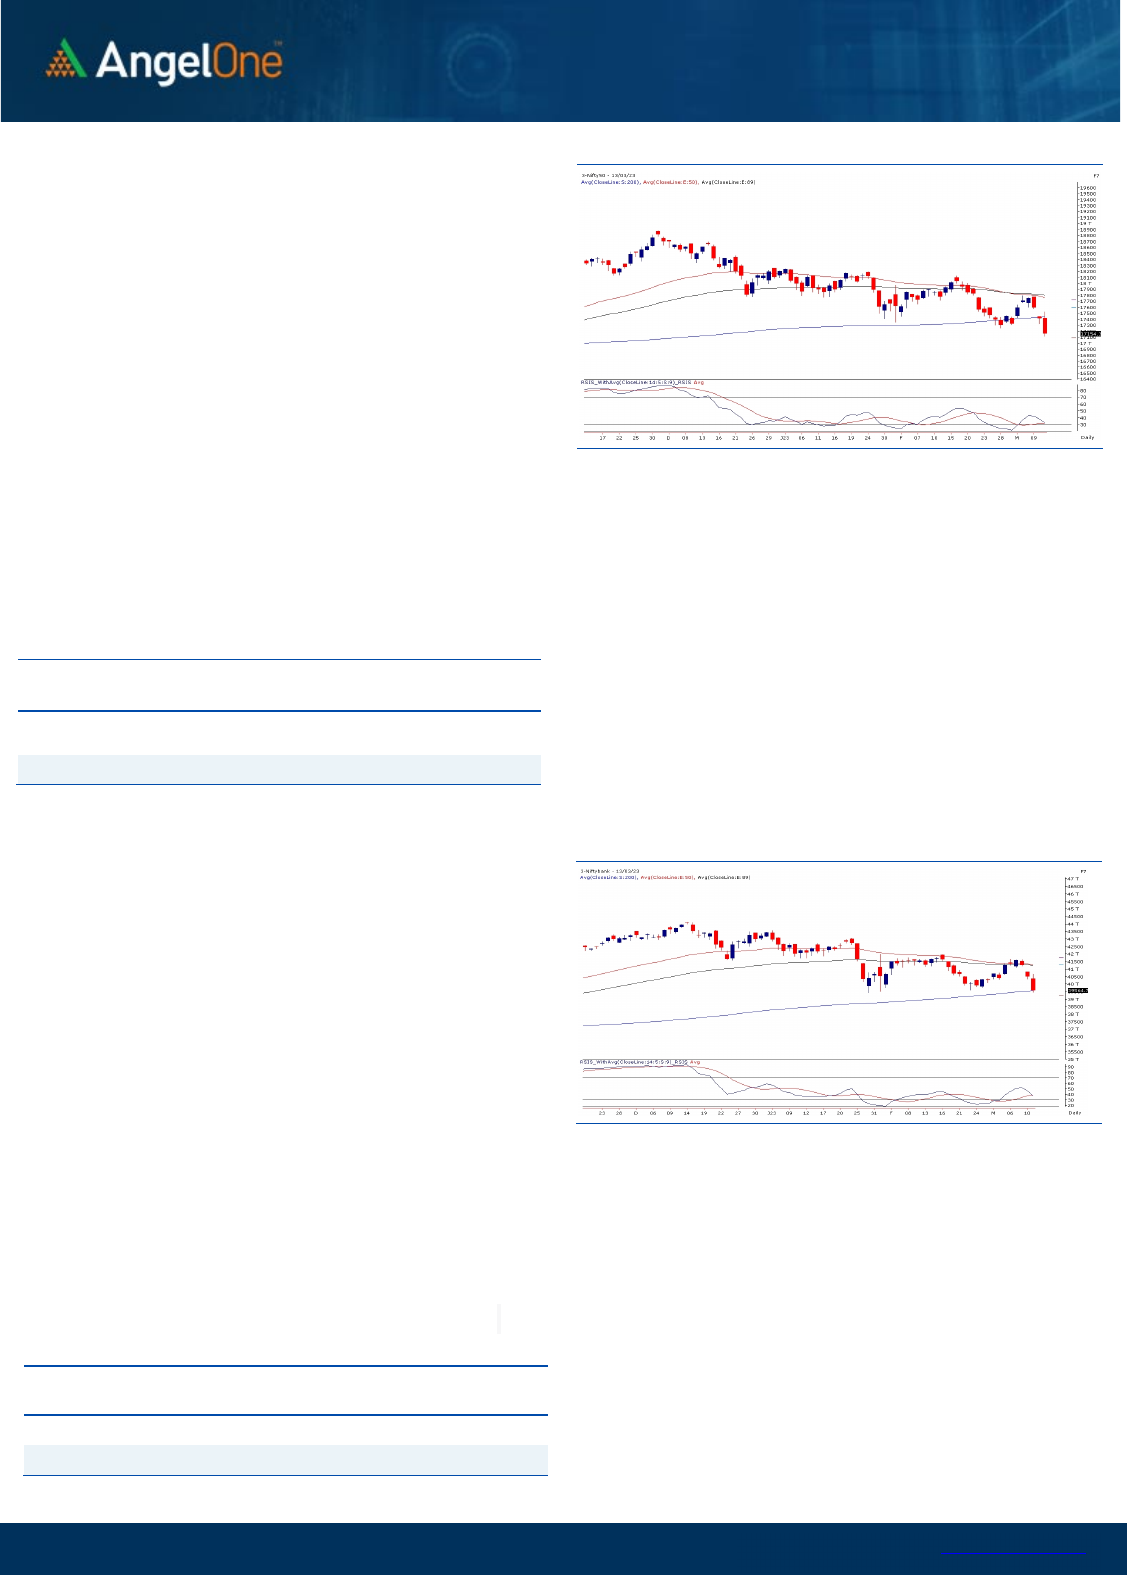
The Indian equity market started the day on a strong note, wherein
the benchmark index retested the 17500 zone within minutes after
the opening bell. However, it appeared to be a false momentum as
the index took a U-turn to pare down the early gains and gradually
nosedived into negative terrain. Amidst the hustle, the Nifty50
index slipped to a fresh low in the current calendar year with a cut
of 1.49 percent and settled around the 17150 level.
The rub-off effect of the global weakness was quite evident in our
market as we failed to sustain at the higher grounds. Technically,
our market is in the cycle of lower lows – lower bottoms formation
and with yesterday’s strong sell-off, Nifty plunged to new lows,
denting sentiments. As far as levels are concerned, the
psychological mark of 17000 is in the vicinity now, followed by
16900. While on the flip side, the 200 SMA placed around the
17400-17450 odd zone is expected to act as a sturdy hurdle in a
comparable period.
Key Levels
Support 1 – 17000 Resistance 1 – 17400
Support 2 – 16900 Resistance 2 – 17450
Going ahead, any positive developments in the US market could
bring some cheer back and hence one needs to keep a close tab
on global bourses. Meanwhile, we advocate to avoid aggressive
bets and keep accumulating quality propositions in a staggered
manner.

www.angelone.in
Technical & Derivatives Report
March 14, 2023
View
It was a third straight session of fall in our market.
Though, we started on a week note but smart buying
emerged to reclaim 17500, but this gains soon got
wiped-off to not only erase the morning gains but
also test February series low. The nifty inched lower
to almost touch 17100 in the final hour.
FIIs were net sellers in the cash market segment to
the tune of Rs. 1547 crores. Simultaneously, in Index
futures, they sold worth Rs. 620 crores with an
increase in open interest, indicating short addition.
Looking at the F&O data, we witnessed short
formation in both key indices. On the options front,
a decent piling of OI is seen at the 17200-17500 call
strike, which is mostly short positions. On the flip
side, we observed decent unwinding in 17250-17400
put strikes and now the highest open interest
concentration is visible in 17000 put strike;
suggesting support has shifted lower now.
Meanwhile, the stronger hands have added mixed
bets in index futures with majority on the short side.
For now, we believe market is a bit oversold and
hence traders should avoid shorting.
Comments
The Nifty futures open interest has increased by 1.02%
and Bank Nifty futures open interest has increased by
7.27% as the market closed at 17154.30.
The Nifty March future closed with a premium of 51.5
point against a premium of 39.65 point in the last
trading session. The April series closed at a premium of
151.55 point.
The INDIA VIX increased from 13.41 to 16.21. At the
same time, the PCR-OI of Nifty has decreased from 0.89
to 0.71.
Few of the liquid counters where we have seen high
cost of carry are POLYCAB, HDFCBANK, RECLTD, CANBK,
AND INDIAMART.
Historical Volatility
SCRIP HV
TECHM 36.28
INDUSINDBK 45.80
COROMANDEL 33.32
PEL 48.78
AUBANK 42.43
Nifty Vs OI
17200
17300
17400
17500
17600
17700
17800
17900
18000
18100
18200
4,000
6,000
8,000
10,000
12,000
14,000
16,000
2/17 2/22 2/24 2/28 3/2 3/6 3/9 3/13
Openinterest Nifty
OI
Gainers
SCRIP OI
OI
CHG. (%)
PRICE
PRICE
CHG. (%)
IPCALAB 2314650 19.34 794.15 -0.67
AUBANK 14548000 18.31 596.45 -5.24
INDUSINDBK 29377800 13.95 1060.10 -7.58
NAVINFLUOR 490500 12.45 4121.95 -2.07
INDIAMART 345150 11.05 4661.05 -2.05
ATUL 154425 10.17 6844.15 -2.40
TECHM 13187400 9.57 1133.80 6.92
PERSISTENT 1054725 8.40 4622.05 -2.20
OI Losers
SCRIP OI
OI
CHG. (%)
PRICE
PRICE
CHG. (%)
MGL 17600 -8.51 990.30 0.05
LALPATHLAB 881000 -6.53 1833.30 0.05
GAIL 66410700 -5.96 110.20 -1.03
POWERGRID 34597800 -5.49 226.10 -0.46
ABB 1607500 -5.18 3274.45 -3.07
GUJGASLTD 4905000 -4.85 507.60 -0.57
SIEMENS 1889800 -4.85 3269.90 -1.32
ABBOTINDIA 45800 -4.82 20259.65 -1.49
Put-Call Ratio
SCRIP PCR (OI) PCR (VOL)
NIFTY 0.89 0.91
BANKNIFTY 0.66 0.99
RELIANCE 0.52 0.52
ICICIBANK 0.60 0.68
INFY 0.45 0.43
www.angelone.in
Technical & Derivatives Report
March 14, 2023
Note: Above mentioned Bullish or Bearish Spreads in Nifty (March Series) are given as an information and not as a recommendation.
Nifty Spot =
1
7
154.30
0900
Lot Size = 75
FII Statistics for
March
1
3
, 202
3
Detail Buy
Contracts
Open
Interest
Value
(in Cr.)
Sell
Net
CHANGE
INDEX
FUTURES
8408.90
9028.83
(619.93) 188388
16813.82
5.46
INDEX
OPTIONS
1224256.84
1216245.31
8011.53
2835715
252138.95
19.22
STOCK
FUTURES
10801.17
12387.06
(1585.89) 2199280
142621.49
0.77
STOCK
OPTIONS
12703.60
12793.93
(90.33) 163830
10659.07
4.26
Total 1256170.51
1250455.13
5715.38
5387213
422233.33
10.01
Turnover
on
March
1
3
, 202
3
Instrument
No. of
Contracts
Turnover
( in Cr. )
Change
(%)
Index Futures
627368 58848.80
114.88
Index Options
232041330
74082.00
42.82
Stock Futures
841224 55043.44
31.78
Stock Options
3261661 3212.62 0.39
Total
3,261,661 3212.62 53.90
Bull-Call Spreads
Action Strike Price Risk Reward BEP
Buy
17200 225.60
54.80
45.20
17254.80
Sell
17300 170.80
Buy
17200 225.60
95.90
104.10
17295.90
Sell
17400 129.70
Buy
17300 170.80
41.10 58.90 17341.10
Sell
17400 129.70
Bear-Put Spreads
Action Strike Price Risk Reward BEP
Buy
17100 222.20
34.85
65.15
17065.15
Sell 17000 187.35
Buy 17100 222.20
69.85
130.15
17030.15
Sell
16900 152.35
Buy
17000 187.35
35.00 65.00 16965.00
Sell 16900 152.35
Nifty Put-Call Analysis
,0
1000,000
2000,000
3000,000
4000,000
5000,000
6000,000
16500 16600 16700 16800 16900 17000 17100 17200 17300 17400 17500 17600 17700 17800
Call Put

www.angelone.in
Technical & Derivatives Report
March 14, 2023
`
Daily
Pivot Levels for Nifty
Constituents
Scrips
S2
S1
PIVOT
R1
R2
ADANIENT
1,778
1,826
1,906
1,954
2,033
ADANIPORTS 656 669
690
702
723
APOLLOHOSP
4,254
4,299
4,368
4,413
4,482
ASIANPAINT
2,725
2,754
2,802
2,832
2,879
AXISBANK 811 822
839
850
868
BAJAJ-AUTO
3,725
3,752
3,795
3,822
3,865
BAJFINANCE
5,728
5,781
5,864
5,917
6,001
BAJAJFINSV
1,260
1,278
1,310
1,327
1,359
BPCL 318 320
323
326
329
BHARTIARTL 754 760
769
774
783
BRITANNIA
4,259
4,283
4,315
4,339
4,371
CIPLA 862 868
879
885
896
COALINDIA 216 218
222
225
228
DIVISLAB
2,728
2,748
2,777
2,797
2,826
DRREDDY
4,307
4,339
4,377
4,409
4,448
EICHERMOT
2,963
2,998
3,060
3,096
3,158
GRASIM
1,507
1,535
1,576
1,604
1,645
HCLTECH
1,070
1,085
1,109
1,123
1,148
HDFCBANK
1,540
1,554
1,579
1,593
1,618
HDFCLIFE
466
472
484
491
502
HDFC
2,529
2,552
2,589
2,613
2,650
HEROMOTOCO
2,341
2,364
2,403
2,426
2,465
HINDALCO 389 396
405
412
422
HINDUNILVR
2,419
2,437
2,463
2,481
2,506
ICICIBANK 805 816
836
848
867
INDUSINDBK
1,014
1,037
1,078
1,101
1,143
INFY
1,397
1,416
1,447
1,466
1,497
ITC 377 380
386
389
394
JSW STEEL 662 669
680
687
698
KOTAKBANK
1,631
1,652
1,688
1,709
1,745
LT
2,068
2,101
2,140
2,173
2,212
M&M
1,154
1,174
1,202
1,222
1,251
MARUTI
8,389
8,454
8,546
8,610
8,702
NESTLEIND
18,119
18,218
18,359
18,458
18,599
NTPC 178 179
180
181
182
ONGC 154 155
156
157
159
POWERGRID 223 224
227
229
232
RELIANCE
2,232
2,258
2,301
2,327
2,370
SBILIFE
1,045
1,059
1,080
1,094
1,115
SBIN 513 521
537
546
562
SUNPHARMA 942 948
954
960
966
TCS
3,210
3,246
3,308
3,344
3,406
TATACONSUM
682 688
698
704
713
TATAMOTORS 408 415
426
433
444
TATASTEEL 105 106
107
108
110
TECHM
1,101
1,118
1,141
1,157
1,181
TITAN
2,287
2,310
2,343
2,366
2,399
ULTRACEMCO
6,926
7,001
7,129
7,204
7,333
UPL 692 698
709
715
725
WIPRO 378 382
387
391
396

www.angelone.in
Technical & Derivatives Report
March 14, 2023
*
Technical and Derivatives Team:
Sameet Chavan Chief Analyst – Technical & Derivatives sameet.chavan@angelone.in
Sneha Seth Senior Analyst – Technical & Derivatives sneha.seth@angelone.in
Rajesh Bhosale Technical Analyst rajesh.bhosle@angelone.in
Osho Krishan Senior Analyst – Technical & Derivatives osho.krishan@angelone.in
Research Team Tel: 022 – 39357600 Website: www.angelone.in
For Technical Queries E-mail: technicalresearch-cso@angelone.in
For Derivatives Queries E-mail: derivatives.desk@angelone.in
DISCLAIMER
Angel One Limited (hereinafter referred to as “Angel”) is a registered Member of National Stock Exchange of India Limited, Bombay Stock Exchange
Limited and Metropolitan Stock Exchange Limited. It is also registered as a Depository Participant with CDSL and Portfolio Manager and investment
advisor with SEBI. It also has registration with AMFI as a Mutual Fund Distributor. Angel One Limited is a registered entity with SEBI for Research
Analyst in terms of SEBI (Research Analyst) Regulations, 2014 vide registration number INH000000164. Angel or its associates has not been
debarred/ suspended by SEBI or any other regulatory authority for accessing /dealing in securities Market.
This document is solely for the personal information of the recipient, and must not be singularly used as the basis of any investment decision.
Nothing in this document should be construed as investment or financial advice. Each recipient of this document should make such investigations
as they deem necessary to arrive at an independent evaluation of an investment in the securities of the companies referred to in this document
(including the merits and risks involved), and should consult their own advisors to determine the merits and risks of such an investment.
Angel or its associates or research analyst or his relative may have actual/beneficial ownership of 1% or more in the securities of the subject
company at the end of the month immediately preceding the date of publication of the research report. Neither Angel or its associates nor
Research Analysts or his relative has any material conflict of interest at the time of publication of research report.
Angel or its associates might have received any compensation from the companies mentioned in the report during the period preceding twelve
months from the date of this report for services in respect of managing or co-managing public offerings, corporate finance, investment banking or
merchant banking, brokerage services or other advisory service in a merger or specific transaction in the normal course of business. Angel or its
associates did not receive any compensation or other benefits from the companies mentioned in the report or third party in connection with the
research report. Neither Angel nor its research analyst entity has been engaged in market making activity for the subject company.
Reports based on technical and derivative analysis center on studying charts of a stock's price movement, outstanding positions and trading
volume, as opposed to focusing on a company's fundamentals and, as such, may not match with a report on a company's fundamentals. Investors
are advised to refer the Fundamental and Technical Research Reports available on our website to evaluate the contrary view, if any.
The information in this document has been printed on the basis of publicly available information, internal data and other reliable sources believed
to be true, but we do not represent that it is accurate or complete and it should not be relied on as such, as this document is for general guidance
only. Angel One Limited or any of its affiliates/ group companies shall not be in any way responsible for any loss or damage that may arise to any
person from any inadvertent error in the information contained in this report. Angel One Limited has not independently verified all the information
contained within this document. Accordingly, we cannot testify, nor make any representation or warranty, express or implied, to the accuracy,
contents or data contained within this document. While Angel One Limited endeavors to update on a reasonable basis the information discussed
in this material, there may be regulatory, compliance, or other reasons that prevent us from doing so.
This document is being supplied to you solely for your information, and its contents, information or data may not be reproduced, redistributed or
passed on, directly or indirectly.
Neither Angel One Limited, nor its directors, employees or affiliates shall be liable for any loss or damage that may arise from or in connection
with the use of this information. Angel or its associates or Research Analyst or his relative might have financial interest in the subject company.
Research analyst has not served as an officer, director or employee of the subject company.
