DEC 13, 2022
www.angelone.in
Technical & Derivatives Report
xOOOOOOOO
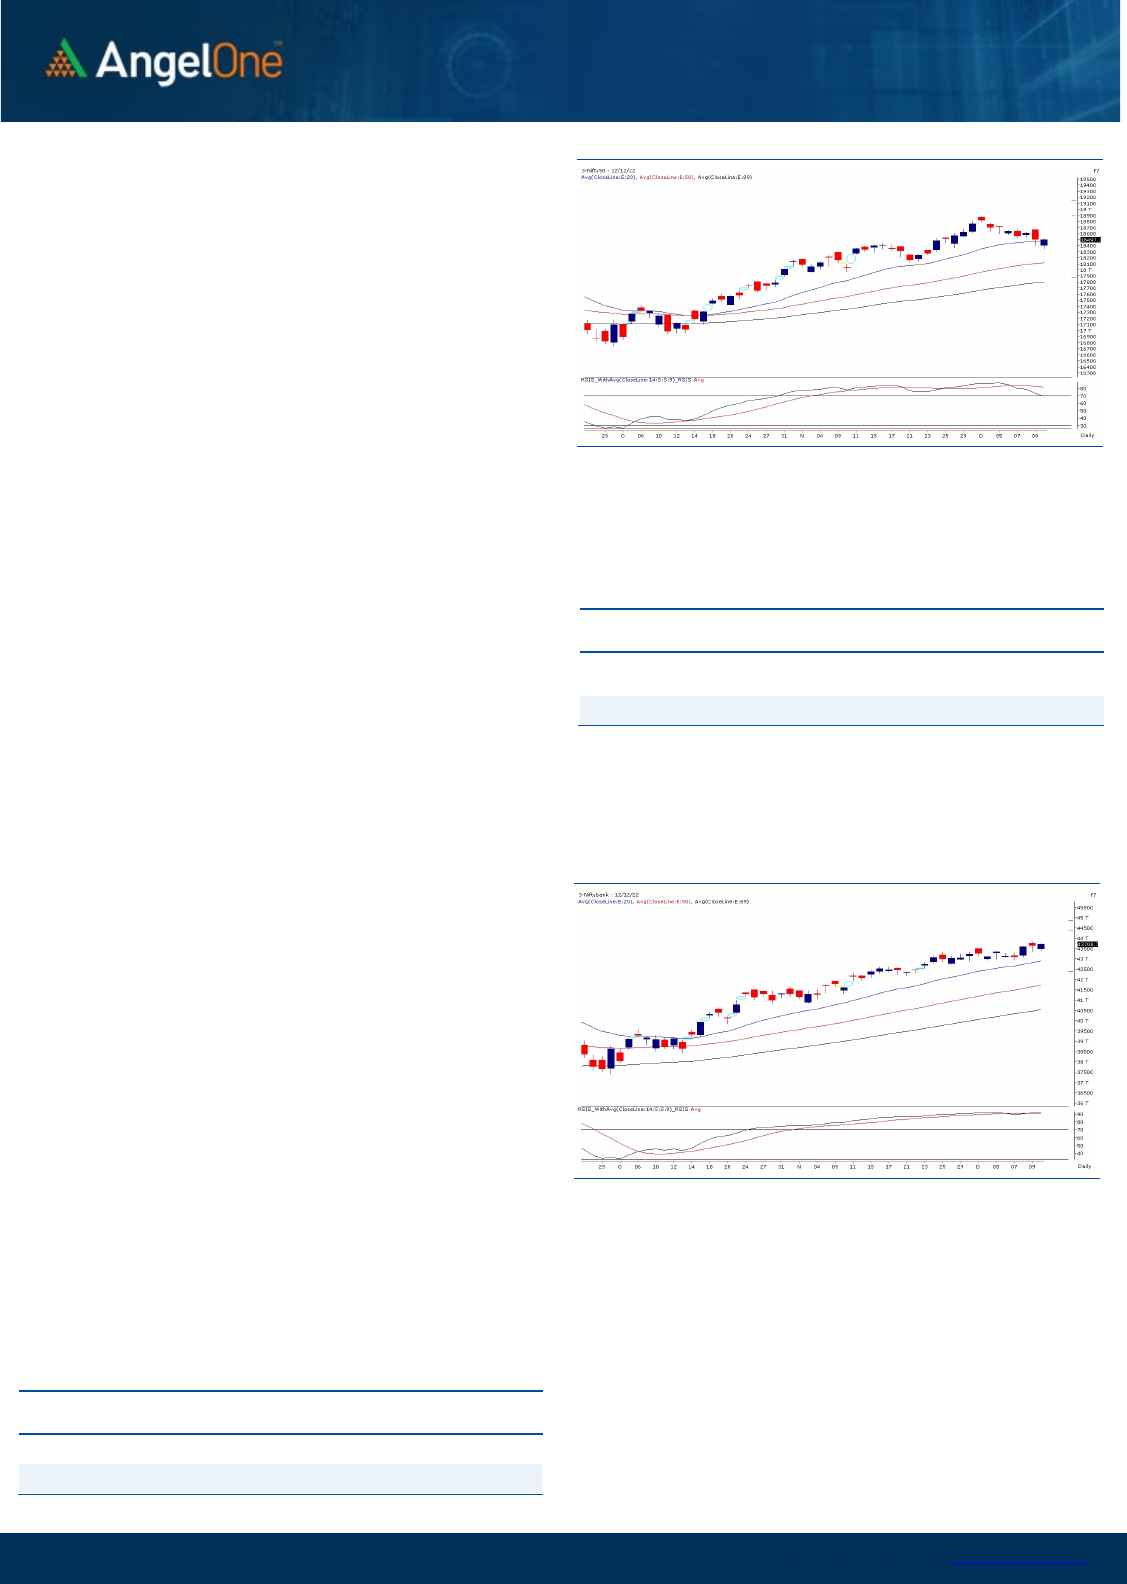
Nifty Bank Outlook (43709)
The start of the week was on a negative note however the morning
blip got immediately bought to recover lost ground within a few
minutes. The second half however was lackluster as there was no
major traction and after trading in a range price eventually ended
with minor gains tad above 43700 levels.
On the technical front not much has changed and the bank index
remains an outperformer. Going ahead as well we would advocate
using dips as a buying opportunity. In such a scenario, immediate
support is seen around 43350 levels followed by 43000 levels. On
the higher side, 44200 is the immediate resistance and if 44500 is
seen before the weekly expiry then that should be considered for
booking profits as indicators are in the overbought zone. The
overall trend is strongly bullish, and a strong further upside is
expected in the near term however considering the key events
lined up; one should be selective and avoid undue risk.
Key Levels
Support 1 – 43350 Resistance 1 – 44200
Support 2 – 43200 Resistance 2 – 44500
Exhibit 1: Nifty
Daily
Chart
Exhibit 2: Nifty Bank
Daily
Chart
Sensex (62131) / Nifty (18497)
We had a nervous start for the week in line with not so favourable
global cues. In the initial trades, Nifty sneaked below the 18400
mark and even went on to challenge 18350. Fortunately, the mighty
bulls came for a rescue as some of the heavyweight pockets
cushioned these early tremors. In fact, we witnessed a V-shaped
recovery in the initial hour to recoup all losses in a quick span.
During the remaining part of the session, markets remained range
bound; but successfully managed to safeguard their strong
recovery. Eventually, Nifty ended the session precisely at Friday’s
close a tad below the 18500 mark.
With reference to our previous commentary, we had mentioned
how crucial it is for Nifty to hold the sacrosanct support zone of
18400 – 18300. Yesterday’s smart recovery after testing the
midpoint of this range has certainly proved the significance of this
key demand zone. Now, yesterday’s low of 18345 should be
considered as an important point and till the time, it remains
unbroken, we would continue with our positive stance on the
market. For the coming session, 18550 and 18650 are to be treated
as immediate hurdles. The moment we overcome these barriers, we
would see resumption of higher degree uptrend and then a path
towards the next milestone of 19000 once again gets unfolded. Let’s
see how things pan out going ahead.
Sectorally, the banking has certainly played its part in last few
sessions, and we expect it to continue in days to come. Apart
from this, the broader market is now providing ample of
opportunities to place bullish bets. Traders should focus on such
potential candidates in order to catch better moves.
Key Levels
Support 1 – 18400 Resistance 1 – 18550
Support 2 – 18345 Resistance 2 – 18650

www.angelone.in
Technical & Derivatives Report
DEC 13, 2022
View
Our market started the week on a timid note, taking
cues from not so favorable global peers. However, the
bulls retaliated from the lows and made a modest
recovery to trim down the losses and concluded the
day on a muted note.
FIIs were net sellers in the cash market segment to
the tune of Rs. 139 crores. Simultaneously, in Index
futures, they bought worth Rs. 658 crores with a fall in
open interest, indicating short covering.
Looking at the F&O data, we witnessed a mixed
position in both indices at the start of the week. A
strong piling up of positions is visible at the 18500-
18300 put strike, indicating nearby support for Nifty.
On the upside, maximum OI concentration is seen at
the 18600-call strike, followed by 18700 CE,
signifying intermediate resistance. Meanwhile, the
stronger hands have added some longs in the
system resulting in the expansion of ‘Long Short
Ratio’ to 60% from 58%. Considering the recent price
action, we would advocate traders to utilise intraday
declines to add fresh longs in the system.
Comments
The Nifty futures open interest has decreased by
2.84% and Bank Nifty futures open interest has
increased by 3.86% as the market closed at 18497.15.
The Nifty December future closed with a premium of
108.05 point against a premium of 87.05 point in the
last trading session. The January series closed at a
premium of 220.10 point.
The INDIA VIX decreased from 13.47 to 13.31. At the
same time, the PCR-OI of Nifty has increased to 0.91
from 0.76.
Few of the liquid counters where we have seen high
cost of carry are HONAUT, HINDPETRO, BPCL,
POLYCAB and GODREJCP.
Historical Volatility
SCRIP HV
IDEA 72.20
IBULHSGFIN 69.29
RBLBANK 67.72
GNFC 58.86
HINDCOPPER 58.31
Nifty Vs OI
17800
18000
18200
18400
18600
18800
19000
8,000
9,000
10,000
11,000
12,000
13,000
14,000
15,000
16,000
11/23 11/25 11/29 12/1 12/5 12/8 12/12
Openinterest Nifty
OI Gainers
SCRIP OI
OI
CHG. (%)
PRICE
PRICE
CHG. (%)
DALBHARAT 1624500 18.06 1906.30 3.34
UBL 1272800 15.33 1781.70 -0.01
METROPOLIS 1129300 12.35 1368.75 -3.27
HONAUT 38670 10.08 43392.00 4.77
NAVINFLUOR 490650 9.65 4206.95 -3.39
PERSISTENT 567825 9.64 4052.65 2.33
INDIGO 3194100 8.01 2053.95 3.10
RAMCOCEM 3842000 6.83 732.60 0.70
OI Losers
SCRIP OI
OI
CHG. (%)
PRICE
PRICE
CHG. (%)
PNB 230048000 -8.58 58.10 3.09
COALINDIA 26985000 -5.14 232.40 1.91
NAUKRI 1259750 -4.83 4049.95 1.14
INDHOTEL 32969052 -4.55 332.85 0.97
BERGEPAINT 6453700 -3.87 622.40 0.90
MGL 2803200 -3.63 878.20 0.86
BHEL 101892000 -3.29 86.75 1.28
BRITANNIA 1314000 -2.91 4432.55 0.30
Put-Call Ratio
SCRIP PCR (OI) PCR (VOL)
NIFTY 0.91 0.86
BANKNIFTY 1.15 0.94
RELIANCE 0.45 0.40
ICICIBANK 0.48 0.42
INFY 0.41 0.64
www.angelone.in
Technical & Derivatives Report
DEC 13, 2022
Note: Above mentioned Bullish or Bearish Spreads in Nifty (Dec Series) are given as an information and not as a recommendation.
Nifty Spot =
1
8
49
7
.
15
FII Statistics for
December
12
, 2022
Detail Buy
Contracts
Open
Interest
Value
(in Cr.)
Sell
Net
CHANGE
INDEX
FUTURES
2824.78 2167.15 657.63
169742 16640.96 (3.52)
INDEX
OPTIONS
1013798.59 1008987.70 4810.89
2280599 220081.32 10.45
STOCK
FUTURES
8528.70 8838.91 (310.21) 1947661 135891.58 0.43
STOCK
OPTIONS
9731.68 9549.49 182.19
152510 10855.01 1.01
Total 1034883.75
1029543.25
5340.50
4550512
383468.87
5.07
Turnover on
December
12
, 2022
Instrument
No. of
Contracts
Turnover
( in Cr. )
Change
(%)
Index
Futures
248719 2469198.02
-7.84
Index
Options
123641976 3728030.49
20.09
Stock
Futures
642043 4513612.16
-11.86
Stock
Options
2883152 292156.55 -26.30
Total
28,83,152 292156.55 -2.63
Bull-Call Spreads
Action Strike Price Risk Reward BEP
Buy
18500 244.95
60.65
39.35
18560.65
Sell
18600 184.30
Buy
18500 244.95
111.40
88.60
18611.40
Sell
18700 133.55
Buy
18600 184.30
50.75 49.25 18650.75
Sell 18700 133.55
Bear
-
Put Spreads
Action Strike Price Risk Reward BEP
Buy 18500 141.00
30.30
69.70
18469.70
Sell
18400 110.70
Buy 18500 141.00
55.85
144.15
18444.15
Sell 18300 85.15
Buy
18400 110.70
25.55 74.45 18374.45
Sell 18300 85.15
Nifty Put
-
Call Analysis
,0
500,000
1000,000
1500,000
2000,000
2500,000
3000,000
3500,000
4000,000
17900 18000 18100 18200 18300 18400 18500 18600 18700 18800 18900 19000 19100 19200
Call Put

www.angelone.in
Technical & Derivatives Report
DEC 13, 2022
`
Daily Pivot Levels for Nifty Constituents
Scrips
S2
S1
PIVOT
R1 R2
ADANIENT 3,943 3,980
4,006 4,043 4,069
ADANIPORTS
869
875
885
891
901
APOLLOHOSP 4,583 4,663
4,709 4,789
4,835
ASIANPAINT
3,091
3,129
3,179
3,217 3,268
AXISBANK
915
927
934
946
953
BAJAJ-AUTO 3,547 3,572
3,598
3,623
3,649
BAJFINANCE
6,332
6,419
6,479
6,566
6,626
BAJAJFINSV
1,555
1,573
1,589
1,607
1,623
BPCL 329 339
344
354
360
BHARTIARTL 819 824
830
835
842
BRITANNIA 4,363 4,398
4,419
4,453
4,474
CIPLA
1,083
1,090
1,100
1,107
1,117
COALINDIA 226 229
231
235
237
DIVISLAB 3,220 3,279
3,314
3,374
3,409
DRREDDY 4,332 4,392
4,427 4,488 4,523
EICHERMOT 3,254 3,287
3,320 3,353 3,386
GRASIM
1,760
1,788
1,804
1,831
1,847
HCLTECH
1,000
1,014
1,027
1,041
1,053
HDFCBANK
1,607
1,626
1,640
1,658
1,672
HDFCLIFE
569
573
575
579
582
HDFC
2,629
2,657
2,680 2,708
2,731
HEROMOTOCO
2,722
2,747
2,761
2,786
2,800
HINDALCO
449
455
461 468
474
HINDUNILVR
2,675
2,696
2,710
2,731 2,745
ICICIBANK
921
926
930
934
939
INDUSINDBK 1,183 1,195
1,207
1,219
1,232
INFY 1,512 1,530
1,548
1,565
1,584
ITC
339
341
342
345
346
JSW STEEL 722 732
737
746
751
KOTAKBANK
1,853
1,859
1,869
1,876
1,886
LT 2,121 2,143
2,156
2,177
2,190
M&M
1,245
1,255
1,266
1,275
1,287
MARUTI 8,445 8,552
8,623 8,730
8,801
NESTLEIND 20,009 20,248
20,384
20,623 20,759
NTPC
166
168
169
170
171
ONGC 138 140
141
144 145
POWERGRID
213
214
216
218
219
RELIANCE
2,569
2,591
2,607
2,629
2,645
SBILIFE
1,243
1,253
1,263
1,273
1,283
SBIN
607
610
614 618
622
SUNPHARMA 973 980
988
995
1,002
TCS
3,213
3,250
3,273
3,310 3,333
TATACONSUM
794
802
807
816 821
TATAMOTORS
404
409
413 418
422
TATASTEEL
107
110
111 113
114
TECHM 1,010 1,021
1,033
1,044
1,055
TITAN 2,547 2,566
2,590 2,608
2,632
ULTRACEMCO 6,900 7,023
7,094 7,217
7,287
UPL
750
761
768
780
787
WIPRO
384
390
394
400
403

www.angelone.in
Technical & Derivatives Report
DEC 13, 2022
*
Technical and Derivatives Team:
Sameet Chavan Chief Analyst – Technical & Derivatives sameet.chavan@angelone.in
Sneha Seth Senior Analyst – Technical & Derivatives sneha.seth@angelone.in
Rajesh Bhosale Technical Analyst rajesh.bhosle@angelone.in
Osho Krishan Senior Analyst – Technical & Derivatives osho.krishan@angelone.in
Research Team Tel: 022 – 39357600 Website: www.angelone.in
For Technical Queries E-mail: technicalresearch-cso@angelone.in
For Derivatives Queries E-mail: derivatives.desk@angelone.in
DISCLAIMER
Angel One Limited (hereinafter referred to as “Angel”) is a registered Member of National Stock Exchange of India Limited, Bombay
Stock Exchange Limited and Metropolitan Stock Exchange Limited. It is also registered as a Depository Participant with CDSL and
Portfolio Manager and investment advisor with SEBI. It also has registration with AMFI as a Mutual Fund Distributor. Angel One
Limited is a registered entity with SEBI for Research Analyst in terms of SEBI (Research Analyst) Regulations, 2014 vide registration
number INH000000164. Angel or its associates has not been debarred/ suspended by SEBI or any other regulatory authority for
accessing /dealing in securities Market.
This document is solely for the personal information of the recipient, and must not be singularly used as the basis of any investment
decision. Nothing in this document should be construed as investment or financial advice. Each recipient of this document should
make such investigations as they deem necessary to arrive at an independent evaluation of an investment in the securities of the
companies referred to in this document (including the merits and risks involved), and should consult their own advisors to determine
the merits and risks of such an investment.
Angel or its associates or research analyst or his relative may have actual/beneficial ownership of 1% or more in the securities of
the subject company at the end of the month immediately preceding the date of publication of the research report. Neither Angel or
its associates nor Research Analysts or his relative has any material conflict of interest at the time of publication of research report.
Angel or its associates might have received any compensation from the companies mentioned in the report during the period
preceding twelve months from the date of this report for services in respect of managing or co-managing public offerings, corporate
finance, investment banking or merchant banking, brokerage services or other advisory service in a merger or specific transaction
in the normal course of business. Angel or its associates did not receive any compensation or other benefits from the companies
mentioned in the report or third party in connection with the research report. Neither Angel nor its research analyst entity has been
engaged in market making activity for the subject company.
Reports based on technical and derivative analysis center on studying charts of a stock's price movement, outstanding positions and
trading volume, as opposed to focusing on a company's fundamentals and, as such, may not match with a report on a company's
fundamentals. Investors are advised to refer the Fundamental and Technical Research Reports available on our website to evaluate
the contrary view, if any.
The information in this document has been printed on the basis of publicly available information, internal data and other reliable
sources believed to be true, but we do not represent that it is accurate or complete and it should not be relied on as such, as this
document is for general guidance only. Angel One Limited or any of its affiliates/ group companies shall not be in any way responsible
for any loss or damage that may arise to any person from any inadvertent error in the information contained in this report. Angel One
Limited has not independently verified all the information contained within this document. Accordingly, we cannot testify, nor make
any representation or warranty, express or implied, to the accuracy, contents or data contained within this document. While Angel
One Limited endeavors to update on a reasonable basis the information discussed in this material, there may be regulatory,
compliance, or other reasons that prevent us from doing so.
This document is being supplied to you solely for your information, and its contents, information or data may not be reproduced,
redistributed or passed on, directly or indirectly.
Neither Angel One Limited, nor its directors, employees or affiliates shall be liable for any loss or damage that may arise from or in
connection with the use of this information. Angel or its associates or Research Analyst or his relative might have financial interest
in the subject company. Research analyst has not served as an officer, director or employee of the subject company.
