SEPT 13, 2022
www.angelone.in
Technical & Derivatives Report
xOOOOOOOO
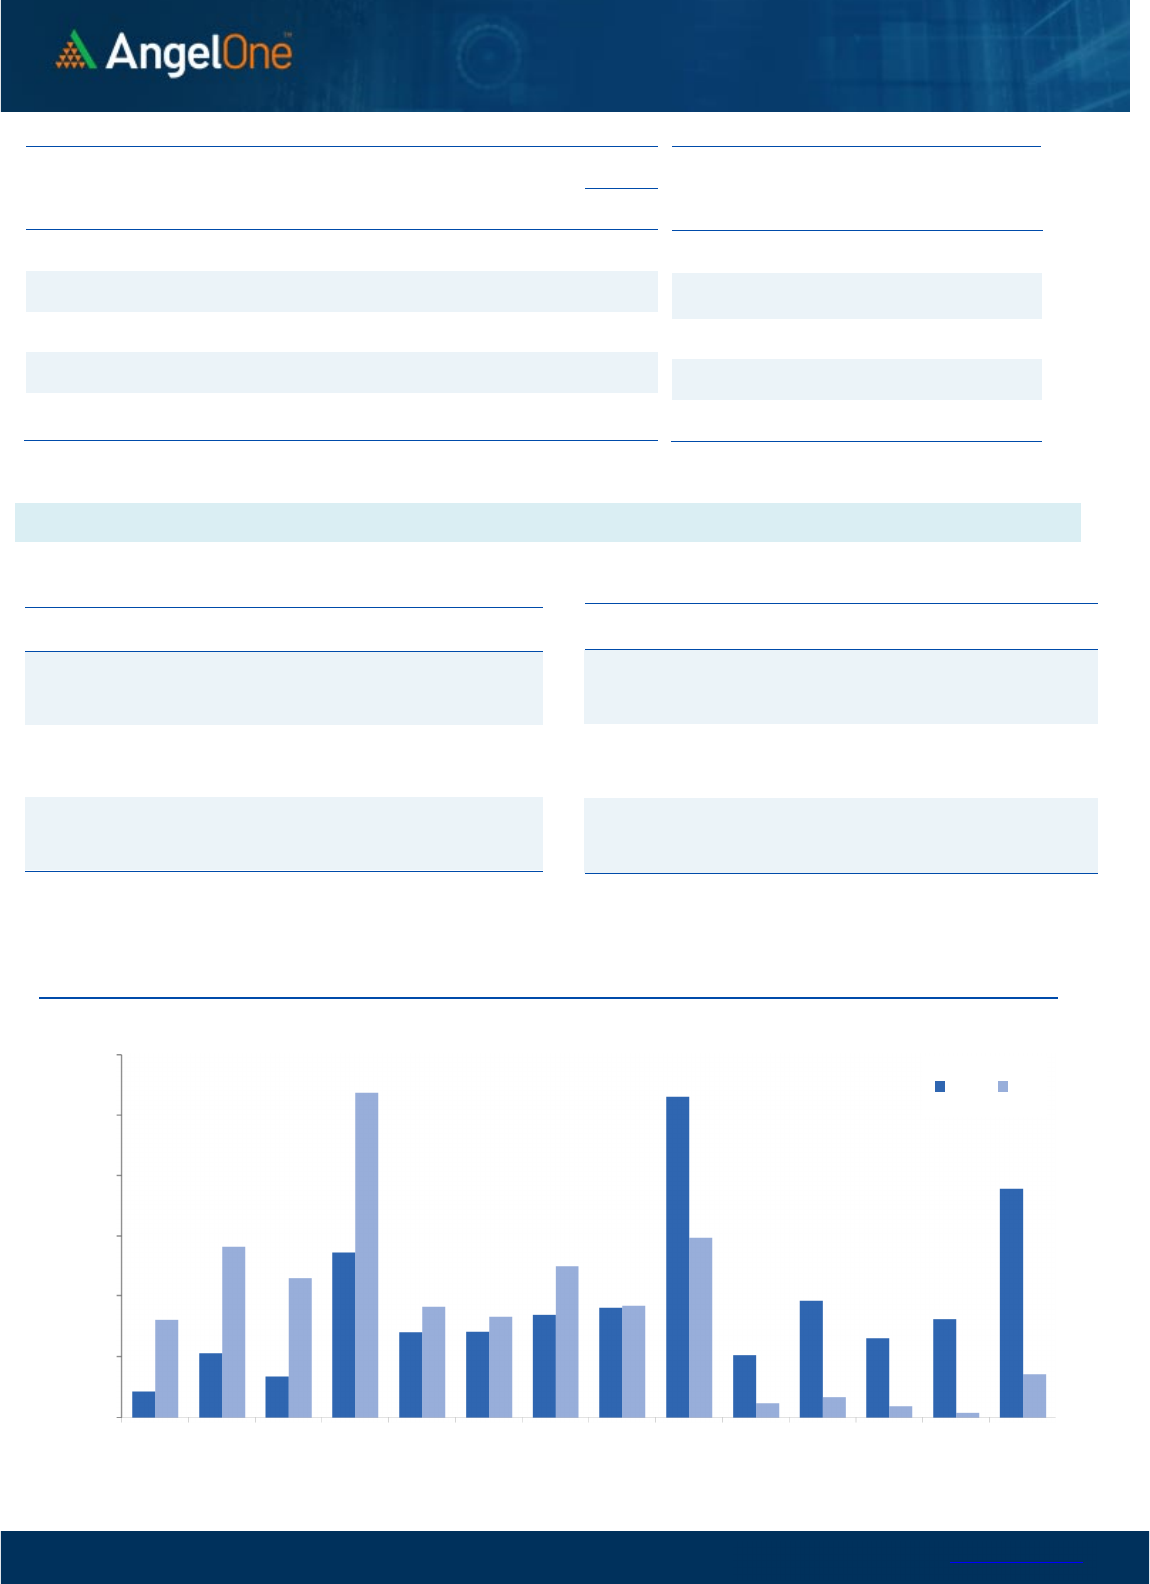
Nifty Bank Outlook (40574)
The week started on a positive note but post the initial surge there
was no major traction in the bank index. For the major part, the index
consolidated in a range and ended with gains of 0.34% at 40574.
The bank nifty has been the major contributor to the recent up move
in the broader markets and is placed in a sweet spot above the multi-
month breakout levels of 40000. We sense it is headed towards the
all-time high levels of 41829; hence any dip should be taken as a
buying opportunity. In such a scenario, immediate support is seen at
40280 and 40100 levels whereas resistance is seen at 40750 - 41000
levels.
Key Levels
Support 1 – 40280 Resistance 1 – 40750
Support 2 – 40100 Resistance 2 – 41000
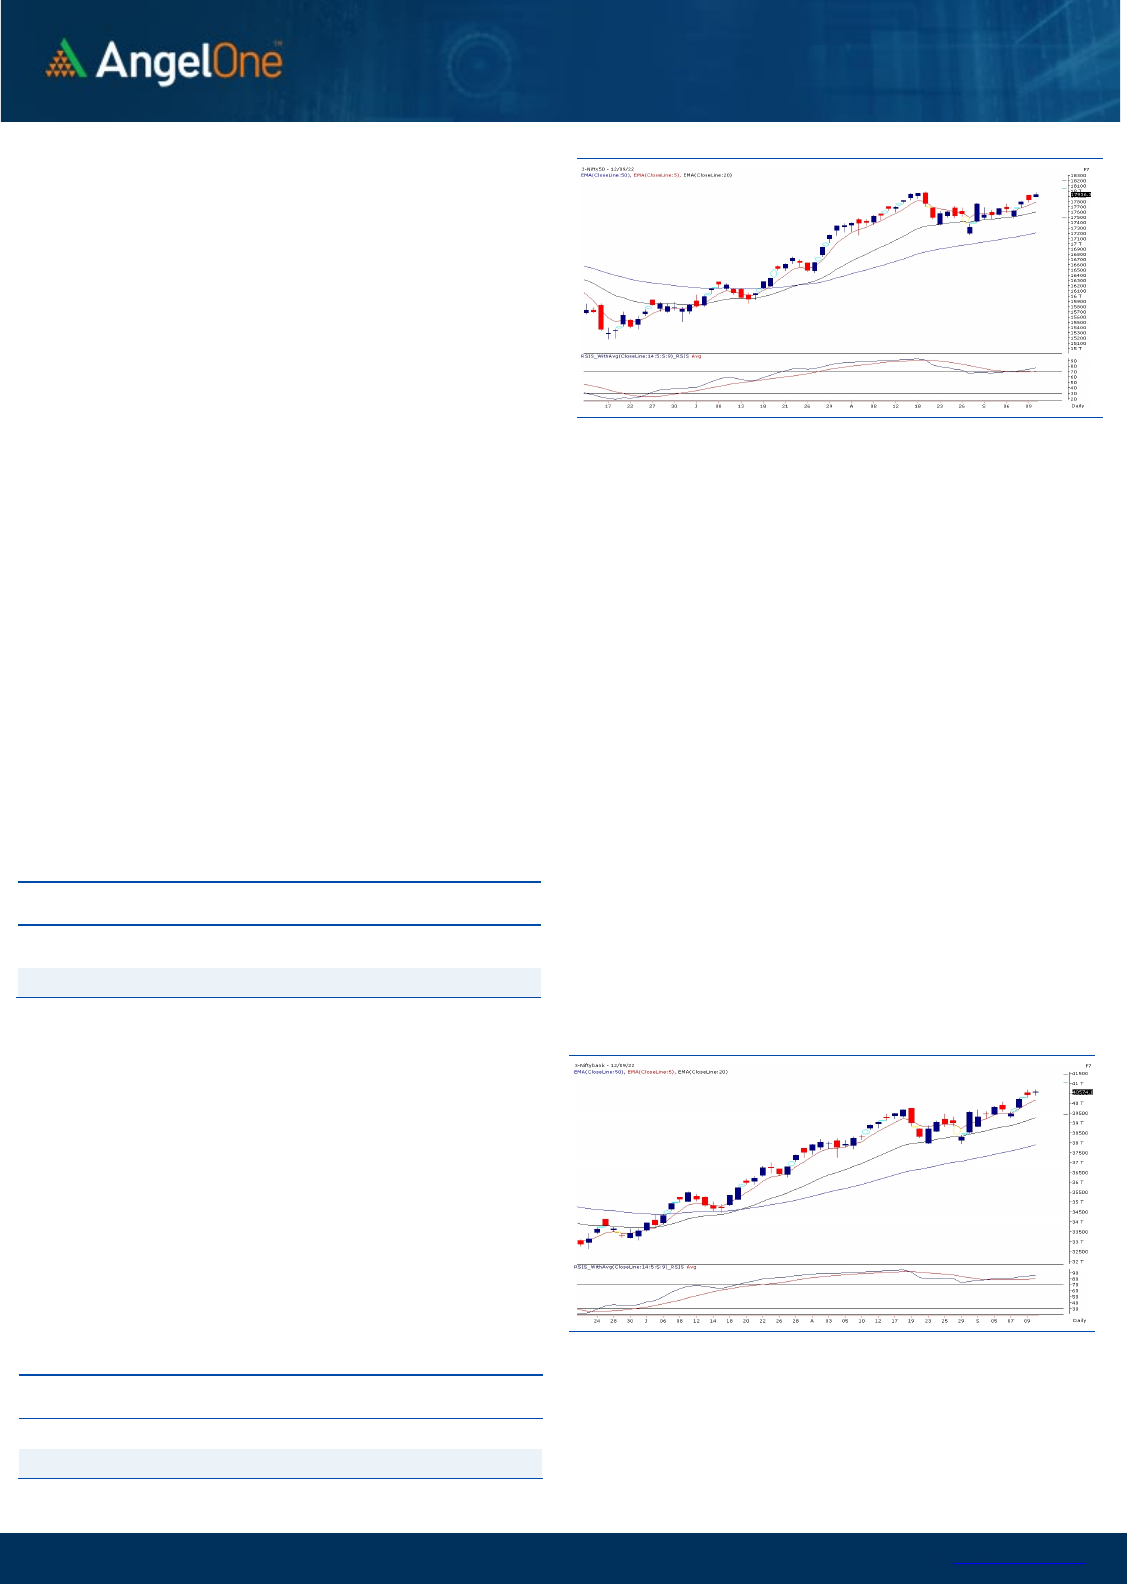
Exhibit 1: Nifty
Daily
Chart
Exhibit 2: Nifty Bank Daily Chart
Sensex (60115) / Nifty (17936)
The SGX Nifty was indicating a muted start yesterday morning. Despite
this, our benchmark index opened with a decent upside gap taking US
markets’ Friday’s rally into consideration. The opening lead got
extended in the initial hour itself beyond 17950. However, the
movement in most of the heavyweights became stagnant thereafter
and hence, the Nifty remained in a slender range throughout the
remaining part of the session. Eventually, it concluded with more than
half a percent gains convincingly above the 17900 mark.
Although, key indices are lacking a bit of momentum, the undertone
seems strongly bullish and as a result, the Nifty is now within a touching
distance of the psychological mark of 18000. It’s merely a formality
now, we would see it actually on the screen very soon. The real
question is, does market have enough legs to move beyond it to touch
the record highs. In our sense, it’s happening sooner or later. Before
this, a move towards 18200 – 18350 in near future is clearly on cards.
This view remains valid as long as Nifty defends 17700 – 17600 on a
closing basis.
Yesterday, the banking had a fantastic start but follow up was missing.
Never mind, we reckon, BANKNIFTY is headed towards its all time high
before the benchmark index. Also, the IT showed its willingness to
participate for the second straight session, which again is an
encouraging sign. In our sense, one should continue to remain positive
and even if key indices consolidates a bit, the stock specific action is
likely to continue.
Key Levels
Support 1 – 17800 Resistance 1 – 18000
Support 2 – 17750 Resistance 2 – 18140

www.angelone.in
Technical & Derivatives Report
SEPT 13, 2022
View
The Indian equity market has started the week on a
promising note amid the favorable global scenario. The
benchmark index Nifty gained over half a percent to
conclude the day a tad above the 17900 level.
FIIs were net buyers in the cash market segment to
the tune of Rs. 2050 crores. Simultaneously, in Index
futures, they bought worth Rs. 929 crores with a
decrease in open interest, indicating short covering.
Looking at the overall F&O data, we have witnessed a
long formation in both indices at the start of the week.
On the options front, piling up of positions is visible in
the 17800-17900 put strikes, indicating a shift in the
support base. While on the higher end, the maximum
OI concentration is seen at 18000 call strike, followed
by 18200 CE, indicating bullish biases. Meanwhile, the
stronger hands have seen adding up positions in cash
and future segments that also add a bullish quotient to
the market. Considering the data and recent price
action, the undertone is likely to remain bullish, and
any intraday dip could be seen as an opportunity to add
longs in the indices. Also, one should keep a close tab
on global developments.
Comments
The Nifty futures open interest has increased by
2.49%. and Bank Nifty futures open interest has
increased by 0.96% as the market closed at 17936.35.
The Nifty Sep future closed with a premium of 28
point against a premium of 33.10 point in the last
trading session. The Oct series closed at a premium
of 79.85 point.
The INDIA VIX increased from 17.71 to 17.93. At the
same time, the PCR-OI of Nifty has increased from
1.10 to 1.18.
Few of the liquid counters where we have seen high
cost of carry are ACC, HAL, NAVINFLUOR,
DEEPAKNTR and AMBUJACEM.
Historical Volatility
SCRIP HV
IDEA 82.05
RBLBANK 73.12
IBULHSGFIN 73.08
ZEEL 64.35
HINDCOPPER 63.20
Nifty Vs OI
17300
17400
17500
17600
17700
17800
17900
18000
18100
8,000
9,000
10,000
11,000
12,000
13,000
14,000
15,000
16,000
17,000
18,000
8/23 8/25 9/1 9/5 9/7 9/9
Openinterest Nifty
OI Gainers
SCRIP OI
OI
CHG. (%)
PRICE
PRICE
CHG. (%)
ATUL 208050 29.51 9614.50 4.19
JKCEMENT 388750 16.13 2850.35 0.51
IBULHSGFIN 50160000 14.90 134.65 -3.43
HAL 4192825 13.75 2613.95 7.35
AARTIIND 3220650 13.75 888.60 3.73
COALINDIA 37396800 13.64 231.50 -2.75
MFSL 2007200 13.40 786.95 -0.81
VOLTAS 5512000 13.12 966.90 0.22
OI Losers
SCRIP OI
OI
CHG. (%)
PRICE
PRICE
CHG. (%)
PVR 3309724 -10.08 1899.75 4.94
LTTS 934800 -8.21 3824.25 1.67
AMBUJACEM 76104000 -6.42 475.65 4.57
GNFC 6207500 -5.84 780.35 4.13
DIVISLAB 2990250 -5.62 3677.85 2.05
COFORGE 844800 -5.39 3618.05 1.45
JSWSTEEL 30199500 -4.90 686.55 -0.04
SYNGENE 4380000 -4.76 569.50 -0.31
Put-Call Ratio
SCRIP PCR (OI) PCR (VOL)
NIFTY 1.18 0.89
BANKNIFTY 1.05 0.96
RELIANCE 0.55 0.41
ICICIBANK 0.77 0.60
INFY 0.42 0.28
www.angelone.in
Technical & Derivatives Report
SEPT 13, 2022
Note: Above mentioned Bullish or Bearish Spreads in Nifty (Sep Series) are given as an information and not as a recommendation.
Nifty Spot =
17,
936
.
3
5
FII Statistics for
September
12
, 2022
Detail Buy
Contracts
Open
Interest
Value
(in Cr.)
Sell
Net
CHANGE
INDEX
FUTURES
2500.51 1571.60 928.91
134118 12621.44 (1.26)
INDEX
OPTIONS
166563.70 164768.02 1795.68
1363688 126891.03 5.57
STOCK
FUTURES
10793.19 11226.78 (433.59) 2104833 150924.90 (0.32)
STOCK
OPTIONS
6230.23 6235.92 (5.69) 171030 12478.08 4.79
Total 186087.63
183802.32
2285.31
3773669
302915.45
1.92
Turnover on
September
12
, 2022
Instrument
No. of
Contracts
Turnover
( in Cr. )
Change
(%)
Index
Futures
250943 23855.59 -15.94
Index
Options
65847866
6284219.50 -4.81
Stock
Futures
798222 58364.55 -12.15
Stock
Options
3120694 236070.48 -13.64
Total
31,20,694 236070.48 -5.27
Bull-Call Spreads
Action Strike Price Risk Reward BEP
Buy
17900 286.60
54.30
45.70
17954.30
Sell
18000 232.30
Buy
17900 286.60
102.70
97.30
18002.70
Sell
18100 183.90
Buy
18000 232.30
48.40 51.60 18048.40
Sell 18100 183.90
Bear
-
Put Spreads
Action Strike Price Risk Reward BEP
Buy 17900 225.60
39.10
60.90
17860.90
Sell
17800 186.50
Buy 17900 225.60
73.15
126.85
17826.85
Sell 17700 152.45
Buy
17800 186.50
34.05 65.95 17765.95
Sell 17700 152.45
Nifty Put
-
Call Analysis
,0
500,000
1000,000
1500,000
2000,000
2500,000
3000,000
17200 17300 17400 17500 17600 17700 17800 17900 18000 18100 18200 18300 18400 18500
Call Put

www.angelone.in
Technical & Derivatives Report
SEPT 13, 2022
`
Daily Pivot Levels for Nifty Constituents
Scrips
S2
S1
PIVOT
R1 R2
ADANIPORTS
900
919
931
950
962
APOLLOHOSP 4,422 4,452
4,477 4,507 4,532
ASIANPAINT 3,406 3,419
3,436 3,450 3,467
AXISBANK 779 790
798
808 816
BAJAJ-AUTO
3,797
3,834
3,862 3,898
3,927
BAJFINANCE
7,133
7,210
7,265
7,342
7,397
BAJAJFINSV
16,836
16,987
17,203
17,355
17,571
BPCL
335
339
342
346
349
BHARTIARTL
761
765
768
772
775
BRITANNIA
3,612
3,642
3,670
3,700 3,728
CIPLA
1,052
1,058
1,063
1,070
1,075
COALINDIA 222 227
233
238
244
DIVISLAB
3,571
3,625
3,656
3,710
3,741
DRREDDY
4,213
4,237
4,269 4,293
4,324
EICHERMOT
3,431
3,485
3,519
3,573
3,607
GRASIM
1,737
1,753
1,762
1,778
1,787
HCLTECH
948
952
958
962
968
HDFCBANK
1,482
1,488
1,496
1,502
1,510
HDFCLIFE 567 573
578
584
590
HDFC
2,401
2,410
2,423 2,433
2,446
HEROMOTOCO 2,828 2,843
2,856 2,871
2,885
HINDALCO
427
429
431 433
435
HINDUNILVR 2,555 2,568
2,586
2,599
2,617
ICICIBANK
900
904
906
910
912
INDUSINDBK 1,120 1,128
1,137 1,145
1,154
INFY 1,510 1,523
1,534
1,548
1,559
ITC 329 330
331
332
334
JSW STEEL 675 681
687
693
700
KOTAKBANK
1,902
1,913
1,929
1,939
1,955
LT
1,940
1,951
1,959
1,970
1,978
M&M
1,282
1,290
1,303
1,310
1,323
MARUTI 8,840 8,884
8,948
8,992 9,056
NESTLEIND
18,736
18,852
19,006
19,122
19,276
NTPC 164 165
167
168
169
ONGC
133
133
134 135
136
POWERGRID
221
223
224
225
226
RELIANCE 2,552 2,575
2,594 2,617
2,635
SBILIFE
1,288
1,297
1,304
1,313
1,320
SHREECEM 23,249 23,692
24,346
24,789
25,443
SBIN
548
551
555
559
562
SUNPHARMA
879
883
889
894
899
TCS
3,201
3,222
3,246
3,267
3,291
TATACONSUM
815 820
826
831
836
TATAMOTORS
444
448
450
454
456
TATASTEEL
106
107
107
108
109
TECHM 1,127 1,138
1,152 1,163 1,177
TITAN 2,587 2,624
2,647
2,684
2,707
ULTRACEMCO
6,677
6,773
6,837
6,933
6,997
UPL
738
747
753
762
768
WIPRO 415 419
421 425
428

www.angelone.in
Technical & Derivatives Report
SEPT 13, 2022
*
Technical and Derivatives Team:
Sameet Chavan Chief Analyst – Technical & Derivatives sameet.chavan@angelone.in
Sneha Seth Senior Analyst – Technical & Derivatives sneha.seth@angelone.in
Rajesh Bhosale Technical Analyst rajesh.bhosle@angelone.in
Osho Krishan Senior Analyst – Technical & Derivatives osho.krishan@angelone.in
Research Team Tel: 022 – 39357600 (Extn. 6844) Website: www.angelone.in
For Technical Queries E-mail: technicalresearch-cso@angelone.in
For Derivatives Queries E-mail: derivatives.desk@angelone.in
DISCLAIMER
Angel One Limited (hereinafter referred to as “Angel”) is a registered Member of National Stock Exchange of India Limited, Bombay
Stock Exchange Limited and Metropolitan Stock Exchange Limited. It is also registered as a Depository Participant with CDSL and
Portfolio Manager and investment advisor with SEBI. It also has registration with AMFI as a Mutual Fund Distributor. Angel One
Limited is a registered entity with SEBI for Research Analyst in terms of SEBI (Research Analyst) Regulations, 2014 vide registration
number INH000000164. Angel or its associates has not been debarred/ suspended by SEBI or any other regulatory authority for
accessing /dealing in securities Market.
This document is solely for the personal information of the recipient, and must not be singularly used as the basis of any investment
decision. Nothing in this document should be construed as investment or financial advice. Each recipient of this document should
make such investigations as they deem necessary to arrive at an independent evaluation of an investment in the securities of the
companies referred to in this document (including the merits and risks involved), and should consult their own advisors to determine
the merits and risks of such an investment.
Angel or its associates or research analyst or his relative may have actual/beneficial ownership of 1% or more in the securities of
the subject company at the end of the month immediately preceding the date of publication of the research report. Neither Angel or
its associates nor Research Analysts or his relative has any material conflict of interest at the time of publication of research report.
Angel or its associates might have received any compensation from the companies mentioned in the report during the period
preceding twelve months from the date of this report for services in respect of managing or co-managing public offerings, corporate
finance, investment banking or merchant banking, brokerage services or other advisory service in a merger or specific transaction
in the normal course of business. Angel or its associates did not receive any compensation or other benefits from the companies
mentioned in the report or third party in connection with the research report. Neither Angel nor its research analyst entity has been
engaged in market making activity for the subject company.
Reports based on technical and derivative analysis center on studying charts of a stock's price movement, outstanding positions and
trading volume, as opposed to focusing on a company's fundamentals and, as such, may not match with a report on a company's
fundamentals. Investors are advised to refer the Fundamental and Technical Research Reports available on our website to evaluate
the contrary view, if any.
The information in this document has been printed on the basis of publicly available information, internal data and other reliable
sources believed to be true, but we do not represent that it is accurate or complete and it should not be relied on as such, as this
document is for general guidance only. Angel One Limited or any of its affiliates/ group companies shall not be in any way responsible
for any loss or damage that may arise to any person from any inadvertent error in the information contained in this report. Angel One
Limited has not independently verified all the information contained within this document. Accordingly, we cannot testify, nor make
any representation or warranty, express or implied, to the accuracy, contents or data contained within this document. While Angel
One Limited endeavors to update on a reasonable basis the information discussed in this material, there may be regulatory,
compliance, or other reasons that prevent us from doing so.
This document is being supplied to you solely for your information, and its contents, information or data may not be reproduced,
redistributed or passed on, directly or indirectly.
Neither Angel One Limited, nor its directors, employees or affiliates shall be liable for any loss or damage that may arise from or in
connection with the use of this information. Angel or its associates or Research Analyst or his relative might have financial interest
in the subject company. Research analyst has not served as an officer, director or employee of the subject company.
