March 13, 2023
www.angelone.in
Technical & Derivatives Report
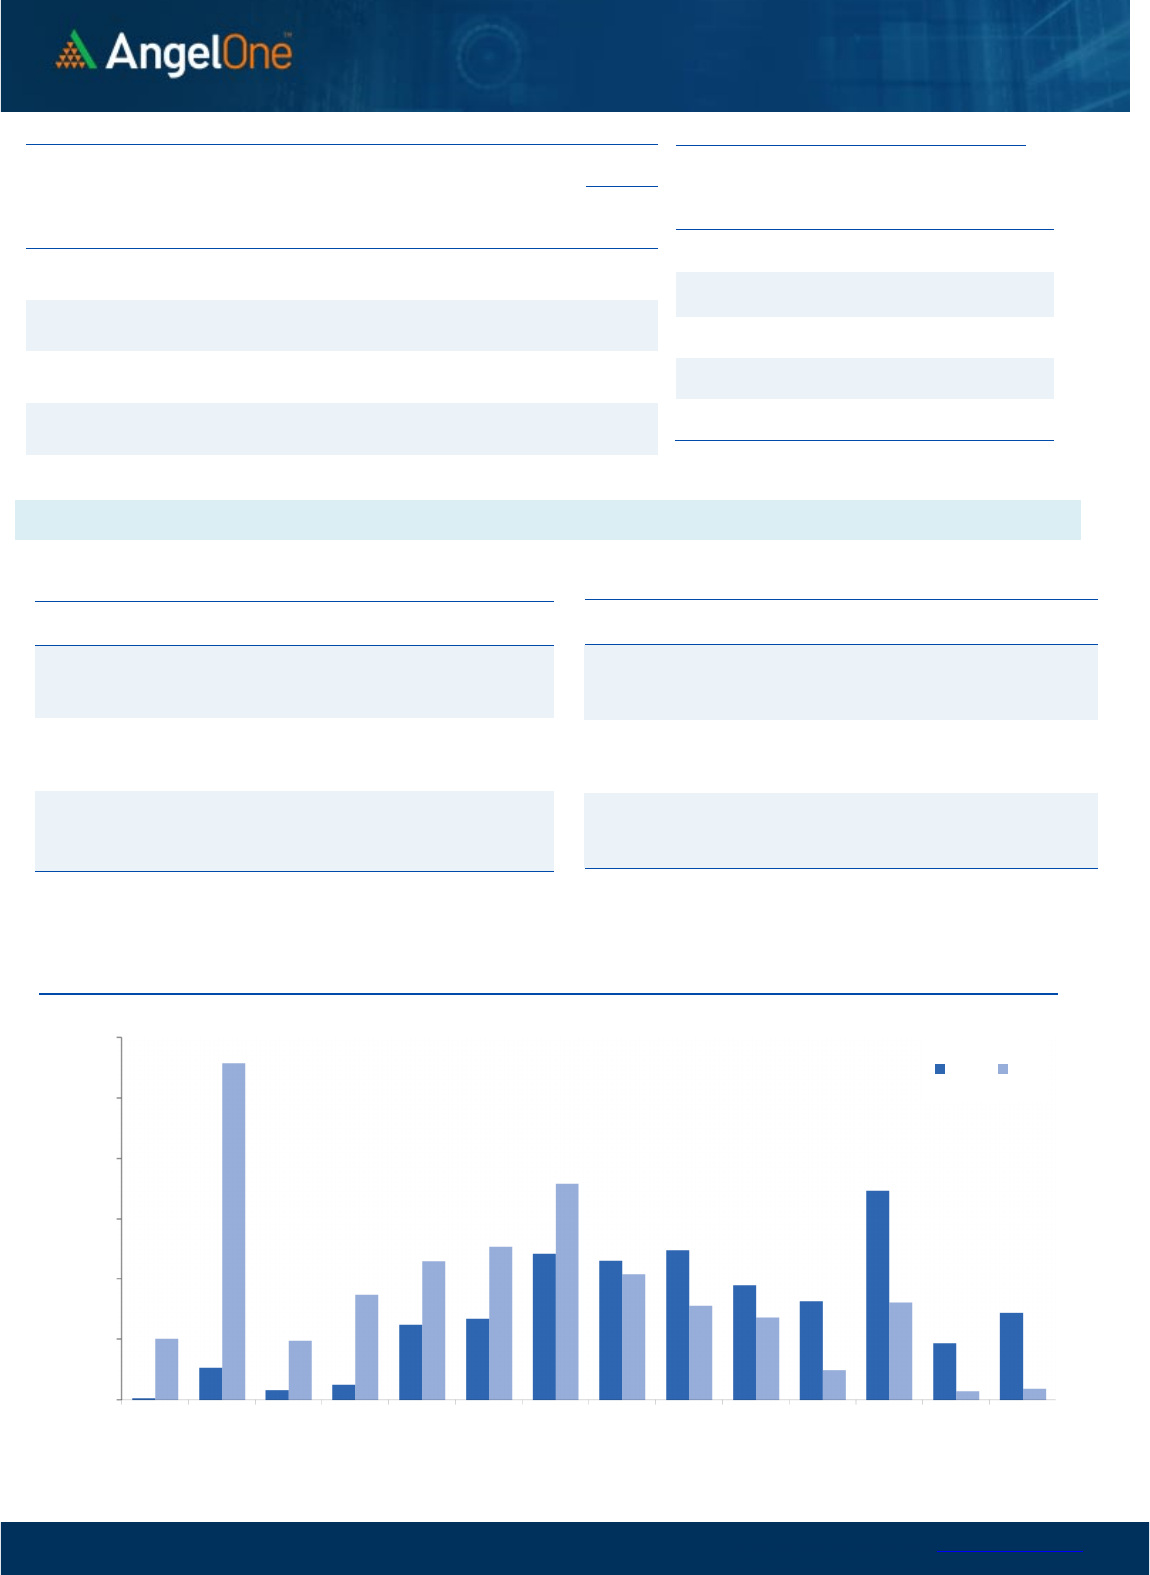
Nifty Bank
Outlook (
4
0485
)
We had a gap down opening tad below 40800 on Friday and follow-
up selling dragged the index towards 40350. Finally, we settled the
week with a cut of almost two percent tad below 40500.
The sell-off seen on Friday has certainly dampened the overall
sentiments, especially in the banking index which was clearly
showing resilience in previous couple of sessions. However, we are
currently hovering around the 61.8% retracement of the recent
rally and going ahead, it would be important to see how things pan
out in this week. We expect 40000 – 39700 to provide cushion to
any weakness and banking stocks to provide the helping hand at
lower levels. On the flipside, 40800 followed by 41200 are to be
seen as immediate resistances. A move beyond this would certainly
bring back the strength in this space which can uplift the overall
market sentiments. Next few trading sessions are to be the crucial
one as it would set the near-term path for our markets.
Key Levels
Support 1 – 40000 Resistance 1 – 40800
Support 2 – 39700 Resistance 2 – 41200
Exhibit 1: Nifty Daily Chart
Exhibit 2: Nifty Bank Daily Chart
Sensex (
59
135
) / Nifty (
1
7
413
)
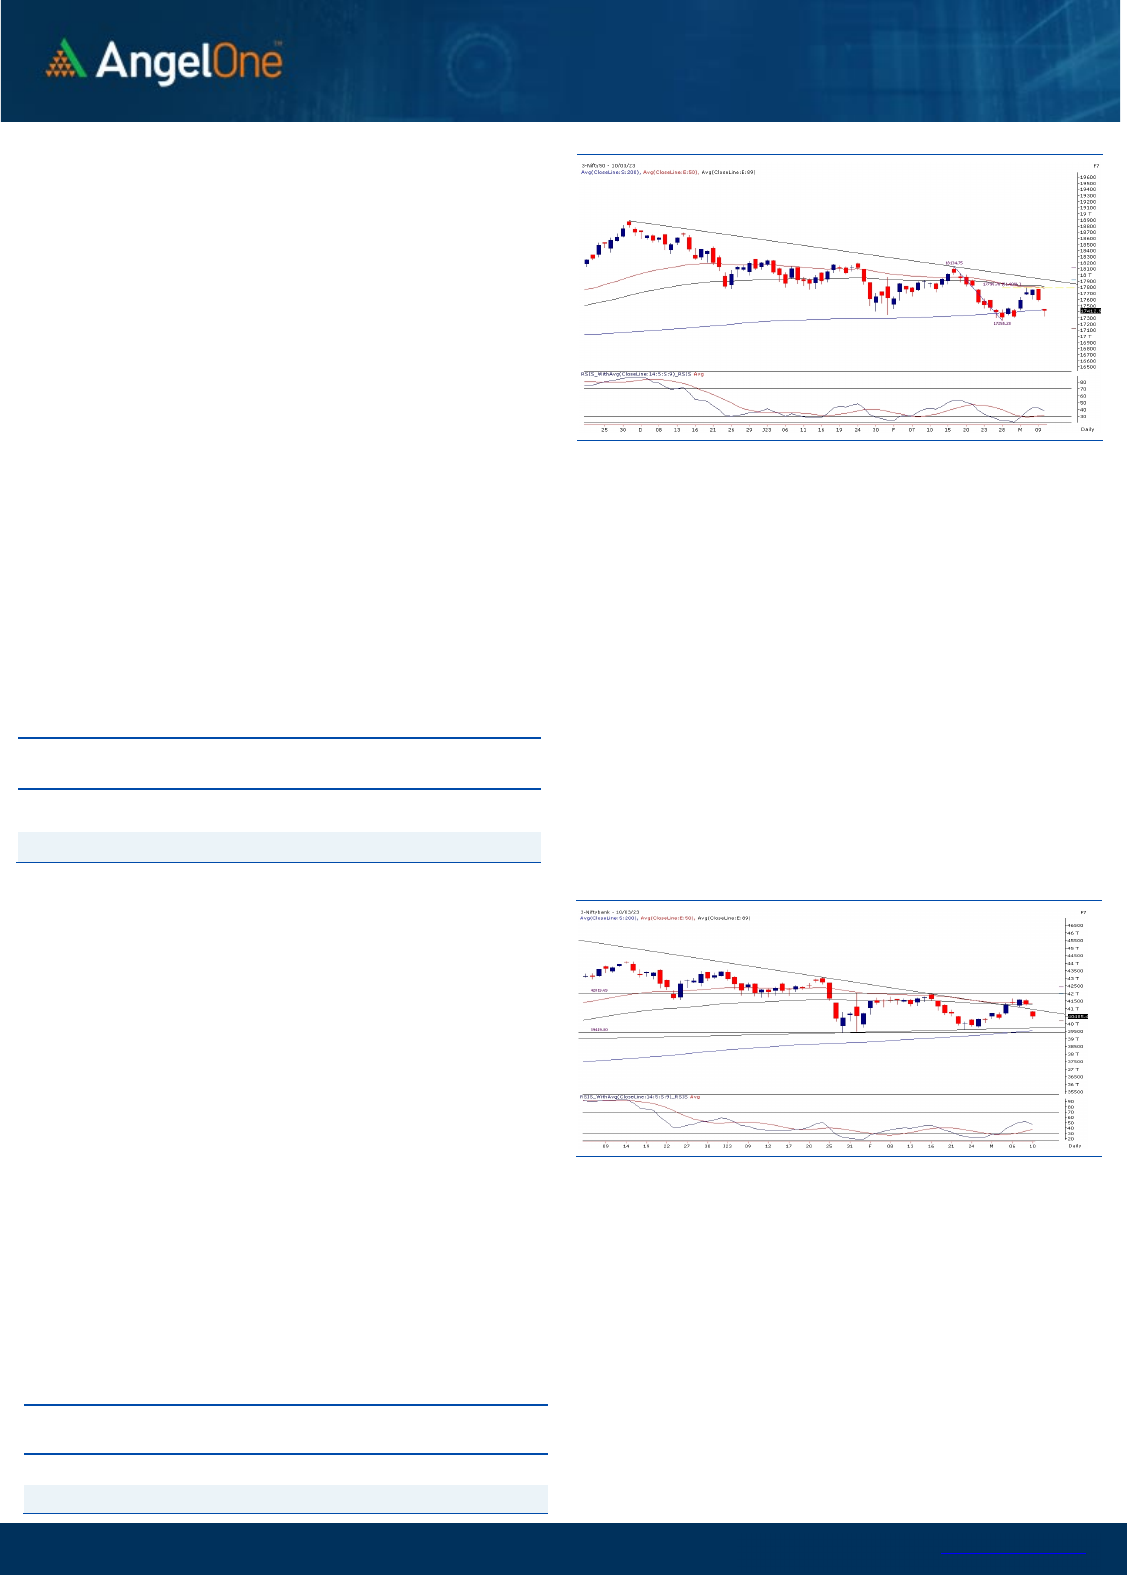
On Friday, SGX Nifty was indicating a gap down opening and in line
with this, our markets had a big gap down opening. As the day
progressed further weakness was seen to retest sub-17350 levels.
Eventually after some respite Nifty ended a tad above 17400 with a
weekly loss of a percent.
Now, with two back-to-back weak sessions, the momentum is again
in favor of the bears. Despite this, we remain a bit hopeful and
expect important levels to remain unbroken in this week; especially
after seeing prices showing resilience around the 200-SMA and
forming a key technical pattern known as ‘Bullish Hammer’. It would
however be very early to jump to any conclusion and considering
the recent volatility, traders should ideally wait for the trend to
establish. In such a scenario, Friday’s low around 17320 would be
seen as immediate support followed by sacrosanct support at
February's swing low of 17250. On the flip side, the bearish gap left
around 17570 – 17600 should be considered an immediate hurdle.
In our sense, instead of swaying on both sides of the trend, traders
should ideally prefer staying light on positions and keep
accumulating quality propositions in a staggered manner.
Key Levels
Support 1 – 17320 Resistance 1 – 17570
Support 2 – 17250 Resistance 2 – 17600
The weak global cues and underperforming heavyweights
(especially Reliance) were the major culprits in dragging our
markets down. Going ahead, it would be crucial to keep a close
tab on them as any positive development globally, can elevate
the overall sentiments. Also, Nifty Midcap 100 outperformed as
this index ended the week in green, forming a ‘hammer’ pattern
around the recent trend line breakout levels. If the markets find
some relief, we may see many midcap counters giving
mesmerizing moves. Traders are advised to focus on such
counters that are likely to provide better trading opportunities.

www.angelone.in
Technical &
Derivatives Report
March 13, 2023
View
It was a roller coaster ride for our market, as we
kickstarted the week on a promising note. But the
last two sessions not only pared down the initial
gains but dented the overall sentiments, with Nifty
shedding over a percent on a weekly basis.
FIIs were net sellers in the cash market segment to
the tune of Rs. 2061 crores. Simultaneously, in Index
futures, they sold worth Rs. 1603 crores with an
increase in open interest, indicating short addition.
Looking at the F&O data, we witnessed short
formation in both key indices on a WoW basis. On
the options front, a decent piling of OI is seen at the
17400 put strike, followed by 17300 PE, indicating
nearby support for Nifty. On the flip side, the 17500-
call strike has the highest OI concentration, implying
an immediate hurdle. Meanwhile, the stronger
hands have added shorts in the system, leading the
‘Long Short Ratio’ to plunge to 16% from 23% WoW.
Considering the mentioned data, the market seems
a bit oversold, and any short covering shall be an
encouraging sign in a comparable period.
Comments
The Nifty futures open interest has increased by 4.64%
and Bank Nifty futures open interest has increased by
1.21% as the market closed at 17412.90.
The Nifty March future closed with a premium of 39.65
point against a premium of 55.50 point in the last
trading session. The April series closed at a premium of
147.15 point.
The INDIA VIX increased from 12.72 to 13.41. At the
same time, the PCR-OI of Nifty has increased from 0.85
to 0.89.
Few of the liquid counters where we have seen high
cost of carry are POLYCAB, HDFCBANK, RECLTD, CANBK,
AND INDIAMART.
Historical Volatility
SCRIP HV
ADANIENT 94.39
IDEA 70.58
IBULHSGFIN 66.96
RBLBANK 63.66
ADANIPORTS 59.90
Nifty Vs OI
17200
17300
17400
17500
17600
17700
17800
17900
18000
18100
18200
4,000
6,000
8,000
10,000
12,000
14,000
16,000
2/16 2/20 2/23 2/27 3/1 3/3 3/8 3/10
Openinterest Nifty
OI Gainers
SCRIP OI
OI
CHG. (%)
PRICE
PRICE
CHG. (%)
POLYCAB 1248900 10.40 2946.95 -4.97
PERSISTENT 973000 10.32 4749.40 -1.95
UBL 1203600 8.39 1441.20 0.23
RBLBANK 30585000 8.13 154.90 -3.27
IPCALAB 1939600 6.31 798.65 0.09
PVR 2512004 5.74 1519.05 -1.72
RELIANCE 40967750 5.30 2322.70 -1.64
DIXON 730875 4.60 2886.90 1.74
OI Losers
SCRIP OI
OI
CHG. (%)
PRICE
PRICE
CHG. (%)
MGL 17600 -6.39 986.30 -0.77
LT 8247000 -4.80 2157.85 -1.54
GNFC 8951800 -4.36 545.00 -2.56
INDIGO 3496500 -4.29 1889.80 0.96
OFSS 280000 -4.18 3242.15 0.47
BALRAMCHIN 8147200 -3.87 399.35 0.13
ONGC 39963000 -3.76 155.80 -0.51
ATUL 140175 -3.66 6993.50 0.80
Put-Call Ratio
SCRIP PCR (OI) PCR (VOL)
NIFTY 0.89 0.91
BANKNIFTY 0.66 0.99
RELIANCE 0.52 0.52
ICICIBANK 0.60 0.68
INFY 0.45 0.43
www.angelone.in
Technical &
Derivatives Report
March 13, 2023
Note: Above mentioned Bullish or Bearish Spreads in Nifty (March Series) are given as an information and not as a recommendation.
Nifty Spot =
1
7
412
.
9
0
0900
Lot Size = 75
FII Statistics for
March
10
, 202
3
Detail Buy
Contracts
Open
Interest
Value
(in Cr.)
Sell
Net
CHANGE
INDEX
FUTURES
5060.53 6663.82 (1603.29) 178633 16173.74 2.42
INDEX
OPTIONS
1013971.47 1010512.35 3459.12
2378593 214660.21 37.18
STOCK
FUTURES
8729.59 11130.10 (2400.51) 2182564 144290.19 0.80
STOCK
OPTIONS
11485.41 11295.49 189.92
157139 10390.22 2.67
Total 1039247.00
1039601.76
(354.76) 4896929
385514.36
15.86
Turnover
on
March
10
, 202
3
Instrument
No. of
Contracts
Turnover
( in Cr. )
Change
(%)
Index Futures
403135 38083.20
39.06
Index Options
132041973
50048.07
-3.51
Stock Futures
693351 46441.63
11.18
Stock Options
2839312 3008.42 -5.99
Total
28,39,312 3008.42 10.75
Bull-Call Spreads
Action Strike Price Risk Reward BEP
Buy
17600 214.00
55.70
44.30
17455.70
Sell
17700 159.50
Buy
17600 214.00
102.85
97.15
17502.85
Sell
17800 115.65
Buy
17700 159.50
47.15 52.85 17547.15
Sell
17800 115.65
Bear-Put Spreads
Action Strike Price Risk Reward BEP
Buy
17600 169.05
41.10
58.90
17458.90
Sell 17500 132.55
Buy 17600 169.05
77.95
122.05
17422.05
Sell
17400 103.35
Buy
17500 132.55
36.85 63.15 17363.15
Sell 17400 103.35
Nifty Put-Call Analysis
,0
1000,000
2000,000
3000,000
4000,000
5000,000
6000,000
16900 17000 17100 17200 17300 17400 17500 17600 17700 17800 17900 18000 18100 18200
Call Put

www.angelone.in
Technical &
Derivatives Report
March 13, 2023
`
Daily
Pivot Levels for Nifty Constituents
Scrips
S2
S1
PIVOT
R1
R2
ADANIENT
1,766
1,831
1,886
1,951
2,005
ADANIPORTS 672 685
693
706
715
APOLLOHOSP
4,228
4,273
4,336
4,381
4,444
ASIANPAINT
2,790
2,810
2,827
2,847
2,864
AXISBANK 837 844
853
861
869
BAJAJ-AUTO
3,774
3,798
3,822
3,846
3,869
BAJFINANCE
5,741
5,808
5,848
5,914
5,954
BAJAJFINSV
1,310
1,319
1,331
1,340
1,352
BPCL 317 322
325
329
332
BHARTIARTL 763 768
774
779
784
BRITANNIA
4,240
4,275
4,319
4,354
4,398
CIPLA 866 873
879
887
892
COALINDIA 220 222
224
226
228
DIVISLAB
2,746
2,767
2,800
2,821
2,854
DRREDDY
4,323
4,359
4,386
4,422
4,449
EICHERMOT
3,067
3,092
3,119
3,144
3,172
GRASIM
1,572
1,584
1,595
1,607
1,619
HCLTECH
1,100
1,108
1,113
1,121
1,126
HDFCBANK
1,567
1,578
1,596
1,607
1,625
HDFCLIFE
482
486
489
493
495
HDFC
2,554
2,581
2,616
2,643
2,678
HEROMOTOCO
2,391
2,416
2,430
2,454
2,468
HINDALCO 389 398
404
412
418
HINDUNILVR
2,435
2,450
2,460
2,476
2,486
ICICIBANK 832 837
841
847
851
INDUSINDBK
1,124
1,134
1,148
1,159
1,173
INFY
1,451
1,461
1,468
1,478
1,484
ITC 381 384
387
391
394
JSW STEEL 660 670
676
685
691
KOTAKBANK
1,680
1,690
1,702
1,711
1,723
LT
2,109
2,133
2,158
2,182
2,207
M&M
1,205
1,216
1,236
1,247
1,268
MARUTI
8,422
8,512
8,570
8,660
8,718
NESTLEIND
18,282
18,384
18,457
18,559
18,632
NTPC 177 179
180
182
183
ONGC 153 154
156
157
158
POWERGRID 220 223
226
229
232
RELIANCE
2,298
2,311
2,327
2,339
2,356
SBILIFE
1,077
1,086
1,093
1,103
1,110
SBIN 539 543
549
553
559
SUNPHARMA 942 949
953
960
964
TCS
3,272
3,302
3,319
3,349
3,367
TATACONSUM
696 700
705
709
714
TATAMOTORS 428 432
435
439
442
TATASTEEL 106 107
108
109
109
TECHM
1,033
1,047
1,055
1,069
1,077
TITAN
2,323
2,349
2,364
2,391
2,406
ULTRACEMCO
7,095
7,161
7,202
7,267
7,308
UPL 701 706
711
716
720
WIPRO 385 387
389
390
392

www.angelone.in
Technical &
Derivatives Report
March 13, 2023
*
Technical and Derivatives Team:
Sameet Chavan Chief Analyst – Technical & Derivatives sameet.chavan@angelone.in
Sneha Seth Senior Analyst – Technical & Derivatives sneha.seth@angelone.in
Rajesh Bhosale Technical Analyst rajesh.bhosle@angelone.in
Osho Krishan Senior Analyst – Technical & Derivatives osho.krishan@angelone.in
Research Team Tel: 022 – 39357600 Website: www.angelone.in
For Technical Queries E-mail: technicalresearch-cso@angelone.in
For Derivatives Queries E-mail: derivatives.desk@angelone.in
DISCLAIMER
Angel One Limited (hereinafter referred to as “Angel”) is a registered Member of National Stock Exchange of India Limited, Bombay Stock Exchange
Limited and Metropolitan Stock Exchange Limited. It is also registered as a Depository Participant with CDSL and Portfolio Manager and investment
advisor with SEBI. It also has registration with AMFI as a Mutual Fund Distributor. Angel One Limited is a registered entity with SEBI for Research
Analyst in terms of SEBI (Research Analyst) Regulations, 2014 vide registration number INH000000164. Angel or its associates has not been
debarred/ suspended by SEBI or any other regulatory authority for accessing /dealing in securities Market.
This document is solely for the personal information of the recipient, and must not be singularly used as the basis of any investment decision.
Nothing in this document should be construed as investment or financial advice. Each recipient of this document should make such investigations
as they deem necessary to arrive at an independent evaluation of an investment in the securities of the companies referred to in this document
(including the merits and risks involved), and should consult their own advisors to determine the merits and risks of such an investment.
Angel or its associates or research analyst or his relative may have actual/beneficial ownership of 1% or more in the securities of the subject
company at the end of the month immediately preceding the date of publication of the research report. Neither Angel or its associates nor
Research Analysts or his relative has any material conflict of interest at the time of publication of research report.
Angel or its associates might have received any compensation from the companies mentioned in the report during the period preceding twelve
months from the date of this report for services in respect of managing or co-managing public offerings, corporate finance, investment banking or
merchant banking, brokerage services or other advisory service in a merger or specific transaction in the normal course of business. Angel or its
associates did not receive any compensation or other benefits from the companies mentioned in the report or third party in connection with the
research report. Neither Angel nor its research analyst entity has been engaged in market making activity for the subject company.
Reports based on technical and derivative analysis center on studying charts of a stock's price movement, outstanding positions and trading
volume, as opposed to focusing on a company's fundamentals and, as such, may not match with a report on a company's fundamentals. Investors
are advised to refer the Fundamental and Technical Research Reports available on our website to evaluate the contrary view, if any.
The information in this document has been printed on the basis of publicly available information, internal data and other reliable sources believed
to be true, but we do not represent that it is accurate or complete and it should not be relied on as such, as this document is for general guidance
only. Angel One Limited or any of its affiliates/ group companies shall not be in any way responsible for any loss or damage that may arise to any
person from any inadvertent error in the information contained in this report. Angel One Limited has not independently verified all the information
contained within this document. Accordingly, we cannot testify, nor make any representation or warranty, express or implied, to the accuracy,
contents or data contained within this document. While Angel One Limited endeavors to update on a reasonable basis the information discussed
in this material, there may be regulatory, compliance, or other reasons that prevent us from doing so.
This document is being supplied to you solely for your information, and its contents, information or data may not be reproduced, redistributed or
passed on, directly or indirectly.
Neither Angel One Limited, nor its directors, employees or affiliates shall be liable for any loss or damage that may arise from or in connection
with the use of this information. Angel or its associates or Research Analyst or his relative might have financial interest in the subject company.
Research analyst has not served as an officer, director or employee of the subject company.
