DEC 12, 2022
www.angelone.in
Technical & Derivatives Report
xOOOOOOOO
Nifty Bank Outlook (43633)
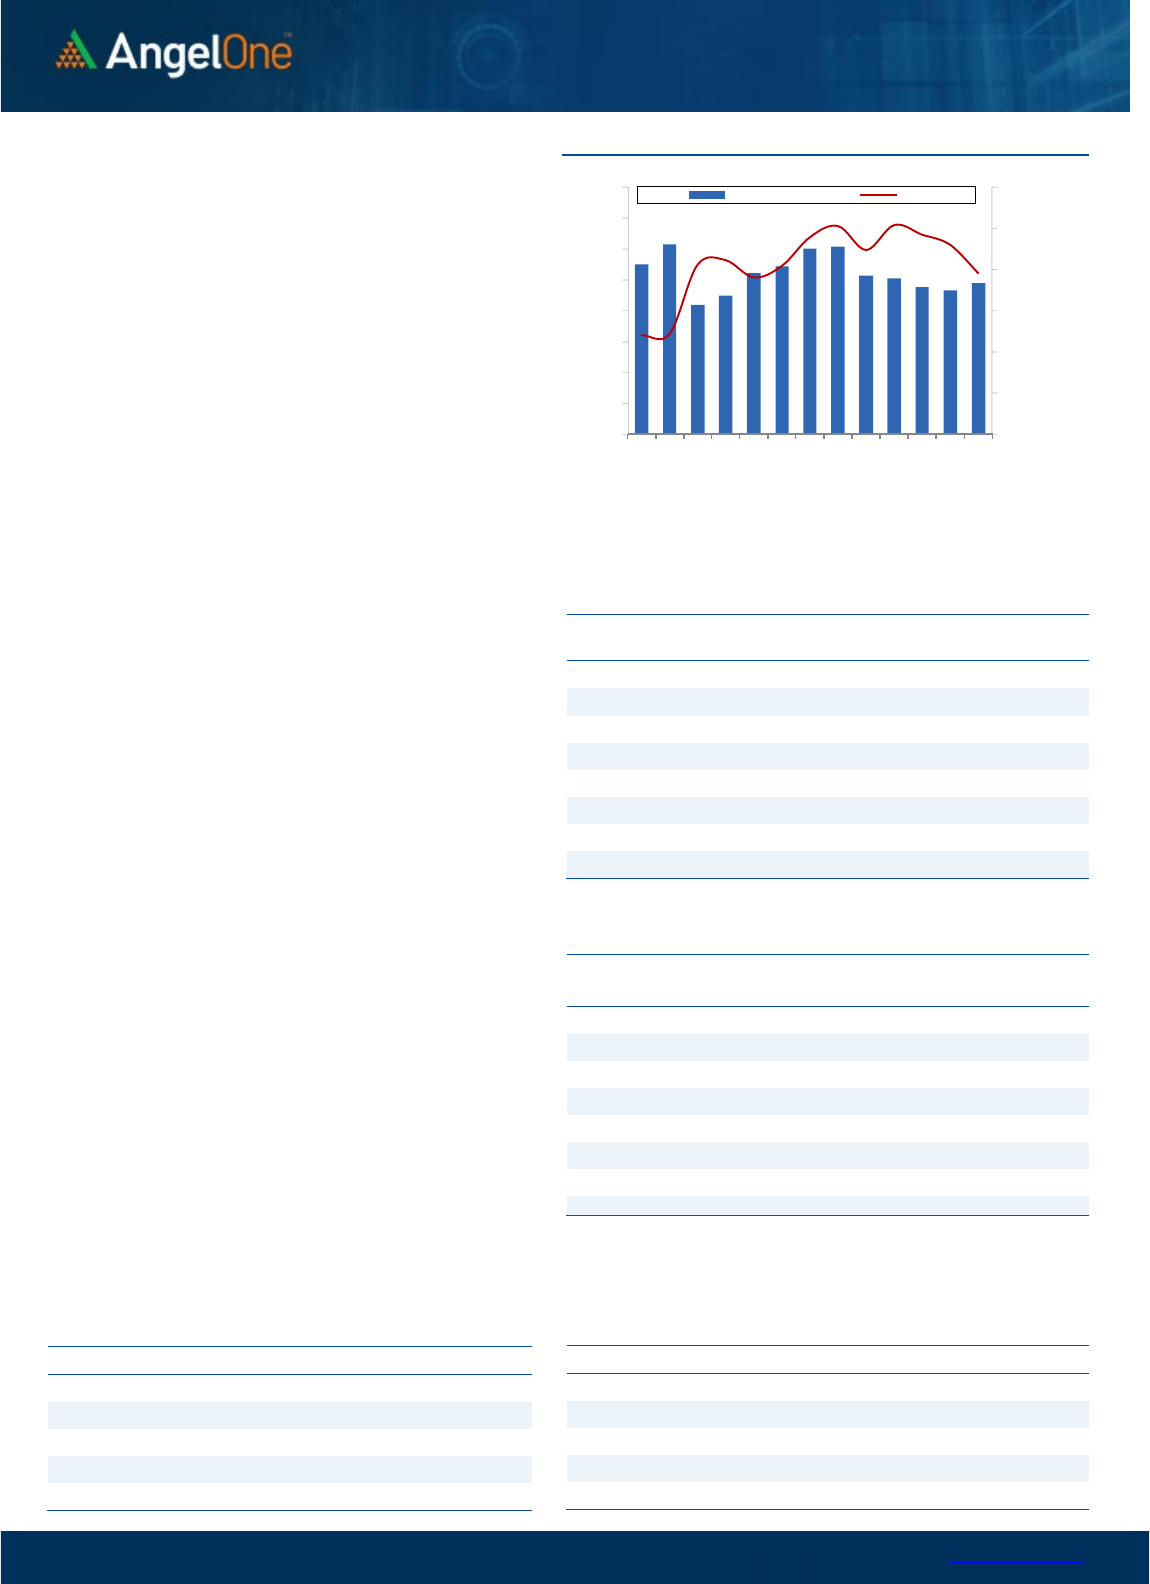
The unprecedented move of the Bank Nifty index continued for the
tenth consecutive week and settled at new lifetime high levels. The
spectacular move in the PSU bank index contributed to the
upliftment of the sentiments and helped the Bank Nifty index to
continue its northward journey. The index concluded the week
with gains of over 1.20 percent and settled at new highs, a tad
above 43600 levels. On the technical aspect, the index is in a cycle
of higher highs – higher lows, which signifies a positive
development. The ongoing price action construes a robust setup
for the index and is highly anticipated to continue the same in a
comparable period. As far as levels are concerned, 43000-42900 is
likely to cushion any intra-week blip, followed by the sacrosanct
support of the unfilled gap of 42550-42500. On the flip side, the
fresh breakout has opened the potential for the index to march
toward the 44000-44500 mark in the coming period. The overall
structure is buoyant, where any minor correction could be seen as
an opportunity to add fresh longs in the index.
Key Levels
Support 1 – 43350 Resistance 1 – 43900
Support 2 – 43200 Resistance 2 – 44200
Exhibit 1: Nifty
Daily
Chart
Exhibit 2: Nifty Bank
Daily
Chart
Sensex (62182) / Nifty (18497)
During the last week, our markets started on a flat note in absence
of global as well as domestic triggers. As the week progressed, key
indices continue to remain in a slumber phase. During the mid-week
RBI monetary policy, it appeared as if the Governor dented the
sentiments; but immediately on the next day, the banking space
proved its significance as we saw BANKNIFTY clocking new highs
towards the fag end of the week. On Friday, IT counters became the
spoilsport by dragging Nifty below the 18500 mark. Fortunately, the
tail end recovery pulled Nifty from lower levels to defend 18400
convincingly.
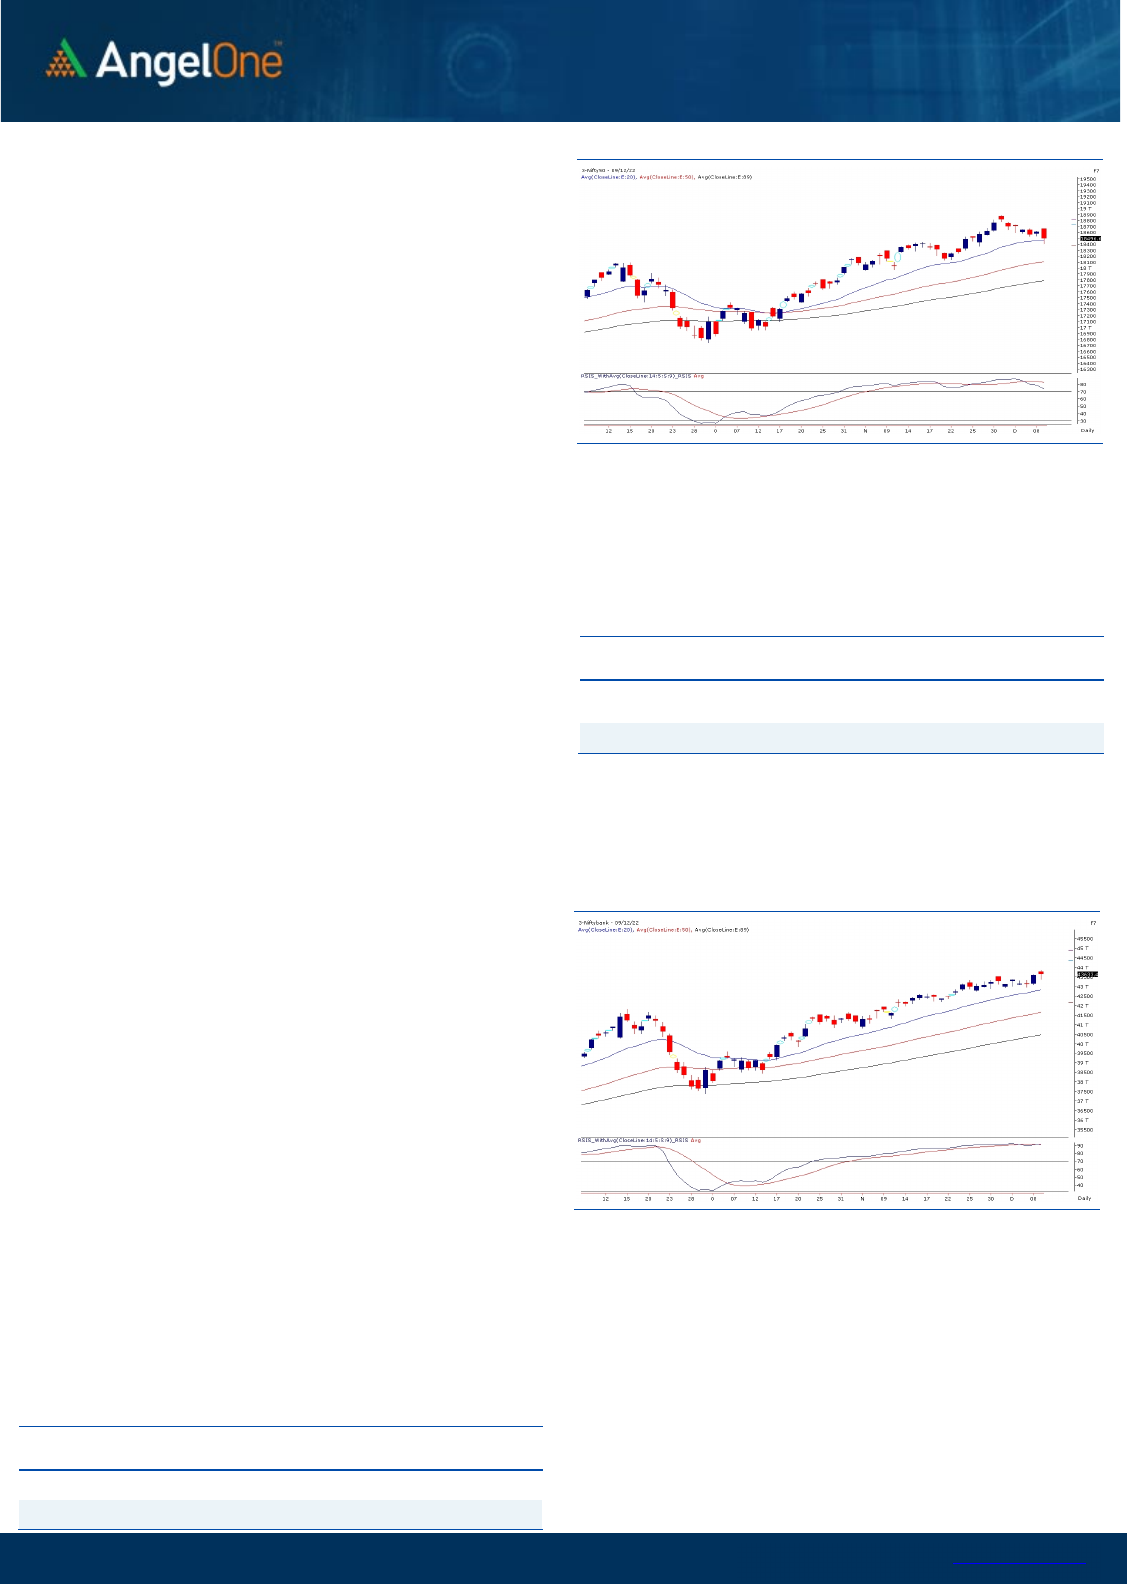
Finally, markets took a breather after recent relentless run. The
Nifty shed slightly over a percent on a week-on-week basis. With
couple of heavyweights imposing pressure on the last day of the
week, Nifty was on the verge of a breakdown; but fortunately, bulls
managed to defend their territory at the end. Now, taking a glance
at the daily time frame chart, the Nifty is now placed slightly above
the key support of ’20-day EMA’ which coincides with previous
swing high of 18450. Hence, we continue to remain upbeat as long
as 18400 – 18300 is not violated on a closing basis. Until then, any
intermediate decline should only be construed as a profit booking
before resuming the upward trend. On the flipside, 18650 – 18700
are the levels to watch out for. The moment Nifty surpasses this,
one should gear up for yet another milestone of 19000 in near
future.
Traders are advised not to get carried away by such small
declines. Rather it’s better to focus more on thematic moves,
especially from the broader end of the spectrum. The Nifty
MIDCAP 50 index has given a precise pullback to its breakout
point and hence, we will not be surprised to see more
opportunities unfolding from this space.
Key Levels
Support 1 – 18400 Resistance 1 – 18650
Support 2 – 18300 Resistance 2 – 18700
www.angelone.in
Technical & Derivatives Report
DEC 12, 2022
View
Post previous week’s splendid move, we witnessed
some consolidation with some sharp profit taking on
the final day of the week which drag index towards
18400. However, due to final hour surge we concluded
the week slightly below 18500.
FIIs were net sellers in the cash market segment to
the tune of Rs. 158 crores. Simultaneously, in Index
futures, they sold worth Rs. 980 crores with a fall in
open interest, indicating long unwinding.
During the week, Nifty witnessed some profit
booking; whereas banking index outperformed and
also added decent longs. The nearest piling up of
positions is visible in the 18400-18500 put strike,
indicating nearby support for Nifty. On the upside,
decent stack of OI concentration is seen around
18600-18700 call strikes, signifying intermediate
resistance. The PCR-OI has plunged to 0.76
signifying the market nearing the oversold region.
Stronger hand turned net sellers this week and they
also exited longs and added short resulting the
‘Long Short Ratio’ has further cooled off to 58% from
66%, on a weekly basis. The above data point doesn’t
indicate any sign of concern yet hence, we would
advocate trader’s to utilised intraday declines to add
fresh longs in the system.
Comments
The Nifty futures open interest has increased by
1.83% and Bank Nifty futures open interest has
decreased by 6.64% as the market closed at 18496.60.
The Nifty December future closed with a premium of
87.05 point against a premium of 110.80 point in the
last trading session. The January series closed at a
premium of 202.30 point.
The INDIA VIX increased from 13.39 to 13.47. At the
same time, the PCR-OI of Nifty has decreased to 0.76
from 0.85.
Few of the liquid counters where we have seen high
cost of carry are IDEA, GRANULES, WHIRLPOOL,
JKCEMENT and SAIL.
Historical Volatility
SCRIP HV
HCLTECH 32.32
TECHM 36.59
INTELLECT 57.08
INFY 32.47
MPHASIS 43.03
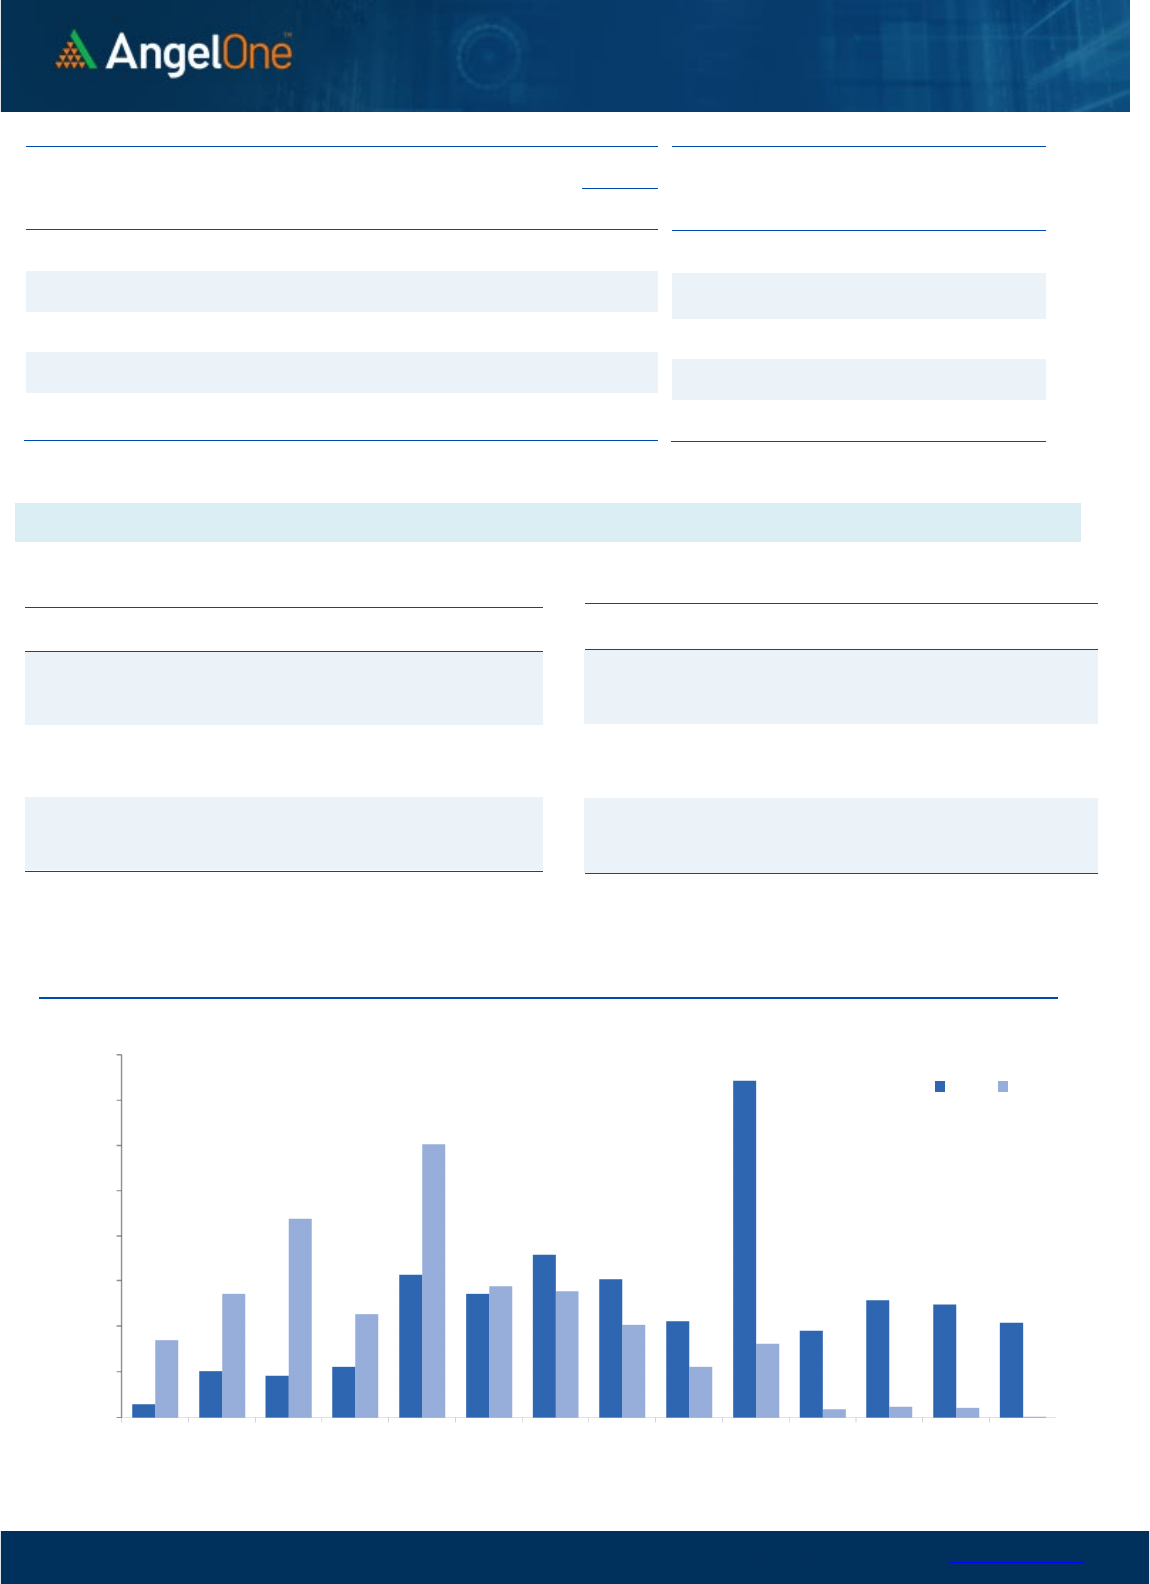
Nifty Vs OI
17800
18000
18200
18400
18600
18800
19000
8,000
9,000
10,000
11,000
12,000
13,000
14,000
15,000
16,000
11/22 11/24 11/28 11/30 12/2 12/6 12/8
Openinterest Nifty
OI Gainers
SCRIP OI
OI
CHG. (%)
PRICE
PRICE
CHG. (%)
CUMMINSIND 2427600 34.24 1523.00 3.25
HCLTECH 12333300 23.25 1027.50 -6.82
PNB 251648000 13.54 56.25 -2.41
METROPOLIS 1005200 8.45 1416.90 -0.77
AUBANK 8146000 8.31 682.15 1.08
HONAUT 35130 5.92 41537.85 -0.44
HAVELLS 4795500 5.63 1182.00 -2.48
WIPRO 41634500 5.19 394.05 -2.88
OI Losers
SCRIP OI
OI
CHG. (%)
PRICE
PRICE
CHG. (%)
POLYCAB 869400 -8.20 2733.80 -0.12
BANKBARODA 91745550 -7.84 188.60 0.72
SIEMENS 1981650 -7.71 2967.00 0.74
APOLLOTYRE 14045500 -6.93 315.95 -0.55
HINDALCO 18551000 -6.89 462.85 -1.29
NAVINFLUOR 447450 -6.03 4368.10 -0.71
EICHERMOT 3304350 -5.54 3358.20 0.66
COROMANDEL 2751000 -5.51 961.40 -0.54
Put-Call Ratio
SCRIP PCR (OI) PCR (VOL)
NIFTY 0.76 0.85
BANKNIFTY 0.97 0.97
RELIANCE 0.46 0.41
ICICIBANK 0.49 0.59
INFY 0.42 0.52
www.angelone.in
Technical & Derivatives Report
DEC 12, 2022
Note: Above mentioned Bullish or Bearish Spreads in Nifty (Dec Series) are given as an information and not as a recommendation.
Nifty Spot =
1
8
496.60
FII Statistics for
December
0
9
, 2022
Detail Buy
Contracts
Open
Interest
Value
(in Cr.)
Sell
Net
CHANGE
INDEX
FUTURES
2687.94 3667.51 (979.57) 175942 17185.81 (1.91)
INDEX
OPTIONS
880845.21 877672.04 3173.17
2064757 198561.85 43.98
STOCK
FUTURES
9085.95 11073.20 (1987.25) 1939361 135032.92 0.67
STOCK
OPTIONS
11647.72 11886.74 (239.02) 150979 10771.52 4.66
Total 904266.82
904299.49
(32.67) 4331039
361552.10
17.56
Turnover on
December
0
9
, 2022
Instrument
No. of
Contracts
Turnover
( in Cr. )
Change
(%)
Index
Futures
317548 31822.30 -98.76
Index
Options
104670706 38195.53 -99.09
Stock
Futures
848845 61532.34 -98.62
Stock
Options
3580716 4278.54 -98.57
Total
3,580,716 4278.54 -98.82
Bull-Call Spreads
Action Strike Price Risk Reward BEP
Buy
18500 242.40
56.75
43.25
18556.75
Sell
18600 185.65
Buy
18500 242.40
106.05
93.95
18606.05
Sell
18700 136.35
Buy
18600 185.65
49.30 50.70 18649.30
Sell 18700 136.35
Bear
-
Put Spreads
Action Strike Price Risk Reward BEP
Buy 18500 162.05
34.30
65.70
18465.70
Sell
18400 127.75
Buy 18500 162.05
62.55
137.45
18437.45
Sell 18300 99.50
Buy
18400 127.75
28.25 71.75 18371.75
Sell 18300 99.50
Nifty Put
-
Call Analysis
,0
500,000
1000,000
1500,000
2000,000
2500,000
3000,000
3500,000
4000,000
18100 18200 18300 18400 18500 18600 18700 18800 18900 19000 19100 19200 19300 19400
Call Put

www.angelone.in
Technical & Derivatives Report
DEC 12, 2022
`
Daily Pivot Levels for Nifty Constituents
Scrips
S2
S1
PIVOT
R1 R2
ADANIENT 3,858 3,928
4,011
4,080
4,163
ADANIPORTS
865
878
895
908
925
APOLLOHOSP 4,638 4,662
4,699 4,722 4,759
ASIANPAINT
3,189
3,208
3,225 3,244
3,261
AXISBANK 918 926
935
943
953
BAJAJ-AUTO
3,561
3,589
3,629
3,657
3,697
BAJFINANCE
6,414
6,466
6,542 6,594
6,670
BAJAJFINSV
1,558
1,578
1,603
1,623
1,647
BPCL
333
336
338
341
343
BHARTIARTL 819 827
832
840
844
BRITANNIA 4,365 4,388
4,407
4,430
4,449
CIPLA
1,094
1,101
1,108
1,115
1,123
COALINDIA
225
227
230
232
234
DIVISLAB
3,237
3,256
3,282 3,300
3,326
DRREDDY 4,332 4,369
4,392 4,430
4,453
EICHERMOT
3,312
3,335
3,349
3,372
3,386
GRASIM 1,761 1,780
1,808
1,828
1,855
HCLTECH
987
1,007
1,041
1,061
1,095
HDFCBANK 1,614 1,622
1,629
1,637
1,643
HDFCLIFE 567 573
578
584
588
HDFC 2,644 2,658
2,671
2,684
2,697
HEROMOTOCO 2,704 2,728
2,755
2,779
2,806
HINDALCO
453
458
467
472
481
HINDUNILVR
2,695
2,708
2,725
2,739
2,755
ICICIBANK
920
925
930
935
940
INDUSINDBK 1,176 1,189
1,203
1,216
1,229
INFY 1,519 1,544
1,586
1,611
1,653
ITC
336
339
341 343
345
JSW STEEL
731
735
743
748
756
KOTAKBANK
1,857
1,873
1,895
1,910
1,932
LT
2,105
2,130
2,162
2,186
2,219
M&M 1,241 1,253
1,269
1,281
1,297
MARUTI 8,423 8,518
8,641
8,736
8,859
NESTLEIND
19,676
19,959
20,127
20,410
20,578
NTPC
166
168
170
172
174
ONGC
139
140
141
142
144
POWERGRID 214 216
217
219
221
RELIANCE
2,566
2,587
2,624 2,645 2,682
SBILIFE
1,248
1,259
1,268
1,279
1,288
SBIN
606
611
615
620
623
SUNPHARMA 973 983
990
1,000
1,007
TCS
3,217
3,255
3,314
3,352
3,412
TATACONSUM
796 800
805
808
814
TATAMOTORS
403
408
415 420
426
TATASTEEL
107
109
111 113
115
TECHM
1,002
1,018
1,047
1,064
1,093
TITAN 2,542 2,579
2,604 2,641
2,666
ULTRACEMCO 6,930 7,004
7,114
7,187
7,297
UPL
743
753
768
778
792
WIPRO
382
388
397
403 412

www.angelone.in
Technical & Derivatives Report
DEC 12, 2022
*
Technical and Derivatives Team:
Sameet Chavan Chief Analyst – Technical & Derivatives sameet.chavan@angelone.in
Sneha Seth Senior Analyst – Technical & Derivatives sneha.seth@angelone.in
Rajesh Bhosale Technical Analyst rajesh.bhosle@angelone.in
Osho Krishan Senior Analyst – Technical & Derivatives osho.krishan@angelone.in
Research Team Tel: 022 – 39357600 Website: www.angelone.in
For Technical Queries E-mail: technicalresearch-cso@angelone.in
For Derivatives Queries E-mail: derivatives.desk@angelone.in
DISCLAIMER
Angel One Limited (hereinafter referred to as “Angel”) is a registered Member of National Stock Exchange of India Limited, Bombay
Stock Exchange Limited and Metropolitan Stock Exchange Limited. It is also registered as a Depository Participant with CDSL and
Portfolio Manager and investment advisor with SEBI. It also has registration with AMFI as a Mutual Fund Distributor. Angel One
Limited is a registered entity with SEBI for Research Analyst in terms of SEBI (Research Analyst) Regulations, 2014 vide registration
number INH000000164. Angel or its associates has not been debarred/ suspended by SEBI or any other regulatory authority for
accessing /dealing in securities Market.
This document is solely for the personal information of the recipient, and must not be singularly used as the basis of any investment
decision. Nothing in this document should be construed as investment or financial advice. Each recipient of this document should
make such investigations as they deem necessary to arrive at an independent evaluation of an investment in the securities of the
companies referred to in this document (including the merits and risks involved), and should consult their own advisors to determine
the merits and risks of such an investment.
Angel or its associates or research analyst or his relative may have actual/beneficial ownership of 1% or more in the securities of
the subject company at the end of the month immediately preceding the date of publication of the research report. Neither Angel or
its associates nor Research Analysts or his relative has any material conflict of interest at the time of publication of research report.
Angel or its associates might have received any compensation from the companies mentioned in the report during the period
preceding twelve months from the date of this report for services in respect of managing or co-managing public offerings, corporate
finance, investment banking or merchant banking, brokerage services or other advisory service in a merger or specific transaction
in the normal course of business. Angel or its associates did not receive any compensation or other benefits from the companies
mentioned in the report or third party in connection with the research report. Neither Angel nor its research analyst entity has been
engaged in market making activity for the subject company.
Reports based on technical and derivative analysis center on studying charts of a stock's price movement, outstanding positions and
trading volume, as opposed to focusing on a company's fundamentals and, as such, may not match with a report on a company's
fundamentals. Investors are advised to refer the Fundamental and Technical Research Reports available on our website to evaluate
the contrary view, if any.
The information in this document has been printed on the basis of publicly available information, internal data and other reliable
sources believed to be true, but we do not represent that it is accurate or complete and it should not be relied on as such, as this
document is for general guidance only. Angel One Limited or any of its affiliates/ group companies shall not be in any way responsible
for any loss or damage that may arise to any person from any inadvertent error in the information contained in this report. Angel One
Limited has not independently verified all the information contained within this document. Accordingly, we cannot testify, nor make
any representation or warranty, express or implied, to the accuracy, contents or data contained within this document. While Angel
One Limited endeavors to update on a reasonable basis the information discussed in this material, there may be regulatory,
compliance, or other reasons that prevent us from doing so.
This document is being supplied to you solely for your information, and its contents, information or data may not be reproduced,
redistributed or passed on, directly or indirectly.
Neither Angel One Limited, nor its directors, employees or affiliates shall be liable for any loss or damage that may arise from or in
connection with the use of this information. Angel or its associates or Research Analyst or his relative might have financial interest
in the subject company. Research analyst has not served as an officer, director or employee of the subject company.
