November 12, 2021
www.angelone.in
Technical & Derivatives Report
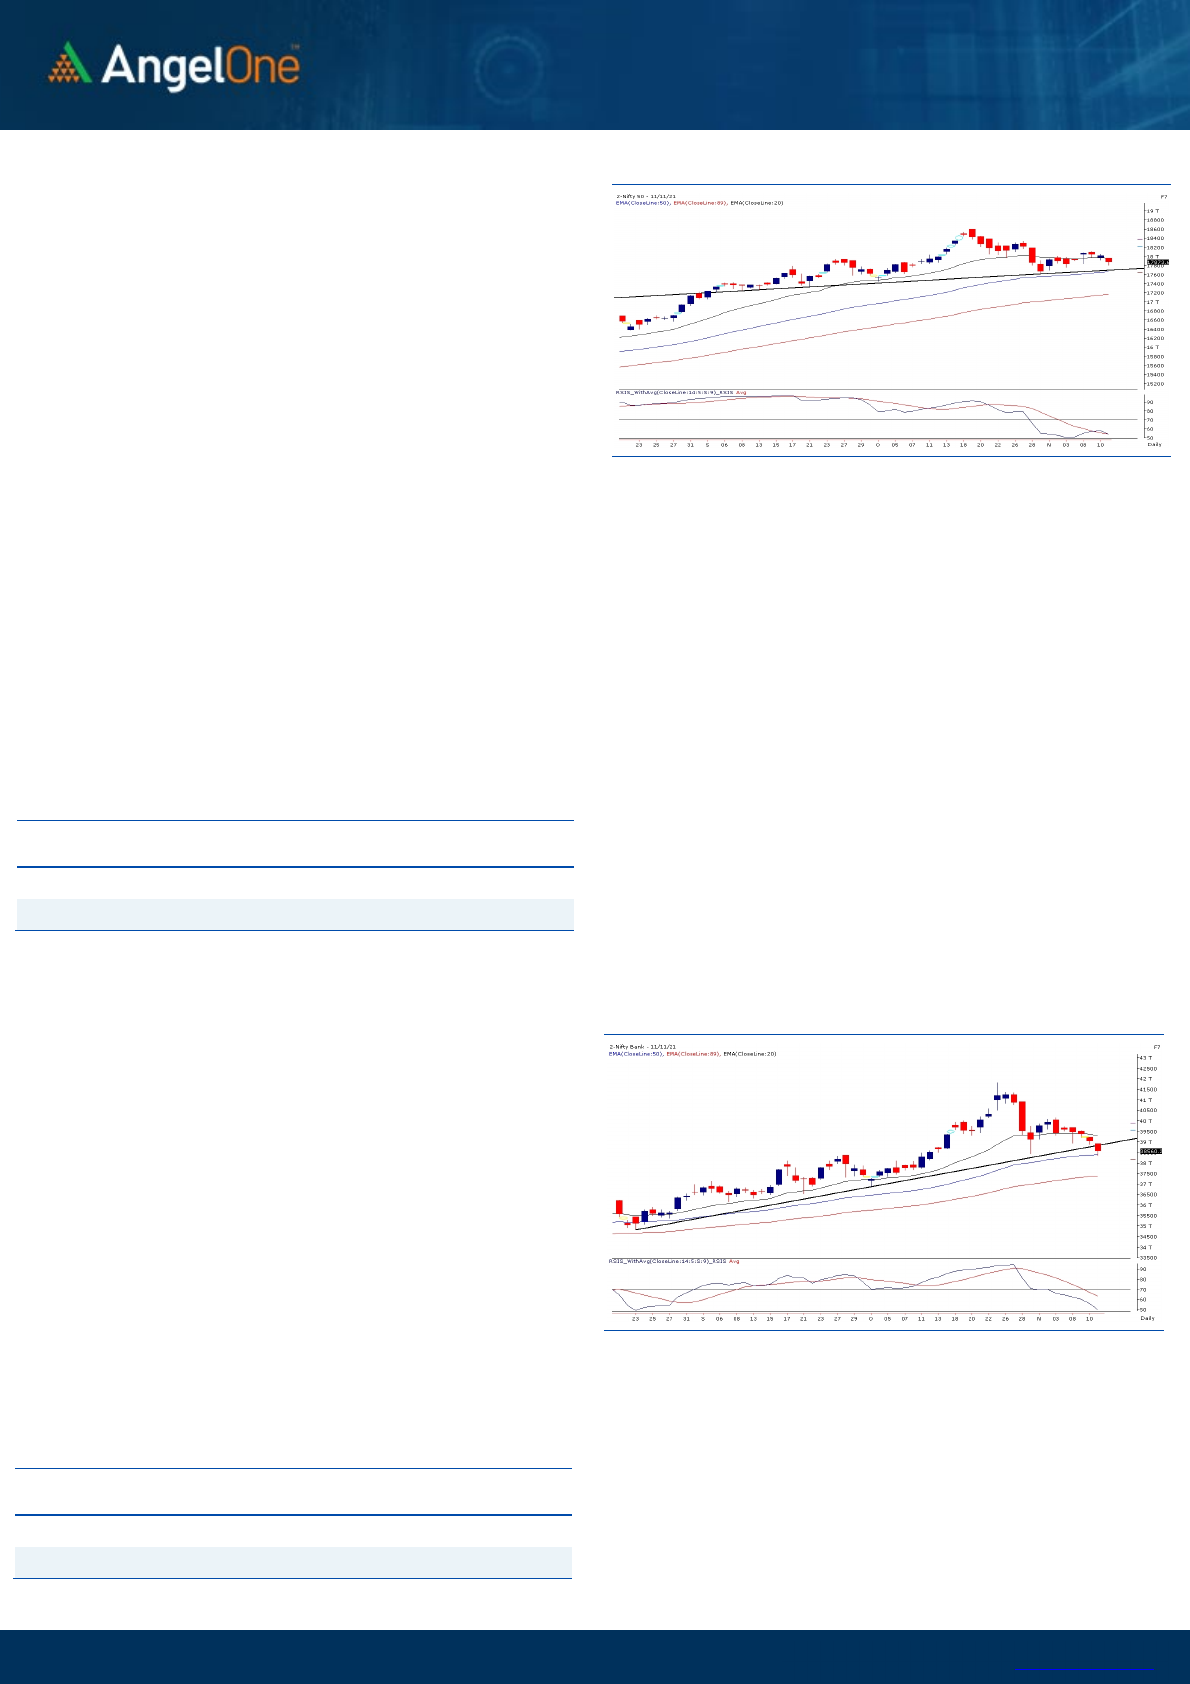
Nifty Bank Outlook - (38560)
Once again the Bank Nifty started on a weak note and on the weekly
expiry it marked an intraday low of 38346. Eventually, with some
minor bounce in the last hour it ended with a loss of 1.19% at 38560.
On the daily chart, the bank index has broken below a key trend line
support and thus indicates further weakness going ahead. However,
the current weakness has pushed prices towards the key 50SMA that
has previously a couple of times have acted as strong support. Hence,
it would be crucial to see if prices witness an immediate fall or if it
bounces a bit before the second round of weakness. Whatever may be
the case traders are advised not to get complacent on the bounce and
use such bounce to lighten up long positions. As far as levels are
concerned, support is placed around 38250 and 37900 whereas
resistance is seen around 38900 and 39150 levels.
Key Levels
Support 1 – 38250 Resistance 1 – 38900
Support 2 – 37900 Resistance 2 – 39150
Exhibit 2: Nifty Bank Daily Chart
Sensex (59920) / Nifty (17874)
We had a soft opening yesterday on the back of some nervousness seen
in major global peers. In fact in the initial hour itself, the weakness
extended in some of the heavyweight pockets. This led to breach of
17900 first and then after a decent consolidation, Nifty went on to even
test the 17800 mark. At the stroke of the penultimate hour, the expiry
factor started playing out and this time it fortunately favoured the bulls
as we witnessed a smart recovery towards the end to trim some portion
of losses.
Market was quiet in last couple of sessions as it was trapped in a slender
range. Yesterday it finally had some action but unfortunately it was
dominated by the bears for the most part of the day. Percentage wise,
it was not even a percent cut yesterday on a closing basis; but the more
it fails to surpass 18100 – 18200, the harder it becomes for the bulls to
maintain their grip on the market. In fact, it would be too early to
comment on it; but we can clearly see a bearish formation of ‘Head and
Shoulder’ being in process on the daily chart of Nifty. The neckline
support is around 17700 – 17600, which if gets broken, we could see
difficult days for market in the short run. With reference to our recent
cautious stance on the market, we will not be surprised to see it
breaking in the forthcoming week itself.
Key Levels
Support 1 – 17800 Resistance 1 – 17950
Support 2 – 17700 Resistance 2 – 18000
Exhibit 1: Nifty Daily Chart
For the coming session, the immediate resistance is placed in the
zone of 17950 – 18000. Traders are repeatedly advised not to create
aggressive longs and even if one wants to follow stock specific
moves, needs to be very selective.
www.angelone.in
Technical & Derivatives Report
November 12, 2021
View
Market started with a downside gap tad below 18000
mark and we witnessed follow-up selling from the word
go. As we progressed,market made an attempt of
recovery but 17900 acted as a strong resistance. Post
decent volatility in the 100 points range, Nifty concluded
the weekly expiry day tad below 18900 with a cut of eight
tenth of a percent.
FIIs were net sellers in the cash market segment to the
tune of Rs. 1637 crores. In index futures, they bought
worth Rs. 193 crores with good amount of rise in open
interest indicating formation of mixed positions.
In F&O space, we saw addition of fresh shorts in both
the indices. Stronger hands continued their selling
streak in equities and preferred adding mixed bets in
index futures segment. In the coming weekly series,
build-up was seen in 17900-18200 call options. On the
other side, 17800 and 17900 put options added fresh
positions. Considering yesterday’s fall, it seems market
has strong hurdle around 17900-18000; whereas 17750
and 17600 are the support zone. We would stick to our
cautious stance on market and would advise traders
avoiding any bottom fishing for now.
Comments
The Nifty futures open interest has increased by 4.90%.
Bank Nifty futures open interest has increased by 4.69%
as market closed at 17873.60 levels.
The Nifty November future closed with a premium of
23.25 point against a premium of 5.75 point in last trading
session. The December series closed at a premium of
88.35 point.
The INDIA VIX increased from 16.30 to 16.35. At the same
time, the PCR-OI of Nifty has decreased from 0.94 to
0.83.
Few of the liquid counters where we have seen high cost
of carry are BRITANNIA, M&M, TVSMOTOR, RBLBANK
and IBULHSGFIN.
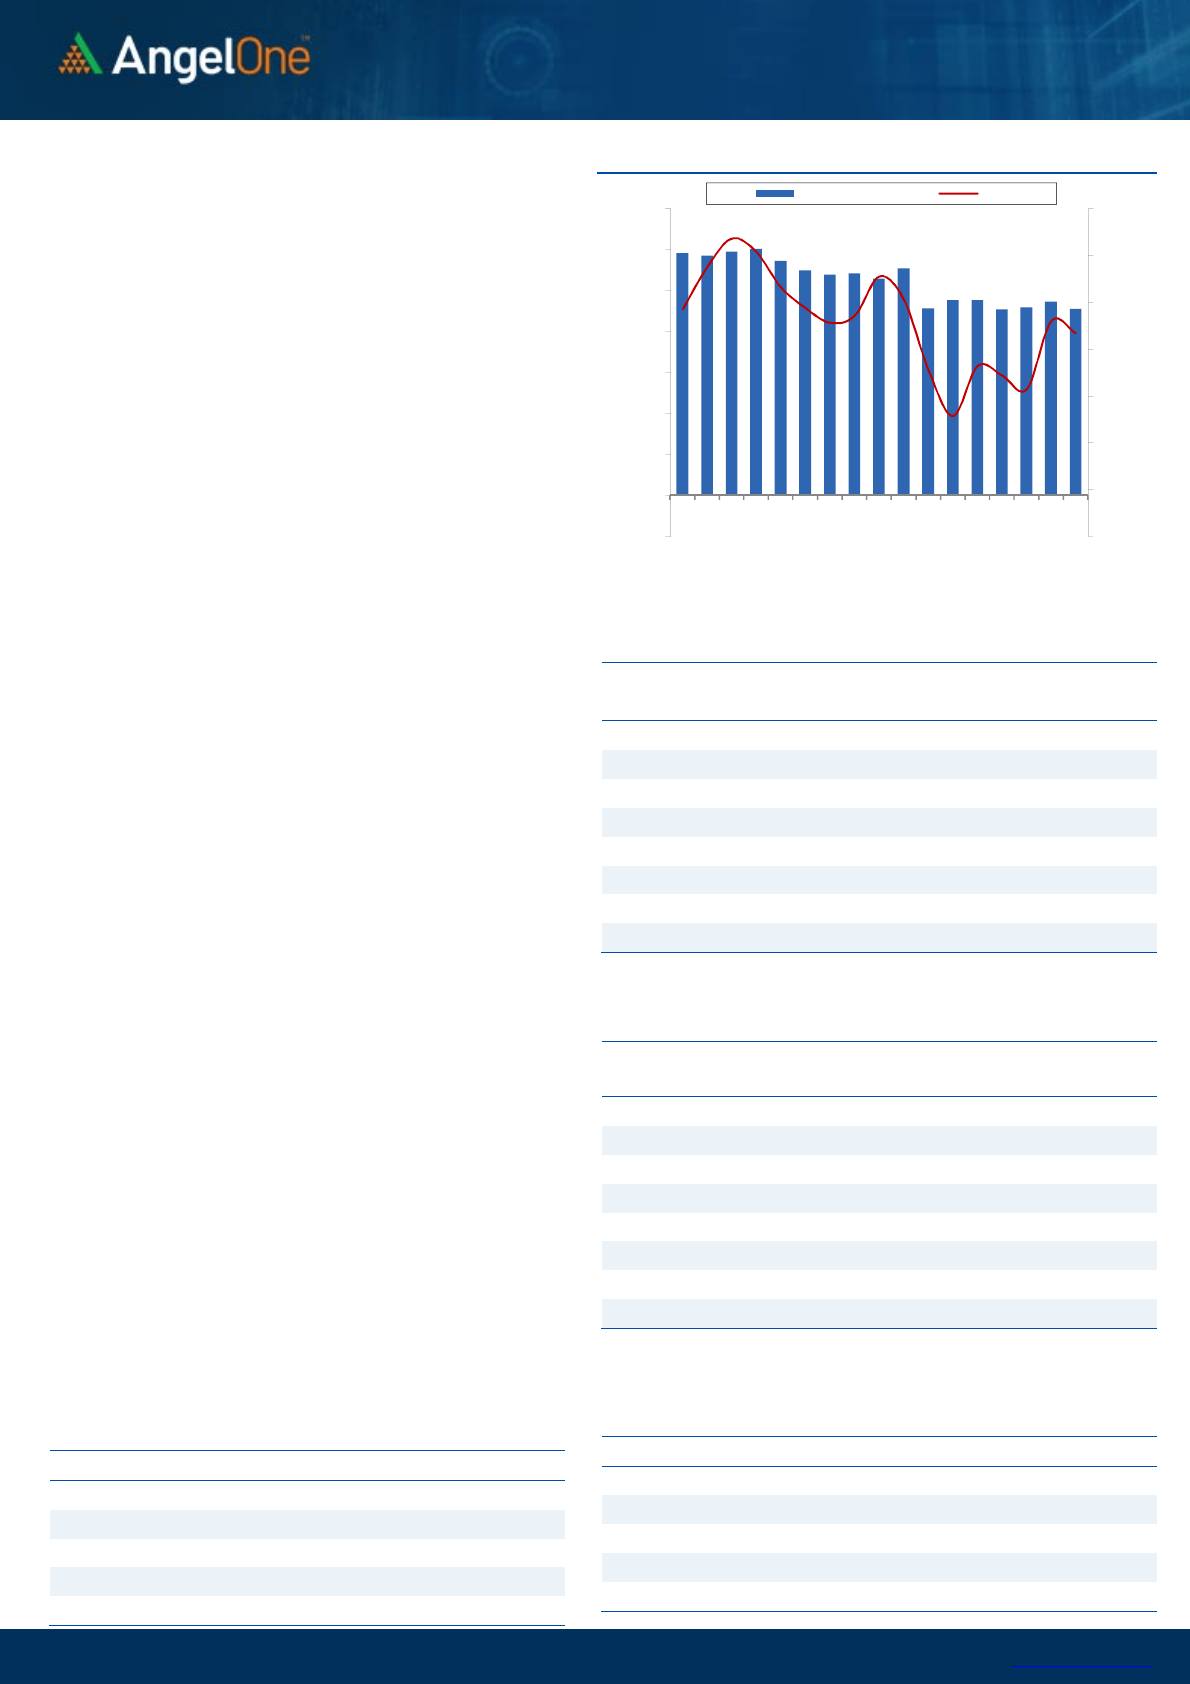
Nifty Vs OI
17200
17400
17600
17800
18000
18200
18400
18600
,0
2,000
4,000
6,000
8,000
10,000
12,000
14,000
16,000
10-13 10-18 10-20 10-22 10-26 10-28 11-1 11-3 11-5
(`000)
Openinterest Nifty
OI Gainers
SCRIP OI
OI
CHG. (%)
PRICE
PRICE
CHG. (%)
NAVINFLUOR
852525 22.94 3596.35 2.80
BALKRISIND
1575200 21.69 2379.85 -5.72
MRF
73630 9.86 77210.30 -1.29
BOSCHLTD
168600 9.02 18250.10 -2.81
NTPC
53505900 8.99 136.65 -0.80
BHARATFORG
11019750 8.75 782.05 -5.46
TVSMOTOR
7158200 8.65 747.05 -0.49
PFC
49922400 8.58 139.50 -1.00
OI Losers
SCRIP OI
OI
CHG. (%)
PRICE
PRICE
CHG. (%)
BERGEPAINT
4880700 -12.26 779.15 0.60
BANKBARODA
173721600 -8.49 101.30 0.94
APOLLOHOSP
2142875 -8.27 4567.25 0.23
ONGC
42719600 -7.72 153.50 -2.45
DABUR
11840000 -7.55 598.45 -0.51
IGL
16777750 -6.02 499.70 1.75
BHEL
137466000 -5.96 64.80 -2.11
VOLTAS
2042000 -5.24 1248.90 0.07
Put-Call Ratio
SCRIP PCR-OI PCR-VOL
NIFTY
0.83 0.82
BANKNIFTY
0.66 0.84
RELIANCE
0.45 0.37
ICICIBANK
0.41 0.47
INFY
0.44 0.39
Historical Volatility
SCRIP HV
PIDILITIND
31.28
BALKRISIND
41.83
BHARATFORG
49.10
APLLTD
42.49
DLF
56.12
www.angelone.in
Technical & Derivatives Report
November 12, 2021
Note: Above mentioned Bullish or Bearish Spreads in Nifty (November Series) are given as an information and not as a recommendation.
Nifty Spot = 17873.60
FII Statistics for November 11, 2021
Detail Buy
Net Contracts
Open Interest
Sell
Value
(in Cr.)
Change
INDEX
FUTURES
4243.65 4050.57 193.08
161283 14748.05 7.47
INDEX
OPTIONS
1016833.03 1014741.66 2091.37
1152798 104833.44 (23.05)
297314.41
STOCK
FUTURES
13045.27 13787.01 (741.74) 1784680 133346.71 0.62
STOCK
OPTIONS
15186.93 15487.87 (300.94) 321685 24835.59 3.97
Total
1049308.88
1048067.11
1241.77
3420446
277763.79
(8.33)
43446.77
Turnover on November 11, 2021
Instrument
No. of
Contracts
Turnover
( in Cr. )
Change
(%)
Index Futures
322678 29901.80 24.21
Index Options
127463514 12023876.52 113.74
Stock Futures
757088 58656.86 -11.42
Stock Options
2446881 195760.66 -9.05
Total
13,09,90,161
12308195.84 107.52
Bull-Call Spreads
Action Strike Price Risk Reward BEP
Buy
17900 202.90
46.00 54.00 17946.00
Sell
18000 156.90
Buy
17900 202.90
86.35 113.65 17986.35
Sell
18100 116.55
Buy
18000 156.90
40.35 59.65 18040.35
Sell
18100 116.55
Bear-Put Spreads
Action Strike Price Risk Reward BEP
Buy
17900 207.00
45.20 54.80 17854.80
Sell
17800 161.80
Buy
17900 207.00
81.45 118.55 17818.55
Sell
17700 125.55
Buy
17800 161.80
36.25 63.75 17763.75
Sell
17700 125.55
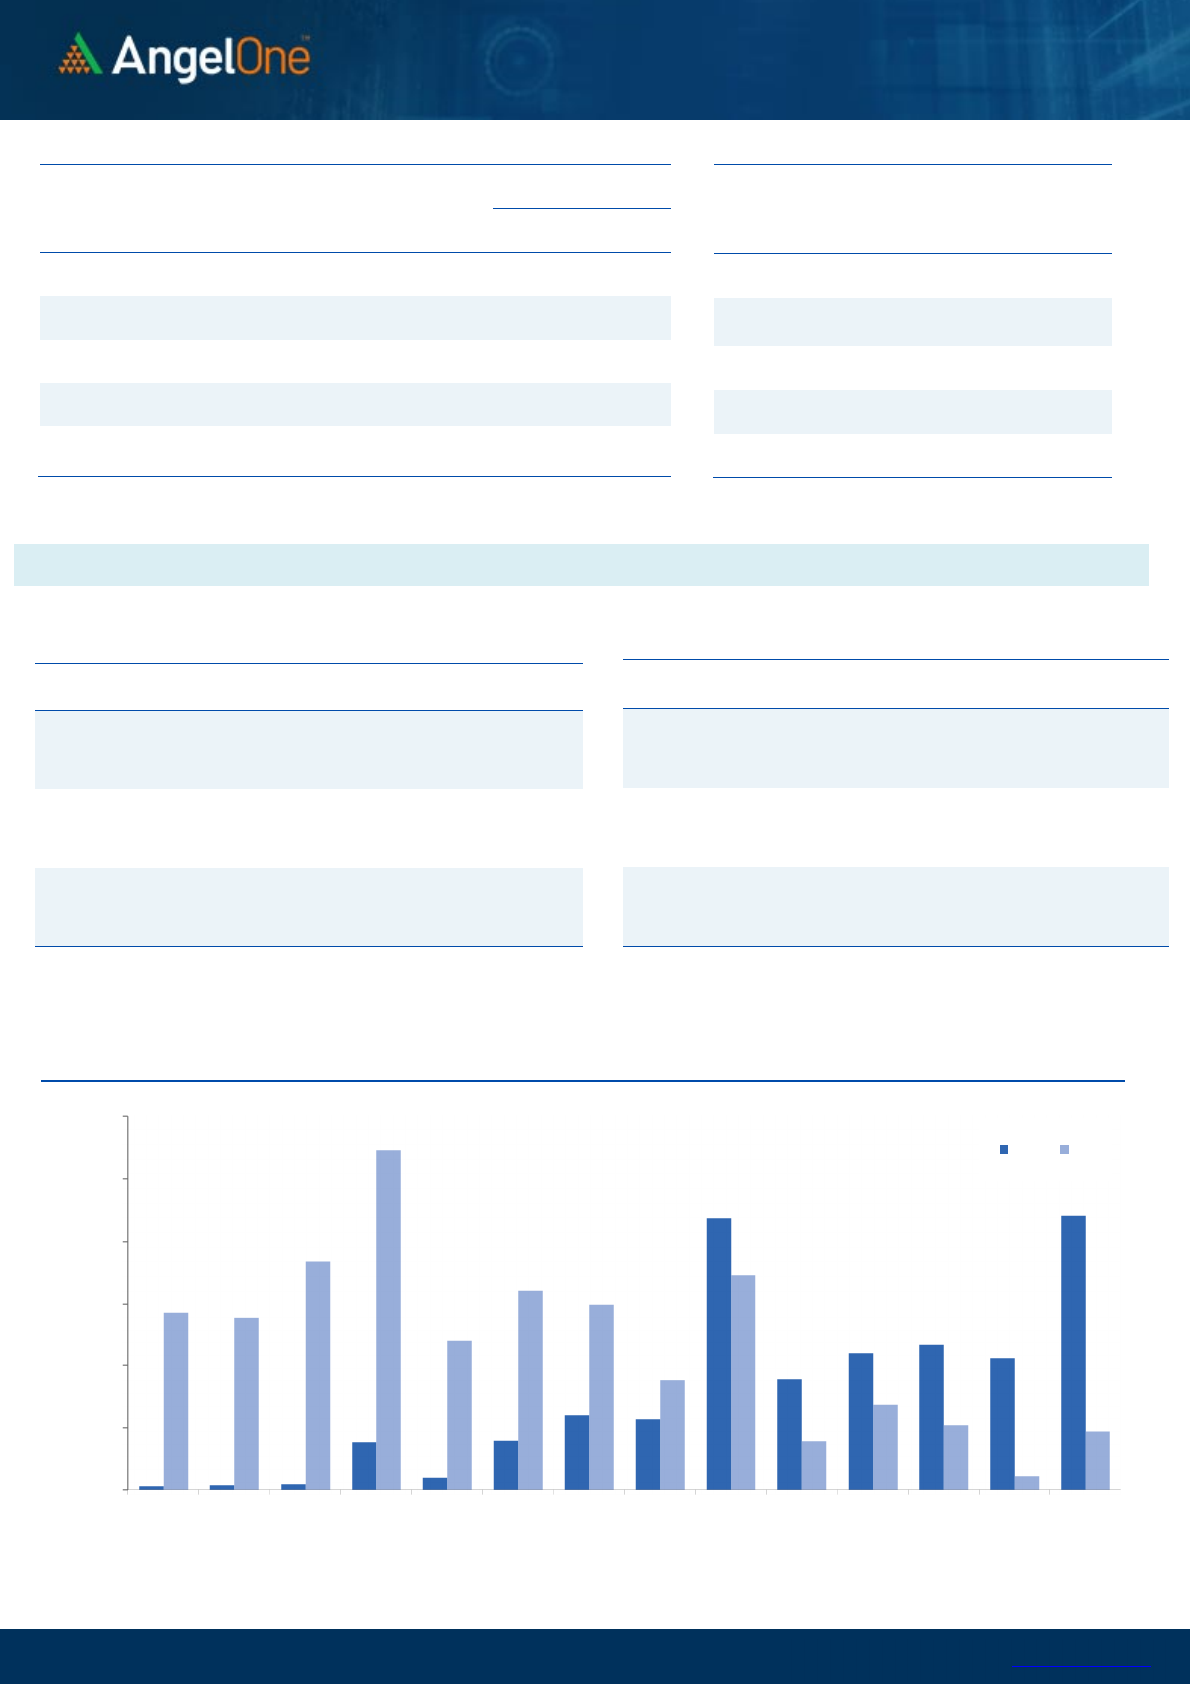
Nifty Put-Call Analysis
,0
500,000
1000,000
1500,000
2000,000
2500,000
3000,000
17200 17300 17400 17500 17600 17700 17800 17900 18000 18100 18200 18300 18400 18500
Call Put

www.angelone.in
Technical & Derivatives Report
November 12, 2021
`
Daily Pivot Levels for Nifty Constituents
Scrips S2 S1 PIVOT R1 R2
ADANIPORTS 722 729
735 742 748
ASIANPAINT 3,019 3,041
3,074 3,096 3,129
AXISBANK 727 733
740 746 753
BAJAJ-AUTO 3,697 3,723
3,753 3,779 3,808
BAJFINANCE 7,297 7,375
7,488 7,566 7,679
BAJAJFINSV 17,470 17,671
18,010 18,211 18,550
BPCL 420 422
425 428 430
BHARTIARTL 716 722
730 737 745
BRITANNIA 3,580 3,612
3,665 3,697 3,750
CIPLA 888 896
904 913 921
COALINDIA 164 166
167 168 169
DIVISLAB 4,764 4,799
4,849 4,884 4,934
DRREDDY 4,751 4,783
4,816 4,848 4,881
EICHERMOT 2,655 2,680
2,711 2,736 2,768
GRASIM 1,795 1,820
1,856 1,881 1,918
HCLTECH 1,145 1,153
1,160 1,168 1,176
HDFCBANK 1,527 1,538
1,546 1,557 1,566
HDFCLIFE 696 700
703 706 710
HDFC 2,862 2,885
2,909 2,932 2,956
HEROMOTOCO 2,664 2,683
2,704 2,722 2,743
HINDALCO 443 448
452 458 462
HINDUNILVR 2,342 2,359
2,383 2,400 2,424
ICICIBANK 761 766
772 777 782
IOC 131 132
134 135 137
INDUSINDBK 1,013 1,023
1,031 1,041 1,048
INFY 1,697 1,715
1,727 1,746 1,758
ITC 227 229
230 231 233
JSW STEEL 656 662
666 671 675
KOTAKBANK 2,030 2,042
2,060 2,072 2,090
LT 1,890 1,911
1,946 1,967 2,002
M&M 904 914
922 932 939
MARUTI 7,362 7,408
7,488 7,533 7,613
NESTLEIND 18,545 18,699
18,825 18,979 19,105
NTPC 133 135
136 138 140
ONGC 151 152
154 156 158
POWERGRID 178 180
183 185 187
RELIANCE 2,519 2,537
2,554 2,572 2,588
SBILIFE 1,123 1,138
1,165 1,180 1,207
SHREECEM 28,605 28,808
29,053 29,256 29,501
SBIN 497 504
513 519 529
SUNPHARMA 781 788
799 806 817
TCS 3,404 3,446
3,478 3,520 3,552
TATACONSUM
816 827
834 845 853
TATAMOTORS 490 497
508 515 526
TATASTEEL 1,268 1,284
1,304 1,320 1,340
TECHM 1,487 1,505
1,532 1,550 1,577
TITAN 2,449 2,489
2,516 2,555 2,582
ULTRACEMCO 7,929 7,990
8,066 8,127 8,203
UPL 750 757
768 775 785
WIPRO 630 636
643 649 656
www.angelone.in
Technical & Derivatives Report
November 12, 2021
*
Research Team Tel: 022 – 39357600 (Extn. 6844) Website: www.angelone.in
For Technical Queries E-mail: technicalresearch-cso@angelbroking.com
For Derivatives Queries E-mail: derivatives.desk@angelbroking.com
DISCLAIMER
Angel Broking Limited (hereinafter referred to as “Angel”) is a registered Member of National Stock Exchange of India Limited,
Bombay Stock Exchange Limited and Metropolitan Stock Exchange Limited. It is also registered as a Depository Participant with
CDSL and Portfolio Manager and Investment Adviser with SEBI. It also has registration with AMFI as a Mutual Fund Distributor. Angel
Broking Limited is a registered entity with SEBI for Research Analyst in terms of SEBI (Research Analyst) Regulations, 2014 vide
registration number INH000000164. Angel or its associates has not been debarred/ suspended by SEBI or any other regulatory
authority for accessing /dealing in securities Market. Angel or its associates/analyst has not received any compensation / managed
or co-managed public offering of securities of the company covered by Analyst during the past twelve months.
This document is solely for the personal information of the recipient, and must not be singularly used as the basis of any investment
decision. Nothing in this document should be construed as investment or financial advice. Each recipient of this document should
make such investigations as they deem necessary to arrive at an independent evaluation of an investment in the securities of the
companies referred to in this document (including the merits and risks involved), and should consult their own advisors to determine
the merits and risks of such an investment.
Reports based on technical and derivative analysis center on studying charts of a stock's price movement, outstanding positions and
trading volume, as opposed to focusing on a company's fundamentals and, as such, may not match with a report on a company's
fundamentals. Investors are advised to refer the Fundamental and Technical Research Reports available on our website to evaluate
the contrary view, if any.
The information in this document has been printed on the basis of publicly available information, internal data and other reliable
sources believed to be true, but we do not represent that it is accurate or complete and it should not be relied on as such, as this
document is for general guidance only. Angel Broking Limited or any of its affiliates/ group companies shall not be in any way
responsible for any loss or damage that may arise to any person from any inadvertent error in the information contained in this
report. Angel Broking Limited has not independently verified all the information contained within this document. Accordingly, we
cannot testify, nor make any representation or warranty, express or implied, to the accuracy, contents or data contained within this
document. While Angel Broking Limited endeavors to update on a reasonable basis the information discussed in this material, there
may be regulatory, compliance, or other reasons that prevent us from doing so.
This document is being supplied to you solely for your information, and its contents, information or data may not be reproduced,
redistributed or passed on, directly or indirectly.
Neither Angel Broking Limited, nor its directors, employees or affiliates shall be liable for any loss or damage that may arise from
or in connection with the use of this information.
Technical and Derivatives Team:
Sameet Chavan Chief Analyst – Technical & Derivatives sameet.chavan@angelone.in
Rajesh Bhosale Technical Analyst rajesh.bhosle@angelone.in
Sneha Seth Derivatives Analyst sneha.seth@angelone.in
