October
1
2
, 2023
www.angelone.in
Technical & Derivatives Report
8
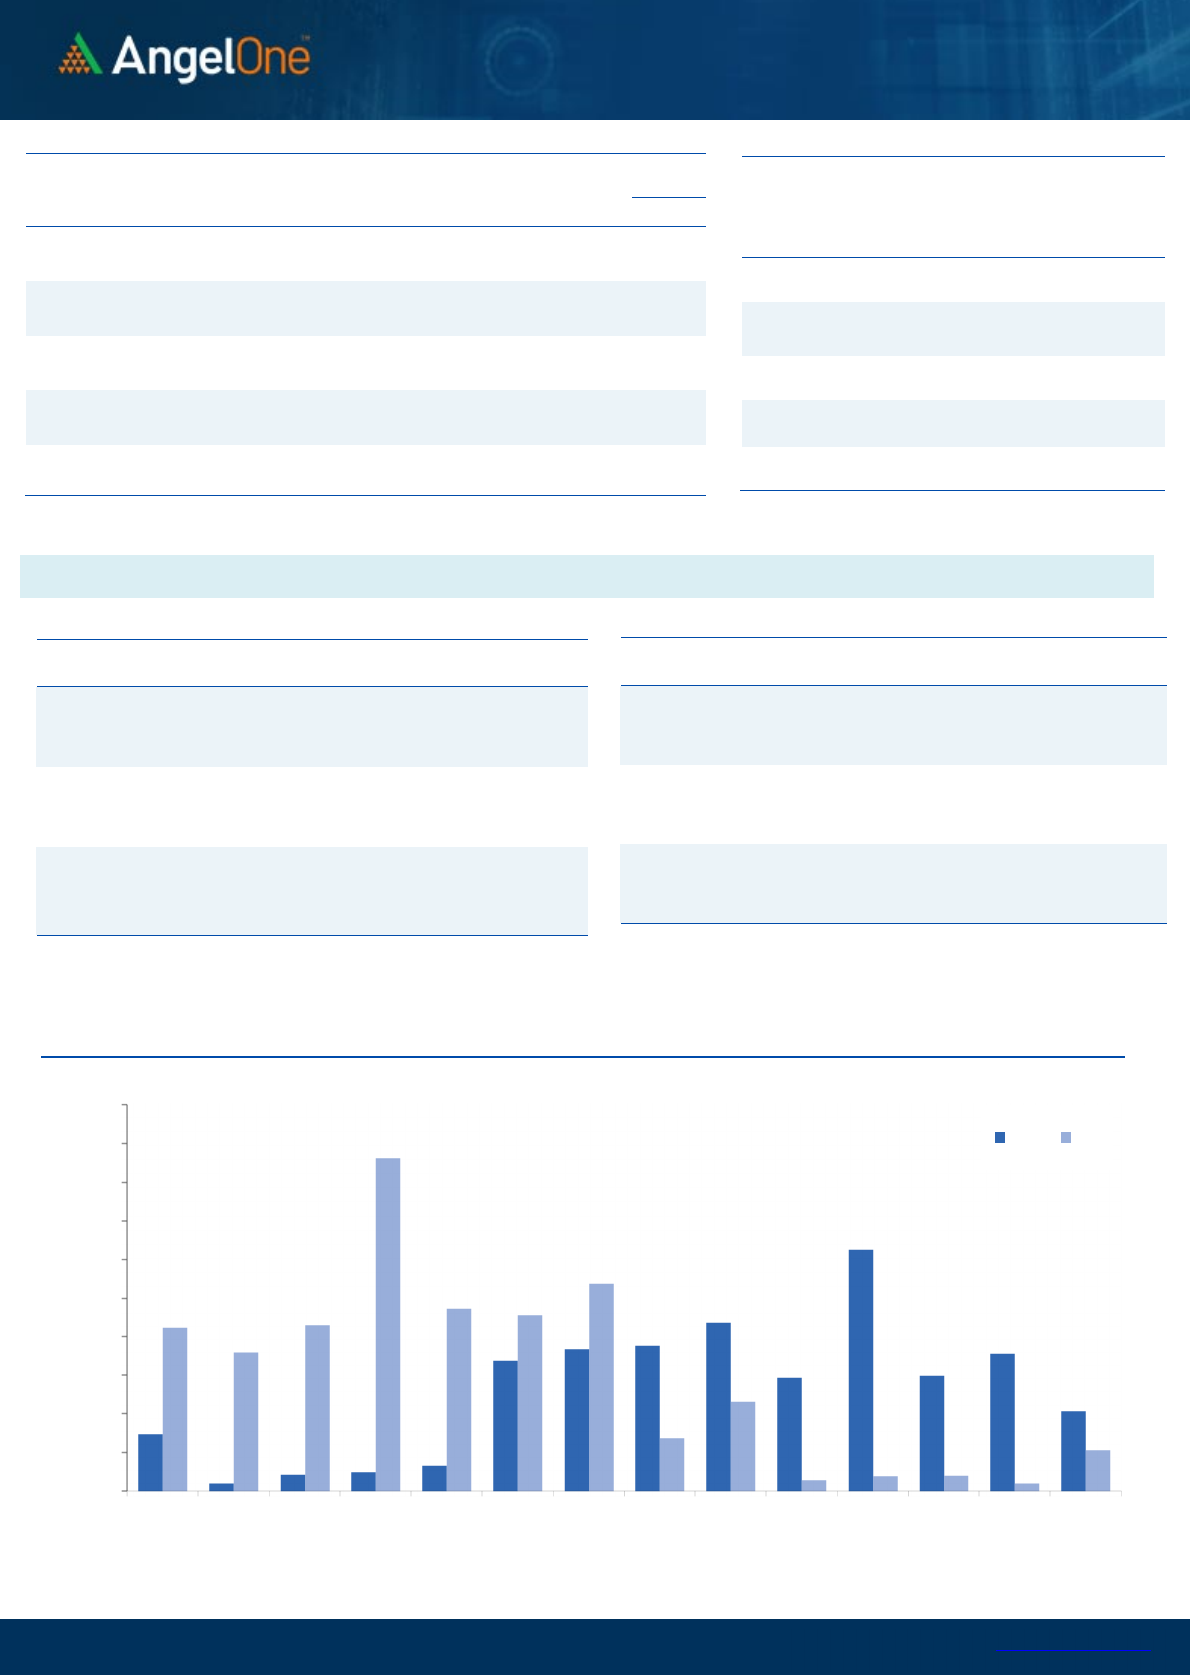
Nifty Bank Outlook (
4
4
517
)
The banking index had an optimistic start on the weekly expiry but
lacked follow-up traction as it headed toward the critical resistance
zone. The initial gains gradually waned out and the index slipped into
a narrow consolidation zone for the rest of the trading session. Amidst
a hustle, the index eventually procured 0.35 percent of gains and
settled the day a tad above the 44500 zone.
The Banking index comparatively showed lesser conviction as it
retracted from the overlapping of short-term moving averages (20 &
50 DEMA) on the daily chart. Also, the small-body candlestick
formation showcases a sense of timidity and we need to wait for a
decisive breakout to affirm strength in the market. As far as levels are
concerned, 44800 remains a daunting task for the bulls and until it gets
conquered, the index is likely to remain tentative. On the other hand,
the immediate support shifts to 44250-44200, followed by a strong
base setup around 44000 zone in the near period. However,
considering the recent developments, it is advisable to stay light on
the positions until we witness a decisive breakthrough from the
mentioned range.
Key Levels
Support 1 – 44200 Resistance 1 – 44800
Support 2 – 44000 Resistance 2 – 45000
Exhibit 1: Nifty Daily Chart
Exhibit 2: Nifty Bank Daily Chart
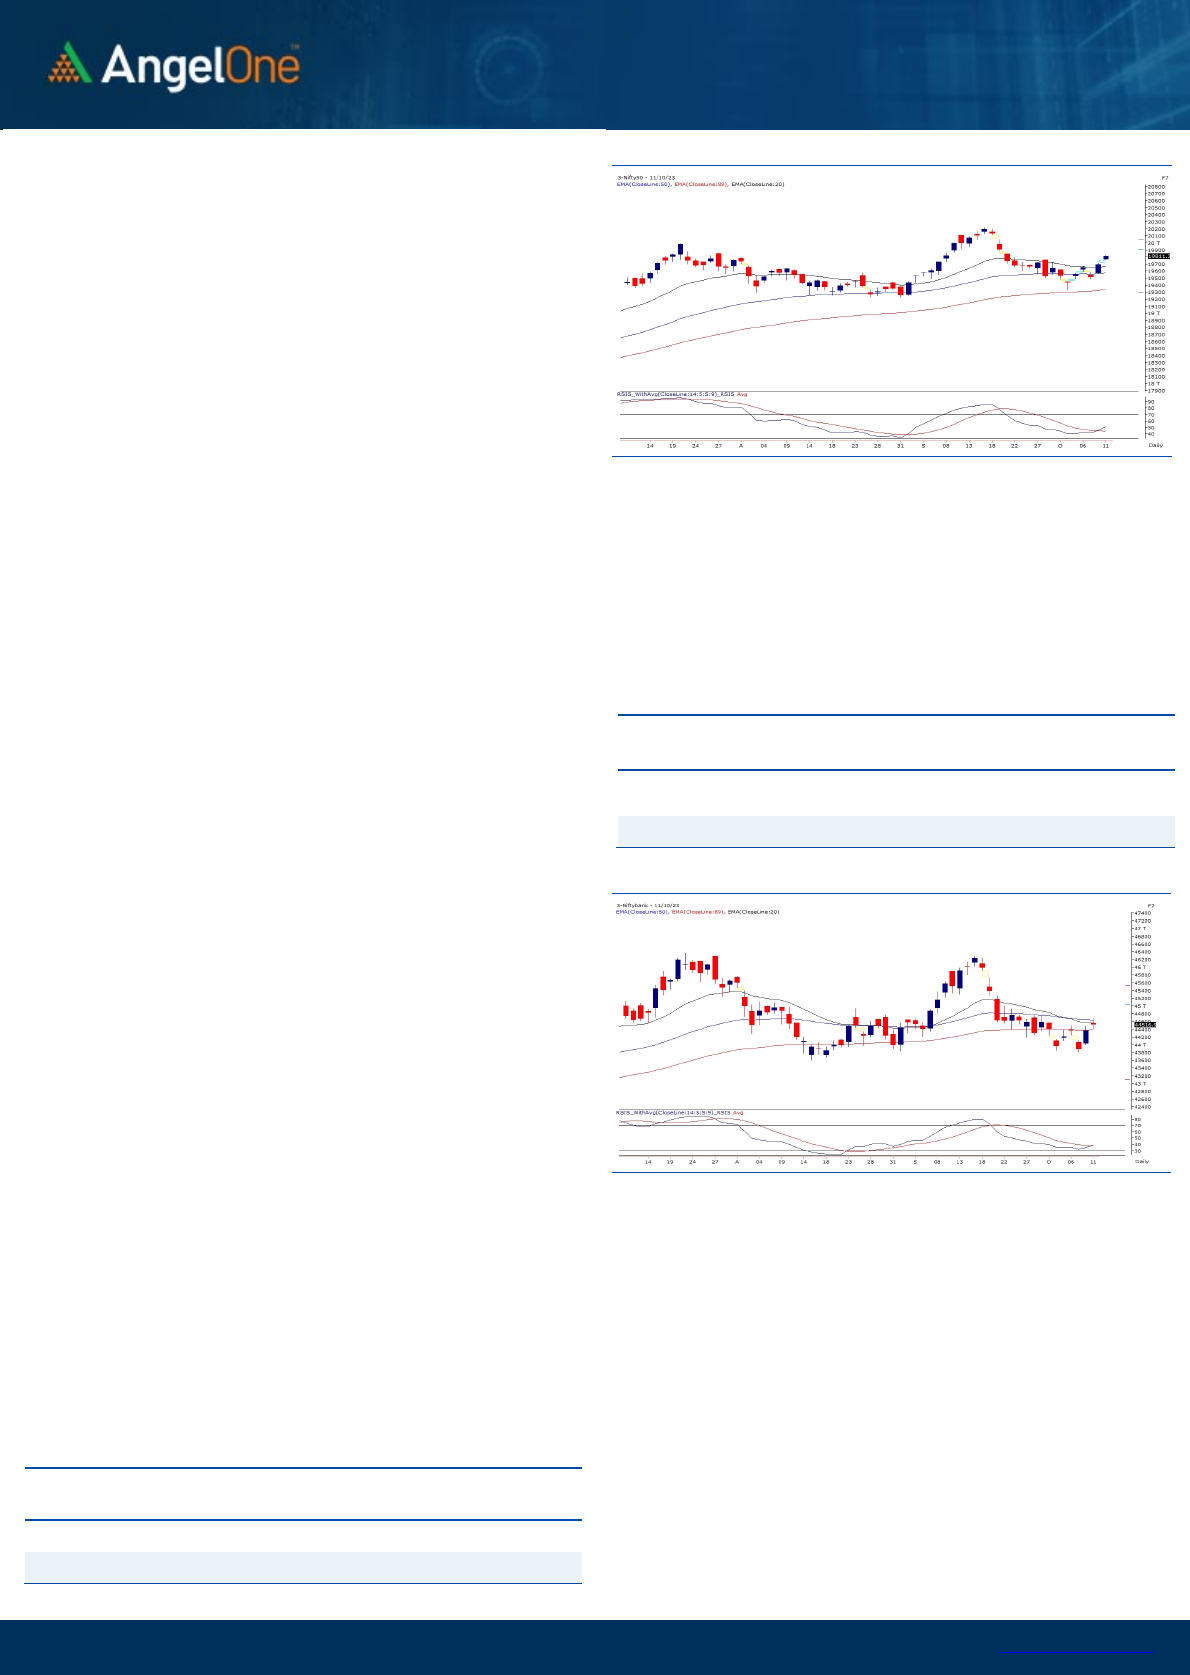
Sensex (
6
6
473
)
/ Nifty (
19
811
)
The benchmark index Nifty experienced a gap-up opening, that was
followed by an initial surge during the first hour of trading. However,
the rest of the session saw limited price movement within a specific
range. Eventually, Nifty closed with a 0.62% gain, reclaiming the 19800
mark.
This recovery by the bulls can be attributed to the absence of any major
geopolitical tensions. In the past two sessions, the gains have managed
to recoup more than 50% of the losses incurred from the recent all-
time high of 20222. From a technical standpoint, the next retracement
level to monitor is the 61.8% retracement around 19880, followed by a
key resistance level at the psychological mark of 20000. Notably, prices
closed above major moving averages, and the RSI smoothened
indicator has given a buy signal. While these factors favor a bullish
outlook, it's worth noting that the recent pullback may not be as robust,
as indicated by the small daily candles, and geopolitical concerns still
linger in the background. As a result, we maintain a cautious stance on
aggressive long positions, as any unexpected negative news can trigger
sharp sell-offs in such conditions. It might be prudent to wait for
confirmation of price sustainability, closely monitoring how the
benchmark performs during the weekly expiry session and the start of
the earnings season.
The recommended approach is to avoid complacency, considering
buying during dips and taking profits at higher levels. An immediate
support level can be found around the bullish gap left yesterday
around the 19700, followed by the 20-day EMA placed around the
19650 mark. The real opportunities for outperformance can be
found outside the Index, but it's crucial to be selective when
pursuing them.
Key Levels
Support 1 – 19700 Resistance 1 – 19880
Support 2 – 19650 Resistance 2 – 20000

www.angelone.in
Technical & Derivatives Report
October
1
2
,
2023
View
The Indian equity market had a cheerful start and
witnessed a follow-up buying in the initial hour of
trade to surpass 19800 mark. With a narrow trade
during the remaining part of the day, index
concluded the day tad above 19800.
FIIs were net sellers in the cash market segment to
the tune of Rs. 422 cr. Simultaneously, they bought
worth Rs. 1120 cr in Index futures with a decline in
open interest, indicating short covering for second
consecutive session.
On the derivatives front, we saw a decent short
covering activity in key indices. FIIs continued with a
selling streak in equities but preferred covering
bearish bets in the index futures segment. Hence,
their index futures LSR improved slightly to 29% from
27% seen on Friday. We observed massive writing in
19750-19800 put strikes. On the flip side, 19900
followed by 20000 call strike have attracted
substantial open interest. At this point in time, it’s
advisable avoiding any aggressive bets until the
global uncertainty subsides.
Comments
The Nifty futures open interest has decreased by 3.93%
and Bank Nifty futures open interest has decreased by
4.77% as the market closed at 19811.35.
The Nifty October future closed with a premium of
38.75 points against 26.8 points in the last trading
session. The November series closed at a premium of
154.40 points.
The INDIA VIX has decreased from 11.27 to 10.99. At
the same time, the PCR-OI of Nifty has decreased from
1.31 to 1.22.
A few of the liquid counters where we have seen high
cost of carry are MOTHERSON, CROMPTON, CUB, BEL
and BIOCON.
Historical Volatility
SCRIP HV
HEROMOTOCO 29.46
WIPRO 26.27
GRASIM 26.58
RAMCOCEM 32.56
IDEA 65.95
Nifty Vs OI
19000
19200
19400
19600
19800
20000
20200
20400
20600
9,000
9,500
10,000
10,500
11,000
11,500
12,000
12,500
13,000
13,500
14,000
9-19 9-25 9-27 9-29 10-5 10-9
Openinterest Nifty
OI Gainers
SCRIP OI
OI
CHG. (%)
PRICE
PRICE
CHG. (%)
INDIACEM 26108700 22.34 228.85 0.13
ICICIPRULI 8943000 22.27 524.90 -2.85
BANKBARODA 136328400 18.28 207.20 -3.44
TATACHEM 8607500 16.37 1036.10 1.79
DEEPAKNTR 2807400 13.44 2093.65 1.23
INDIAMART 753900 13.30 2831.10 -0.04
BALRAMCHIN 12680000 12.70 420.85 -1.00
COFORGE 1405200 8.83 5154.65 -1.29
OI Losers
SCRIP OI
OI
CHG. (%)
PRICE
PRICE
CHG. (%)
MCX 17600 -12.96 2156.20 2.44
ULTRACEMCO 1491100 -9.34 8342.65 2.12
COALINDIA 72353400 -6.95 301.85 -0.53
COROMANDEL 1398600 -5.40 1148.65 -2.12
ESCORTS 2079275 -5.31 3399.95 -0.08
TITAN 5578500 -4.99 3280.50 0.18
HEROMOTOCO 3717300 -4.82 3100.85 4.27
ITC 60048000 -4.44 448.25 0.84
Put-Call Ratio
SCRIP PCR (OI) PCR (VOL)
NIFTY 1.22 0.95
BANKNIFTY 0.80 0.89
RELIANCE 0.59 0.36
ICICIBANK 0.57 0.56
INFY 0.63 0.60
www.angelone.in
Technical & Derivatives Report
October
1
2
,
2023
Note: Above mentioned Bullish or Bearish Spreads in Nifty (Oct Series) are given as an information and not as a recommendation.
Nifty Spot =
19
811.35
FII Statistics for
October
1
1
, 2023
Detail Buy
Contracts
OI Value
(in Cr.)
Sell Net
CHANGE
INDEX
FUTURES
2969.39
1848.90
1120.49
171619
14260.86
(4.60)
INDEX
OPTIONS
1954438.86
1977593.27
(23154.41) 2811097
251411.89
(16.00)
STOCK
FUTURES
12669.15
11733.20
935.95
2384094
189100.31
0.17
STOCK
OPTIONS
20211.98
20201.11
10.87
198429
16088.24
4.83
Total
1990289.38
2011376.48
(21087.10) 5565239
470861.30
(8.70)
Turnover on
October
1
1
, 2023
Instrument
No. of
Contracts
Turnover
(in Cr.)
Change
(%)
Index Futures
253639 20474.86
-12.31
Index Options
303253514
45019.98
18.81
Stock Futures
673337 56255.98
0.00
Stock Options
3205371 3949.99 -11.35
Total
32,05,371 3949.99 3.07
Bull-Call Spreads
Action Strike Price Risk Reward BEP
Buy
19800
193.20 56.05
43.95
19856.05
Sell
19900
137.15
Buy
19800 193.20 99.75
100.25
19899.75
Sell
20000 93.45
Buy
19900
137.15 43.70 56.30 19943.70
Sell
20000 93.45
Bear-Put Spreads
Action Strike Price Risk Reward BEP
Buy
19800 139.35
33.95
66.05
19766.05
Sell 19700 105.40
Buy 19800 139.35
61.30
138.70
19738.70
Sell
19600 78.05
Buy
19700 105.40
27.35 72.65 19672.65
Sell 19600 78.05
Nifty Put
-
Call Analysis
,0
500,000
1000,000
1500,000
2000,000
2500,000
3000,000
3500,000
4000,000
4500,000
5000,000
19200 19300 19400 19500 19600 19700 19800 19900 20000 20100 20200 20300 20400 20500
Call Put

www.angelone.in
Technical & Derivatives Report
October
1
2
,
2023
`
Daily Pivot Levels for Nifty Constituents
Scrips S2 S1 PIVOT R1 R2
ADANIENT 2,448 2,468 2,503 2,524 2,559
ADANIPORTS 803 809 818 824 833
APOLLOHOSP 5,024 5,059 5,099 5,134 5,174
ASIANPAINT 3,134 3,149 3,167 3,182 3,200
AXISBANK 1,005 1,012 1,019 1,026 1,033
BAJAJ-AUTO 5,025 5,045 5,070 5,090 5,115
BAJFINANCE 8,046 8,074 8,123 8,151 8,201
BAJAJFINSV 1,623 1,630 1,640 1,647 1,658
BPCL 339 341 343 345 347
BHARTIARTL 945 950 953 959 962
BRITANNIA 4,500 4,527 4,548 4,576 4,596
CIPLA 1,136 1,154 1,164 1,182 1,193
COALINDIA 297 299 302 305 308
DIVISLAB 3,697 3,724 3,745 3,772 3,794
DRREDDY 5,477 5,522 5,555 5,600 5,633
EICHERMOT 3,448 3,467 3,481 3,500 3,513
GRASIM 1,903 1,942 1,962 2,000 2,021
HCLTECH 1,220 1,233 1,254 1,266 1,287
HDFCBANK 1,523 1,531 1,537 1,545 1,550
HDFCLIFE 615 618 623 626 631
HEROMOTOCO 2,943 3,022 3,066 3,145 3,190
HINDALCO 477 481 483 487 489
HINDUNILVR 2,498 2,527 2,546 2,575 2,593
ICICIBANK 944 949 955 960 967
INDUSINDBK 1,405 1,413 1,423 1,431 1,440
INFY 1,461 1,478 1,498 1,515 1,535
ITC 443 446 448 450 452
JSW STEEL 770 774 778 782 786
KOTAKBANK 1,751 1,761 1,770 1,781 1,790
LT 3,069 3,079 3,094 3,104 3,120
LTIMINDTREE 5,160 5,202 5,272 5,315 5,385
M&M 1,533 1,544 1,552 1,564 1,571
MARUTI 10,297 10,355 10,397 10,455 10,497
NESTLEIND 22,791 22,997 23,135 23,341 23,479
NTPC 234 237 238 240 242
ONGC 182 182 184 184 186
POWERGRID 197 198 198 199 200
RELIANCE 2,299 2,322 2,336 2,359 2,373
SBILIFE 1,284 1,297 1,304 1,316 1,324
SBIN 582 585 591 594 600
SUNPHARMA 1,116 1,123 1,129 1,135 1,141
TCS 3,577 3,593 3,622 3,638 3,667
TATACONSUM
880 884 891 895 902
TATAMOTORS 630 632 635 637 640
TATASTEEL 124 124 125 126 127
TECHM 1,214 1,223 1,231 1,240 1,248
TITAN 3,248 3,264 3,280 3,296 3,312
ULTRACEMCO 8,093 8,218 8,304 8,429 8,515
UPL 621 625 627 630 633
WIPRO 403 412 418 427 433

www.angelone.in
Technical & Derivatives Report
October
1
2
,
2023
Technical and Derivatives Team:
Sameet Chavan Head Research – Technical & Derivatives sameet.chavan@angelone.in
Sneha Seth Senior Analyst – Technical & Derivatives sneha.seth@angelone.in
Rajesh Bhosale Analyst - Technical rajesh.bhosle@angelone.in
Osho Krishan Senior Analyst – Technical & Derivatives osho.krishan@angelone.in
Hitesh Rathi Analyst – Technical & Derivatives hitesh.rathi@angelone.in
Research Team Tel: 022 – 39357600 Website: www.angelone.in
For Technical Queries E-mail: technicalresearch-cso@angelone.in
For Derivatives Queries E-mail: derivatives.desk@angelone.in
DISCLAIMER
We, Angel One Limited (hereinafter referred to as “Angel”) a company duly incorporated under the provisions of the Companies Act, 1956 with
its registered office at 601, 6th Floor, Ackruti Star, Central Road, MIDC, Andheri East, Mumbai – 400093, CIN: (L67120MH1996PLC101709) and
duly registered as a member of National Stock Exchange of India Limited, Bombay Stock Exchange Limited, Metropolitan Stock Exchange Limited,
Multi Commodity Exchange of India Ltd and National Commodity & Derivatives Exchange Ltd. Angel One limited is a company engaged in
diversified financial services business including securities broking, DP services, distribution of Mutual Fund products. It is also registered as a
Depository Participant with CDSL and Portfolio Manager and Investment Adviser with SEBI. It also has registration with AMFI as a Mutual Fund
Distributor. Angel One Limited is a registered entity with SEBI for Research Analyst in terms of SEBI (Research Analyst) Regulations, 2014 vide
registration number INH000000164 and also registered with PFRDA as PoP ,Registration No.19092018. Angel Group does not have any joint
ventures or associates. Angel One Limited is the ultimate parent company of the Group. Angel or its associates has not been debarred/ suspended
by SEBI or any other regulatory authority for accessing /dealing in securities Market.
AOL was merged with Angel Global Capital Private Limited and subsequently name of Angel Global Capital Private Limited was changed to Angel
Broking Private Limited (AOL) pursuant to scheme of Amalgamation sanctioned by the Hon'ble High Court of Judicature at Bombay by Orders
passed in Company Petition No 710 of 2011 and the approval granted by the Registrar of Companies. Further, name of Angel Broking Private
Limited again got changed to Angel Broking Limited (AOL) pursuant to fresh certificate of incorporation issued by Registrar of Companies (ROC)
dated June 28, 2018. Further name of Angel Broking name changed to Angel One Ltd pursuant to fresh certificate of incorporation issued by
Registrar of Companies (ROC) dated 23-09-21.
In case of any grievances please write to: support@angelone.in, Compliance Officer Details: Name : Hiren Thakkar, Tel No. –08657864228, Email
id - compliance@angelone.in
Registration granted by SEBI and certification from NISM in no way guarantee performance of the intermediary or provide any assurance of returns
to investors.
This document is solely for the personal information of the recipient, and must not be singularly used as the basis of any investment decision.
Nothing in this document should be construed as investment or financial advice. Each recipient of this document should make such investigations
as they deem necessary to arrive at an independent evaluation of an investment in the securities of the companies referred to in this document
(including the merits and risks involved), and should consult their own advisors to determine the merits and risks of such an investment.
Angel or its associates or research analyst or his relative may have actual/beneficial ownership of 1% or more in the securities of the subject
company at the end of the month immediately preceding the date of publication of the research report. Neither Angel or its associates nor
Research Analysts or his relative has any material conflict of interest at the time of publication of research report.
Angel or its associates might have received any compensation from the companies mentioned in the report during the period preceding twelve
months from the date of this report for services in respect of managing or co-managing public offerings, corporate finance, investment banking or
merchant banking, brokerage services or other advisory service in a merger or specific transaction in the normal course of business. Angel or its
associates did not receive any compensation or other benefits from the companies mentioned in the report or third party in connection with the
research report. Neither research entity nor research analyst has been engaged in market making activity for the subject company.

www.angelone.in
Technical & Derivatives Report
October
1
2
,
2023
*
Reports based on technical and derivative analysis center on studying charts of a stock's price movement, outstanding positions and trading
volume, as opposed to focusing on a company's fundamentals and, as such, may not match with a report on a company's fundamentals. Investors
are advised to refer the Fundamental and Technical Research Reports available on our website to evaluate the contrary view, if any.
The information in this document has been printed on the basis of publicly available information, internal data and other reliable sources believed
to be true, but we do not represent that it is accurate or complete and it should not be relied on as such, as this document is for general guidance
only. Angel One Limited or any of its affiliates/ group companies shall not be in any way responsible for any loss or damage that may arise to any
person from any inadvertent error in the information contained in this report. Angel One Limited does not warrant the accuracy, adequacy or
completeness of the service, information and materials and expressly disclaims liability for errors or omissions in the service, information and
materials. While Angel One Limited endeavours to update on a reasonable basis the information discussed in this material, there may be
regulatory, compliance, or other reasons that prevent us from doing so.
This document is being supplied to you solely for your information, and its contents, information or data may not be reproduced, redistributed or
passed on, directly or indirectly.
Neither Angel One Limited, nor its directors, employees or affiliates shall be liable for any loss or damage that may arise from or in connection
with the use of this information. Angel or its associates or Research Analyst or his relative might have financial interest in the subject company.
Research analyst has not served as an officer, director or employee of the subject company.
Investment in securities market are subject to market risks. Read all the related documents carefully before investing.
Any communication sent to clients on phone numbers or e-mail ids registered with the Trading Member is meant for client consumption and such
material should not be redistributed. Brokerage will not exceed SEBI prescribed limit. Any Information provided by us through any medium based
on our research or that of our affiliates or third parties or other external sources is subject to domestic and international market conditions and
we do not guarantee the availability or otherwise of any securities or other instruments and such Information is merely an estimation of certain
investments, and we have not and shall not be deemed to have assumed any responsibility for any such Information. You should seek independent
professional advice and/or tax advice regarding the suitability of any investment decision whether based on any Information provided by us
through the Site from inhouse research or third party reports or otherwise.
The report and information contained herein is strictly confidential and meant solely for the selected recipient and may not be altered in any way,
transmitted to, copied or distributed, in part or in whole, to any other person or to the media or reproduced in any form, without prior written
consent.
