SEPT 12, 2022
www.angelone.in
Technical & Derivatives Report
xOOOOOOOO
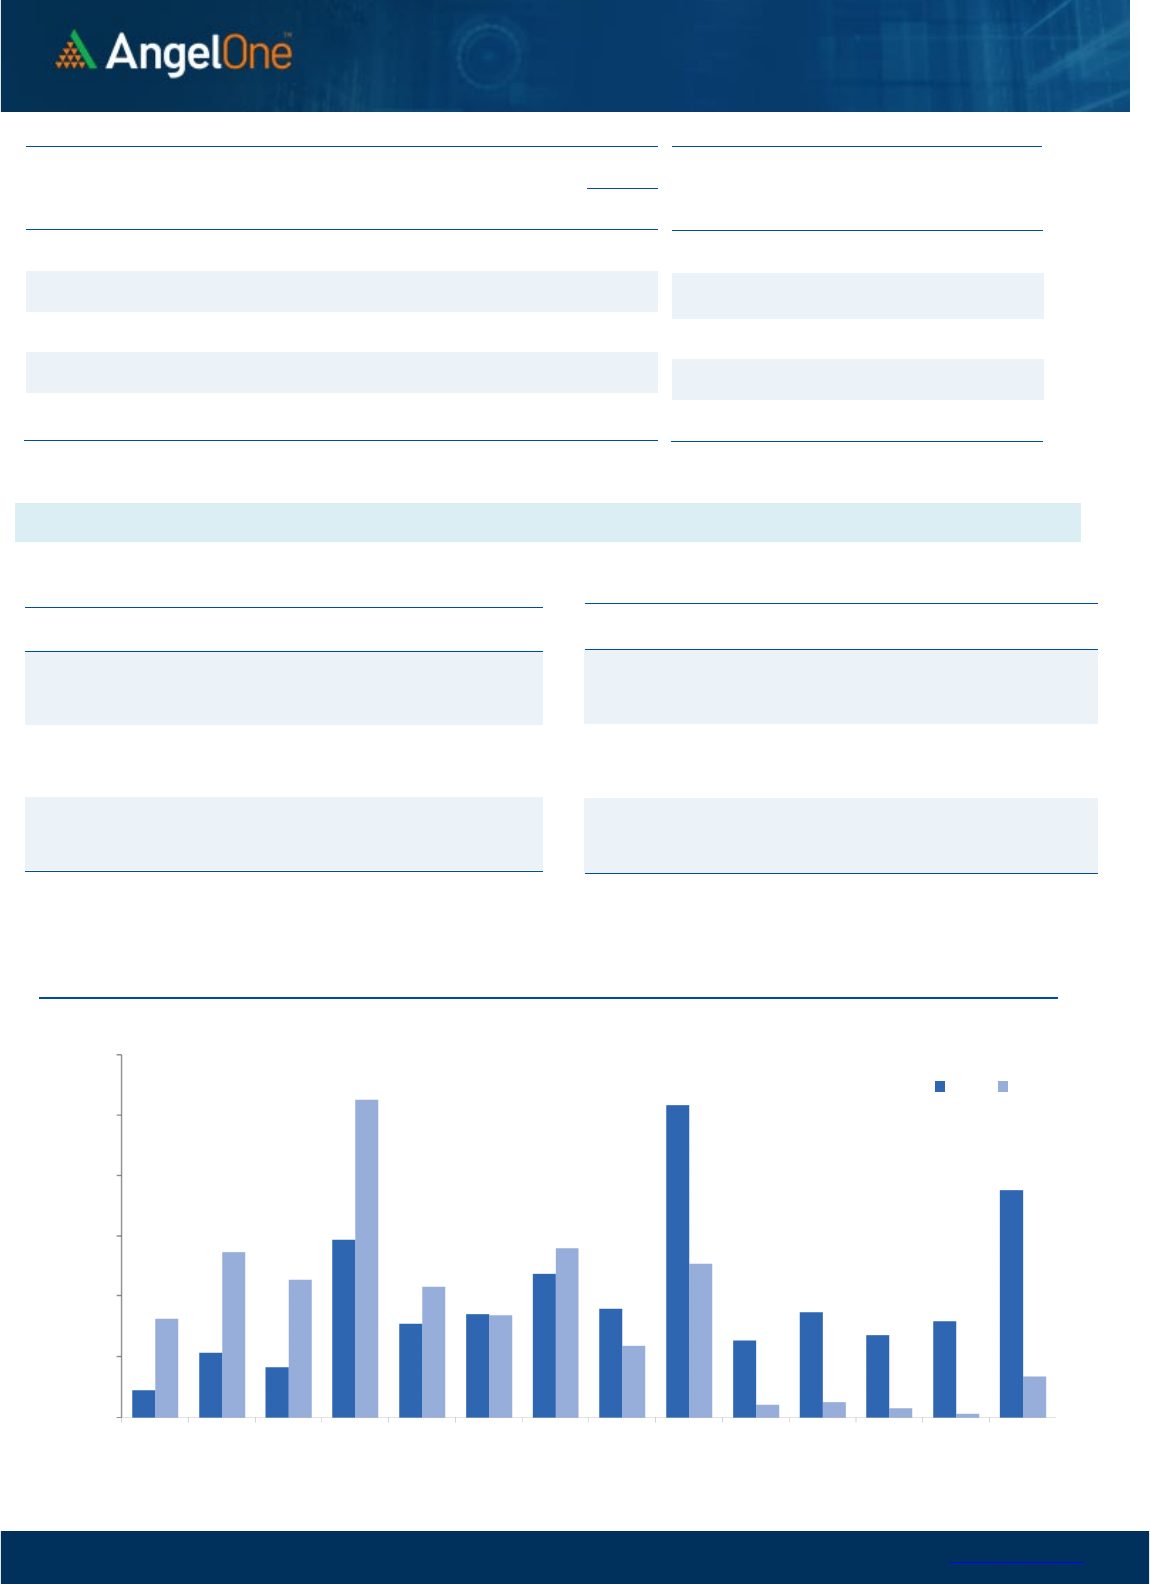
Nifty Bank Outlook (40416)
The Bank Nifty index has seen a strong weekly closure with gains of
over 2.45 percent and has also outperformed the benchmark index.
The banking space has seen some strong traction in the latter half of
the week as it decisively surpassed the 40000 mark and has uplifted
the overall market sentiments.
On the technical parameters, the index has been on a bullish spree
from the past three consecutive weeks. Currently, the index is at the
highest point for the calendar year 2022, adding a strong bullish
quotient to the market. As far as levels are concerned, the breakout
from the 39600-39800 zone is expected to cushion any blip, while on
the higher end, it is likely to march towards the lifetime high zone, a
tad above the 41000 mark. Also, looking at the recent price action and
placement on the daily chart, the index is likely to remain upbeat and
any correction towards the mentioned support zone could be seen as
an opportunity to go long in the index in the near period.
Key Levels
Support 1 – 40100 Resistance 1 – 40700
Support 2 – 39900 Resistance 2 – 41000
Exhibit 1: Nifty
Daily
Chart
Exhibit 2: Nifty Bank
Daily
Chart
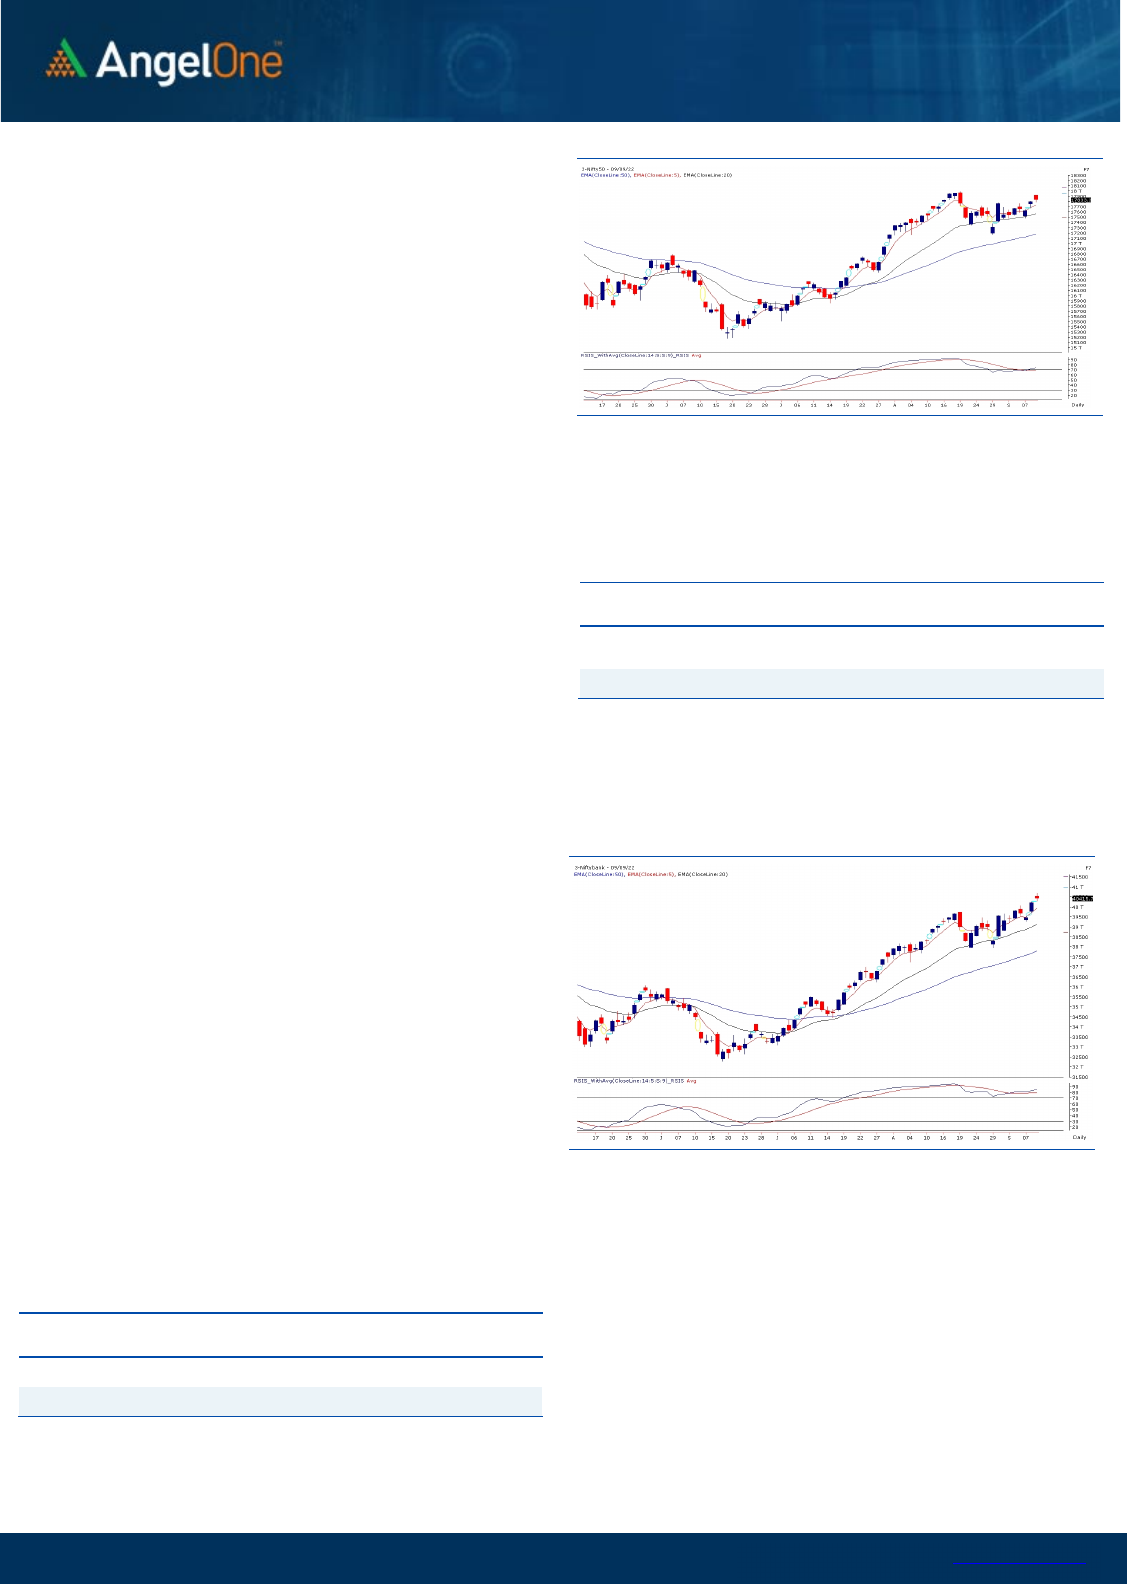
Sensex (59793) / Nifty (17833)
In last couple of sessions, oversold US markets gave a sharp rebound
which provided the much-needed trigger for Nifty to come out of the
recent congestion phase. On Friday, we had a gap up opening however
we lacked follow-up buying and with some hint of profit booking, the
Nifty concluded the week convincingly above 17800 by adding 1.68%
to the previous weekly close.
In last couple of weeks, our domestic markets maintained their sturdy
structure, whereas the US bourses were continuing with their declining
trend. This development was clearly restricting our key indices to
surpass the higher boundary of the consolidation range despite having
an inherent strength. The moment global recovery took place, we
witnessed a breakout from the sturdy wall of 17700 – 17800.
Importantly, the banking space was the major charioteer of this move
as we saw banking index clocking gains over 2.50% and has closed at
10-months highest level. Whenever financial counters contribute to the
rally, it needs to be construed as a healthy rally. Moreover, the most
laggard heavyweight basket, IT showed some encouraging signs
towards the fag end of the week. This provided credence to the move
and adds conviction to retest the recent psychological level of 18000 in
this week itself. In fact, if global peers support, we will not be surprised
to see it extending towards 18200 – 18350 levels. Let’s see how things
pan out going ahead.
We advise traders to continue with their recent ‘Buy on declines’
strategy and use decline towards the support zone of 17675 – 17500
to add fresh longs. Also, the broader end of the spectrum is clearly
on a roll and hence, one should keep focusing on potential movers
from the cash segment, which are likely to fetch higher returns.
Key Levels
Support 1 – 17700 Resistance 1 – 17900
Support 2 – 17675 Resistance 2 – 18000

www.angelone.in
Technical & Derivatives Report
SEPT 12, 2022
View
The Indian equity market has witnessed a strong
weekly closure and maintained its sturdy structure.
The benchmark index Nifty concluded the week with
gains of 1.68 percent, a tad above 17800 level.
FIIs were net buyers in the cash market segment to
the tune of Rs. 2132 crores. Simultaneously, in Index
futures, they sold worth Rs. 125 crores with a decrease
in open interest, indicating long unwinding.
Looking at the overall F&O data, we have witnessed
long formation in the banking index, while some
unwinding in Nifty. On the options front, piling up of
positions is visible in the 17700-17800 put strikes,
indicating nearby support formation, while the
sacrosanct support lies at 17500 for Nifty. While on the
higher end, the maximum OI concentration is seen at
18000 call strike, which is likely to act as stiff
resistance in the comparable period. Meanwhile, the
stronger hands have seen adding up positions in cash
as well as future segments throughout the week and
have also expanded their ‘Long Short Ratio’, which
surged to 22% from 19% WoW. Simultaneously, it is
advisable to keep a close tab on the mentioned levels
and global developments.
Comments
The Nifty futures open interest has decreased by
0.96%. and Bank Nifty futures open interest has
increased by 0.07% as the market closed at 17833.35.
The Nifty Sep future closed with a premium of 33.10
point against a premium of 25.60 point in the last
trading session. The Oct series closed at a premium
of 84.10 point.
The INDIA VIX decreased from 18.30 to 17.71. At the
same time, the PCR-OI of Nifty has decreased from
1.26 to 1.10.
Few of the liquid counters where we have seen high
cost of carry are GSPL, RAIN, PVR, ASTRAL and
GUJGASLTD.
Historical
Volatility
SCRIP HV
IDEA 82.25
RBLBANK 73.30
IBULHSGFIN 73.11
ZEEL 64.42
HINDCOPPER 63.36
Nifty Vs OI
17300
17400
17500
17600
17700
17800
17900
8,000
9,000
10,000
11,000
12,000
13,000
14,000
15,000
16,000
17,000
18,000
8/22 8/24 8/30 9/2 9/6 9/8
Openinterest Nifty
OI Gainers
SCRIP OI
OI
CHG. (%)
PRICE
PRICE
CHG. (%)
GSPL 4905000 38.66 254.00 6.26
ASTRAL 1478950 34.65 2594.10 5.05
PVR 3680908 26.90 1834.10 -4.62
GUJGASLTD 5113750 20.89 507.20 4.15
SHREECEM 449200 15.62 24505.10 0.54
VOLTAS 4872500 10.48 966.15 -1.07
IBULHSGFIN 43656000 9.84 139.45 2.56
LTTS 1018400 9.69 3752.95 3.90
OI Losers
SCRIP OI
OI
CHG. (%)
PRICE
PRICE
CHG. (%)
CROMPTON 4102500 -8.10 417.15 0.99
WHIRLPOOL 684250 -8.09 1754.40 -2.99
CONCOR 7049000 -7.88 752.70 3.30
DIXON 589500 -7.11 4540.05 3.11
BANDHANBNK 29307600 -6.58 293.50 0.44
POLYCAB 867300 -5.52 2528.80 1.18
INFY 36091500 -5.35 1511.65 2.61
AARTIIND 2831350 -4.69 859.80 0.56
Put-Call Ratio
SCRIP PCR (OI) PCR (VOL)
NIFTY 1.10 0.92
BANKNIFTY 0.98 0.97
RELIANCE 0.54 0.46
ICICIBANK 0.71 0.62
INFY 0.44 0.32
www.angelone.in
Technical & Derivatives Report
SEPT 12, 2022
Note: Above mentioned Bullish or Bearish Spreads in Nifty (Sep Series) are given as an information and not as a recommendation.
Nifty Spot =
17,
833
.
3
5
FII Statistics for
September
0
9
, 2022
Detail Buy
Contracts
Open
Interest
Value
(in Cr.)
Sell
Net
CHANGE
INDEX
FUTURES
2118.10 2243.46 (125.36) 135836 12691.65 (4.49)
INDEX
OPTIONS
497944.30 489038.80 8905.50
1291753 119196.49 43.19
STOCK
FUTURES
11986.76 12232.47 (245.71) 2111615 150070.88 0.11
STOCK
OPTIONS
7803.00 8040.49 (237.49) 163206 11784.03 4.50
Total 519852.16
511555.22
8296.94
3702410
293743.05
11.86
Turnover on
September
0
9
, 2022
Instrument
No. of
Contracts
Turnover
( in Cr. )
Change
(%)
Index
Futures
298985 28378.35 -20.04
Index
Options
68747452
6601775.25 -74.31
Stock
Futures
911853 66432.95 17.93
Stock
Options
3623689 273347.18 35.47
Total
36,23,689 273347.18 -73.19
Bull-Call Spreads
Action Strike Price Risk Reward BEP
Buy
17800 298.55
55.20
44.80
17855.20
Sell
17900 243.35
Buy
17800 298.55
103.45
96.55
17903.45
Sell
18000 195.10
Buy
17900 243.35
48.25 51.75 17948.25
Sell 18000 195.10
Bear
-
Put Spreads
Action Strike Price Risk Reward BEP
Buy 17800 239.35
43.15
56.85
17756.85
Sell
17700 196.20
Buy 17800 239.35
76.60
123.40
17723.40
Sell 17600 162.75
Buy
17700 196.20
33.45 66.55 17666.55
Sell 17600 162.75
Nifty Put
-
Call Analysis
,0
500,000
1000,000
1500,000
2000,000
2500,000
3000,000
17200 17300 17400 17500 17600 17700 17800 17900 18000 18100 18200 18300 18400 18500
Call Put

www.angelone.in
Technical & Derivatives Report
SEPT 12, 2022
`
Daily Pivot Levels for Nifty Constituents
Scrips
S2
S1
PIVOT
R1 R2
ADANIPORTS
868
888
906
926
944
APOLLOHOSP 4,390 4,425
4,450
4,485
4,510
ASIANPAINT 3,403 3,422
3,453 3,473 3,503
AXISBANK 776 781
784
789
792
BAJAJ-AUTO
3,810
3,829
3,855 3,874 3,900
BAJFINANCE 7,064 7,123
7,223
7,282
7,382
BAJAJFINSV
16,884
17,045
17,315
17,476
17,746
BPCL
333
336
339
341
344
BHARTIARTL 756 761
768
773
780
BRITANNIA 3,606 3,628
3,664 3,686
3,722
CIPLA
1,049
1,054
1,060
1,065
1,071
COALINDIA 232 235
236
239 241
DIVISLAB 3,549 3,576
3,598
3,625
3,647
DRREDDY 4,200 4,228
4,274
4,301
4,347
EICHERMOT 3,405 3,439
3,461
3,495
3,517
GRASIM
1,707
1,728
1,763
1,783
1,818
HCLTECH 927 938
945
956
964
HDFCBANK
1,486
1,492
1,501
1,507
1,516
HDFCLIFE
566
571
580
585
594
HDFC
2,399
2,415
2,442 2,458
2,485
HEROMOTOCO 2,804 2,821
2,850
2,867
2,895
HINDALCO 419 423
427
430
434
HINDUNILVR 2,543 2,566
2,606
2,629
2,670
ICICIBANK
889
895
904
910
918
INDUSINDBK
1,101
1,119
1,134
1,152
1,167
INFY
1,464
1,488
1,504
1,528
1,544
ITC
328
329
331
333
335
JSW STEEL 675 681
691
697
708
KOTAKBANK
1,897
1,912
1,931 1,946
1,965
LT 1,917 1,933
1,960
1,977
2,004
M&M
1,267
1,284
1,311
1,328
1,355
MARUTI 8,629 8,788
8,888
9,047
9,147
NESTLEIND
18,758
18,905
19,137
19,284
19,517
NTPC 164 165
167
169
171
ONGC
131
133
133
135
136
POWERGRID
220
222
224
225
228
RELIANCE 2,535 2,552
2,581
2,598
2,627
SBILIFE
1,270
1,284
1,305
1,319
1,341
SHREECEM 23,445 23,975
24,763 25,293
26,080
SBIN
544
549
553
558
562
SUNPHARMA
878
884
893
899
908
TCS
3,142
3,180
3,207
3,245
3,272
TATACONSUM
805
811
819 824
833
TATAMOTORS
436
441
445
450
454
TATASTEEL 104 105
106
107
108
TECHM
1,069
1,098
1,115
1,144
1,161
TITAN 2,557 2,580
2,616
2,639
2,675
ULTRACEMCO 6,594 6,689
6,859 6,954
7,124
UPL
730
736
746
753
763
WIPRO
408
413
416 421
424

www.angelone.in
Technical & Derivatives Report
SEPT 12, 2022
*
Technical and Derivatives Team:
Sameet Chavan Chief Analyst – Technical & Derivatives sameet.chavan@angelone.in
Sneha Seth Senior Analyst – Technical & Derivatives sneha.seth@angelone.in
Rajesh Bhosale Technical Analyst rajesh.bhosle@angelone.in
Osho Krishan Senior Analyst – Technical & Derivatives osho.krishan@angelone.in
Research Team Tel: 022 – 39357600 (Extn. 6844) Website: www.angelone.in
For Technical Queries E-mail: technicalresearch-cso@angelone.in
For Derivatives Queries E-mail: derivatives.desk@angelone.in
DISCLAIMER
Angel One Limited (hereinafter referred to as “Angel”) is a registered Member of National Stock Exchange of India Limited, Bombay
Stock Exchange Limited and Metropolitan Stock Exchange Limited. It is also registered as a Depository Participant with CDSL and
Portfolio Manager and investment advisor with SEBI. It also has registration with AMFI as a Mutual Fund Distributor. Angel One
Limited is a registered entity with SEBI for Research Analyst in terms of SEBI (Research Analyst) Regulations, 2014 vide registration
number INH000000164. Angel or its associates has not been debarred/ suspended by SEBI or any other regulatory authority for
accessing /dealing in securities Market.
This document is solely for the personal information of the recipient, and must not be singularly used as the basis of any investment
decision. Nothing in this document should be construed as investment or financial advice. Each recipient of this document should
make such investigations as they deem necessary to arrive at an independent evaluation of an investment in the securities of the
companies referred to in this document (including the merits and risks involved), and should consult their own advisors to determine
the merits and risks of such an investment.
Angel or its associates or research analyst or his relative may have actual/beneficial ownership of 1% or more in the securities of
the subject company at the end of the month immediately preceding the date of publication of the research report. Neither Angel or
its associates nor Research Analysts or his relative has any material conflict of interest at the time of publication of research report.
Angel or its associates might have received any compensation from the companies mentioned in the report during the period
preceding twelve months from the date of this report for services in respect of managing or co-managing public offerings, corporate
finance, investment banking or merchant banking, brokerage services or other advisory service in a merger or specific transaction
in the normal course of business. Angel or its associates did not receive any compensation or other benefits from the companies
mentioned in the report or third party in connection with the research report. Neither Angel nor its research analyst entity has been
engaged in market making activity for the subject company.
Reports based on technical and derivative analysis center on studying charts of a stock's price movement, outstanding positions and
trading volume, as opposed to focusing on a company's fundamentals and, as such, may not match with a report on a company's
fundamentals. Investors are advised to refer the Fundamental and Technical Research Reports available on our website to evaluate
the contrary view, if any.
The information in this document has been printed on the basis of publicly available information, internal data and other reliable
sources believed to be true, but we do not represent that it is accurate or complete and it should not be relied on as such, as this
document is for general guidance only. Angel One Limited or any of its affiliates/ group companies shall not be in any way responsible
for any loss or damage that may arise to any person from any inadvertent error in the information contained in this report. Angel One
Limited has not independently verified all the information contained within this document. Accordingly, we cannot testify, nor make
any representation or warranty, express or implied, to the accuracy, contents or data contained within this document. While Angel
One Limited endeavors to update on a reasonable basis the information discussed in this material, there may be regulatory,
compliance, or other reasons that prevent us from doing so.
This document is being supplied to you solely for your information, and its contents, information or data may not be reproduced,
redistributed or passed on, directly or indirectly.
Neither Angel One Limited, nor its directors, employees or affiliates shall be liable for any loss or damage that may arise from or in
connection with the use of this information. Angel or its associates or Research Analyst or his relative might have financial interest
in the subject company. Research analyst has not served as an officer, director or employee of the subject company.
