May 12, 2022
www.angelone.in
Technical & Derivatives Report
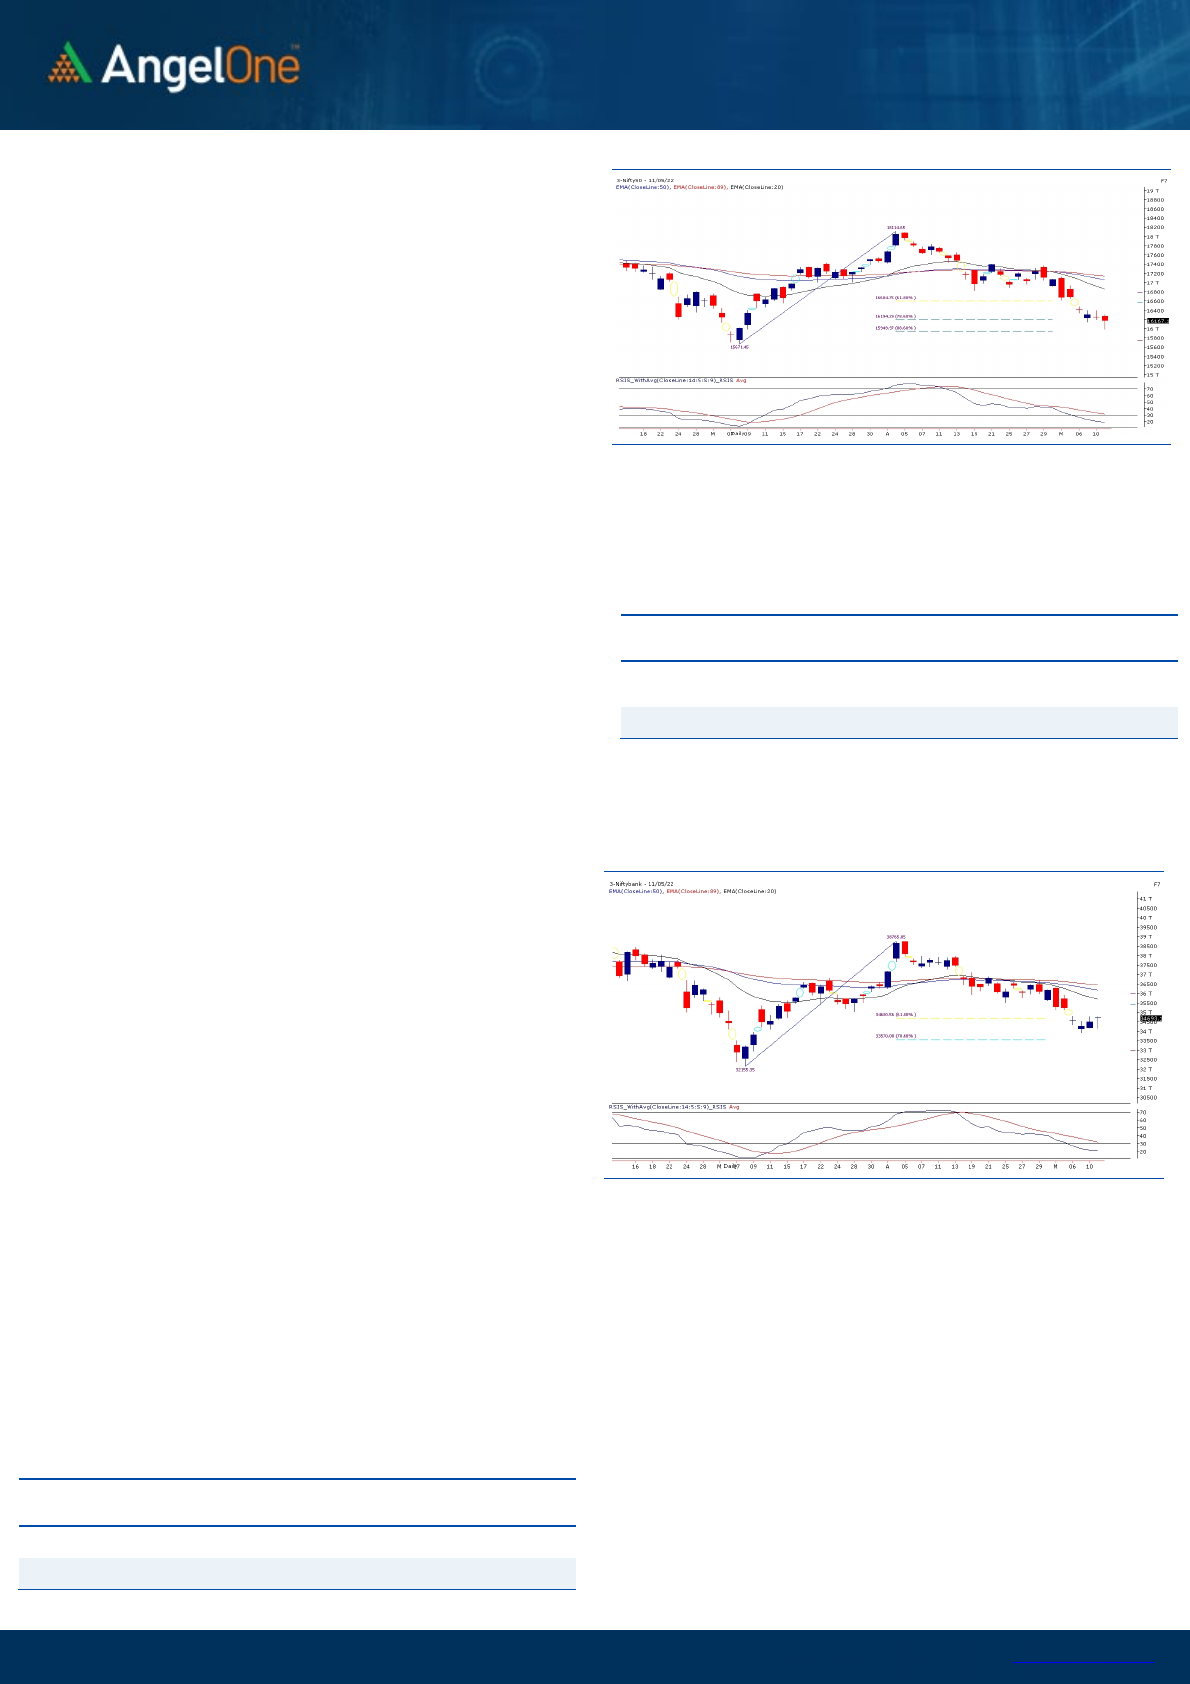
Nifty Bank Outlook
-
(34693)
Unlike recent gap-down opening streak, our markets started
the day on a pleasant note in line with most of the Asian peers.
The banking index too commenced with decent gains; but once
again at higher levels, traders started liquidating their trades
which resulted in giving up all gains and therefore, trading well
inside the negative territory. Markets were on the cusp of a
break down from their key levels but fortunately, a smart buying
in most of the heavyweight counters lifted the BANKNIFTY
higher to conclude at opening levels.
Since last couple of days, the banking space is showing some
resilience as its continue to buck the trend. In a way, it turned
out to be a saviour for our benchmark index as it managed to
pulled the Nifty from the psychological mark of 16000.
Yesterday’s close has left us with some promise and if global
markets supports, we may see a good relief rally in our market
backed by the dominance of the banking counters. As far as
levels are concerned, 34800 is the level to watch out for above
which BANKNIFTY can test next levels of 35000 – 35200. On the
flipside, 34200 – 34000 remains a sacrosanct support zone.
Key Levels
Support 1 – 34200 Resistance 1 – 35000
Support 2 – 34000 Resistance 2 – 35200
Exhibit 1: Nifty Daily Chart
Exhibit 2: Nifty Bank Daily Chart
Sensex (54088) / Nifty (16167)
Led by the overnight recovery in the global market, our market
started the session on a stable note. The benchmark index
Nifty50 witnessed a flat opening that soon went into a correction
as an across-board sell-off triggered and tested the 16000 odd
zone at the lower end. The bearishness intensified; however, the
market gets hold of the fall in the latter half and gradually
apprehends to pare down the losses. The recovery was quite
significant, wherein Nifty concluded the day with a mere cut of
0.45 percent, a tad above the 16150 level.
The technical structure looks very disruptive, with all indicators
signifying the trend southwards. Any breach below the 16000
mark could open the possibility of re-testing the previous swing
low of 15700 odd levels. Yesterday’s recovery from the
psychological level of 16000 in Nifty, led by the banking space,
bodes well for the bulls. Also, the midcap index saw some relief
in the latter half of the day, indicating a further recovery in the
coming session. However, the downward trend remains intact till
the time the unfilled gap of 16480-16650 on the higher end is not
taken over. Since the macro factors have weighed down heavily
on the global front, it would be important to have a regular tab
on these developments.
Going forward, the inflation data for the US
market is
expected to dictate the near-term trend among the global
bourses. Meanwhile, aggressive bets should be avoided till
the time global nervousness subsides completely.
Key Levels
Support 1 – 16000 Resistance 1 – 16300
Support 2 – 15950 Resistance 2 – 16400

www.angelone.in
Technical & Derivatives Report
May 12, 2022
View
Yesterday, our market opened with minor gains but
at it approached the territory around 16300, selling
got aggravated to not only test Monday’s low but
also the psychological mark of 16000. Fortunately,
there was no further damage done as market
witnessed a broad based recovery in the latter half
to recover fair bit of ground to close tad below
16200; courtesy to smart surge in the banking
conglomerates.
FIIs were net sellers in the cash market segment
to the tune of Rs. 3609 crores. Simultaneously, in
Index futures, they sold worth Rs. 966 crores with
rise in open interest, indicating short formation.
In F&O space, we saw some short covering in Nifty
and fresh long were visible in case of banking index.
FIIs continued their selling spree in cash segment
and also added decent shorts in index futures
segment. In options front, 16000 put option holds a
maximum outstanding contract and we saw addition
of fresh positions in 16100 put options as well;
suggesting a strong demand zone at 16000-16100.
On the other side, good amount of positions got piled
up in 16200-16500 call options, which is likely to
restrict the upside on the expiry day. Considering
the above data points, we expect some relief going
ahead and hence, would advocate buying ATM call
strikes in case of any dips towards 16050-16100.
Comments
The Nifty futures open interest has increased by 1.44%.
and BANK Nifty futures open interest has increased by
7.09% as the market closed at 16167.10.
The Nifty May future closed with a premium of 10.85
point against a premium of 7.05 point in the last trading
session. The June series closed at a premium of 21.40
point.
The INDIA VIX increased from 22.30 to 22.80. At the
same time, the PCR-OI of Nifty has decreased from 0.76
to 0.69.
Historical Volatility
SCRIP HV
-
-
-
-
-
-
-
-
-
-
*D.V. File not updated on NSE Website during the time of report
publishing
Nifty Vs OI
15400
15600
15800
16000
16200
16400
16600
16800
17000
17200
17400
17600
,0
2,000
4,000
6,000
8,000
10,000
12,000
14,000
16,000
4-21 4-25 4-27 4-29 5-4 5-6 5-10
Openinterest Nifty
OI Gainers
SCRIP OI
OI
CHG. (%)
PRICE
PRICE
CHG. (%)
IBULHSGFIN 47966800 18.58 139.85 -20.74
CANFINHOME 4131075 11.68 504.05 -4.12
INDHOTEL 25897658 8.00 230.40 -2.19
AARTIIND 3307350 7.63 769.05 -2.76
SRF 4303875 6.78 2113.10 5.99
AUBANK 3153500 6.27 1262.70 0.99
HINDALCO 41754075 6.18 423.00 0.12
IGL 16148000 6.07 347.25 0.88
OI Losers
SCRIP OI
OI
CHG. (%)
PRICE
PRICE
CHG. (%)
GUJGASLTD 2886250 -14.29 507.05 6.37
ABB 374500 -9.87 2230.55 1.57
NAM-INDIA 3398400 -9.54 277.45 0.90
CHAMBLFERT 2124000 -9.00 427.45 -4.25
PERSISTENT 446100 -8.07 3951.15 -3.03
DALBHARAT 1308000 -7.64 1421.80 1.94
SYNGENE 1017200 -7.14 567.45 -3.86
TVSMOTOR 7394800 -6.99 616.20 0.77
Put-Call Ratio
SCRIP PCR (OI) PCR (VOL)
NIFTY 0.69 0.74
BANKNIFTY 0.85 0.94
RELIANCE 0.28 0.38
ICICIBANK 0.44 0.50
INFY 0.37 0.47

www.angelone.in
Technical & Derivatives Report
May 12, 2022
Note: Above mentioned Bullish or Bearish Spreads in Nifty (May Series) are given as an information and not as a recommendation.
Nifty Spot = 16,
167.10
FII Statistics for
May
1
1
, 202
2
Detail Buy
Contracts
Open
Interest
Value
(in Cr.)
Sell
Net
CHANGE
INDEX
FUTURES
4950.35 5915.99 (965.64) 185414 15356.15 6.97
INDEX
OPTIONS
955845.41 952309.26 3536.15
1832056 150309.15 11.93
STOCK
FUTURES
17286.98 16860.38 426.60
2236802 137940.65 0.83
STOCK
OPTIONS
7816.72 7757.74 58.98
131652 8438.49 5.65
Total
985899.46
982843.37
3056.09
4385924
312044.44
5.61
Turnover on
May
11
, 2
022
Instrument
No. of
Contracts
Turnover
( in Cr. )
Change
(%)
Index
Futures
553552 46005.20 14.90
Index
Options
137017332 11516390.13
49.21
Stock
Futures
1043365 63843.15 10.66
Stock
Options
3074673 204774.73 6.62
Total
30,74,673 204774.73 47.74
Bull
-
Call Spreads
Action Strike Price Risk Reward BEP
Buy
16200 259.45
48.25
51.75
16248.25
Sell
16300 211.20
Buy
16200 259.45
90.50
109.50
16290.50
Sell
16400 168.95
Buy
16300 211.20
42.25 57.75 16342.25
Sell 16400 168.95
Bear
-
Put Spreads
Action Strike Price Risk Reward BEP
Buy
16200 286.50
47.65
52.35
16152.35
Sell
16100 238.85
Buy
16200 286.50
85.70
114.30
16114.30
Sell
16000 200.80
Buy
16100 238.85
38.05 61.95 16061.95
Sell
16000 200.80
Nifty Put
-
Call Analysis
,0
1000,000
2000,000
3000,000
4000,000
5000,000
6000,000
15500 15600 15700 15800 15900 16000 16100 16200 16300 16400 16500 16600 16700 16800
Call Put

www.angelone.in
Technical & Derivatives Report
May 12, 2022
`
Daily Pivot Levels for Nifty Constituents
Scrips
S2
S1
PIVOT
R1
R2
ADANIPORTS 729 744
765 780 801
APOLLOHOSP 3,563 3,621
3,678 3,736 3,793
ASIANPAINT 2,917 2,985
3,047 3,116 3,178
AXISBANK 647 660
668 680 688
BAJAJ-AUTO 3,502 3,557
3,593 3,648 3,683
BAJFINANCE 5,587 5,697
5,847 5,957 6,106
BAJAJFINSV 12,759 13,044
13,438 13,723 14,116
BPCL 336 341
350 356 365
BHARTIARTL 707 715
725 733 743
BRITANNIA 3,157 3,209
3,246 3,297 3,335
CIPLA 890 914
928 952 967
COALINDIA 161 166
170 174 178
DIVISLAB 4,199 4,246
4,288 4,335 4,376
DRREDDY 3,801 3,842
3,893 3,934 3,985
EICHERMOT 2,311 2,350
2,392 2,431 2,473
GRASIM 1,480 1,508
1,536 1,563 1,591
HCLTECH 1,040 1,050
1,065 1,075 1,090
HDFCBANK 1,318 1,333
1,344 1,360 1,370
HDFCLIFE 550 557
566 573 582
HDFC 2,163 2,191
2,214 2,243 2,266
HEROMOTOCO 2,354 2,412
2,466 2,524 2,577
HINDALCO 406 414
422 430 438
HINDUNILVR 2,083 2,123
2,156 2,197 2,230
ICICIBANK 701 708
714 720 726
INDUSINDBK 878 900
914 937 951
INFY 1,491 1,509
1,529 1,547 1,568
ITC 246 251
257 261 267
JSW STEEL 625 637
647 660 670
KOTAKBANK 1,786 1,798
1,808 1,820 1,830
LT 1,527 1,549
1,579 1,601 1,631
M&M 865 876
887 898 909
MARUTI 7,221 7,309
7,434 7,522 7,647
NESTLEIND 16,058 16,285
16,462 16,689 16,866
NTPC 146 149
153 156 160
ONGC 151 155
157 161 164
POWERGRID 233 236
242 245 251
RELIANCE 2,389 2,419
2,452 2,482 2,515
SBILIFE 1,065 1,076
1,090 1,101 1,116
SHREECEM 22,302 22,842
23,791 24,331 25,280
SBIN 458 467
473 482 488
SUNPHARMA 842 848
858 864 874
TCS 3,348 3,380
3,414 3,446 3,481
TATACONSUM
726 735
747 756 768
TATAMOTORS 368 378
388 398 407
TATASTEEL 1,093 1,129
1,160 1,197 1,228
TECHM 1,174 1,199
1,232 1,258 1,291
TITAN 2,074 2,094
2,116 2,137 2,158
ULTRACEMCO 6,102 6,221
6,329 6,448 6,555
UPL 766 779
796 809 826
WIPRO 453 462
472 482 492

www.angelone.in
Technical & Derivatives Report
May 12, 2022
*
Technical and Derivatives Team:
Sameet Chavan
Chief Analyst
–
Technical & Derivatives
sameet.chavan@angelone.in
Sneha Seth Senior Analyst – Technical & Derivatives sneha.seth@angelone.in
Rajesh Bhosale Technical Analyst rajesh.bhosle@angelone.in
Osho Krishan Senior Analyst – Technical & Derivatives osho.krishan@angelone.in
Research Team Tel: 022 – 39357600 (Extn. 6844) Website: www.angelone.in
For Technical Queries E-mail: technicalresearch-cso@angelone.in
For Derivatives Queries E-mail: derivatives.desk@angelone.in
DISCLAIMER
Angel One Limited (hereinafter referred to as “Angel”) is a registered Member of National Stock Exchange of India Limited, Bombay
Stock Exchange Limited and Metropolitan Stock Exchange Limited. It is also registered as a Depository Participant with CDSL and
Portfolio Manager and investment advisor with SEBI. It also has registration with AMFI as a Mutual Fund Distributor. Angel One
Limited is a registered entity with SEBI for Research Analyst in terms of SEBI (Research Analyst) Regulations, 2014 vide registration
number INH000000164. Angel or its associates has not been debarred/ suspended by SEBI or any other regulatory authority for
accessing /dealing in securities Market.
This document is solely for the personal information of the recipient, and must not be singularly used as the basis of any investment
decision. Nothing in this document should be construed as investment or financial advice. Each recipient of this document should
make such investigations as they deem necessary to arrive at an independent evaluation of an investment in the securities of the
companies referred to in this document (including the merits and risks involved), and should consult their own advisors to determine
the merits and risks of such an investment.
Angel or its associates or research analyst or his relative may have actual/beneficial ownership of 1% or more in the securities of
the subject company at the end of the month immediately preceding the date of publication of the research report. Neither Angel or
its associates nor Research Analysts or his relative has any material conflict of interest at the time of publication of research report.
Angel or its associates might have received any compensation from the companies mentioned in the report during the period
preceding twelve months from the date of this report for services in respect of managing or co-managing public offerings, corporate
finance, investment banking or merchant banking, brokerage services or other advisory service in a merger or specific transaction
in the normal course of business. Angel or its associates did not receive any compensation or other benefits from the companies
mentioned in the report or third party in connection with the research report. Neither Angel nor its research analyst entity has been
engaged in market making activity for the subject company.
Reports based on technical and derivative analysis center on studying charts of a stock's price movement, outstanding positions and
trading volume, as opposed to focusing on a company's fundamentals and, as such, may not match with a report on a company's
fundamentals. Investors are advised to refer the Fundamental and Technical Research Reports available on our website to evaluate
the contrary view, if any.
The information in this document has been printed on the basis of publicly available information, internal data and other reliable
sources believed to be true, but we do not represent that it is accurate or complete and it should not be relied on as such, as this
document is for general guidance only. Angel One Limited or any of its affiliates/ group companies shall not be in any way responsible
for any loss or damage that may arise to any person from any inadvertent error in the information contained in this report. Angel One
Limited has not independently verified all the information contained within this document. Accordingly, we cannot testify, nor make
any representation or warranty, express or implied, to the accuracy, contents or data contained within this document. While Angel
One Limited endeavors to update on a reasonable basis the information discussed in this material, there may be regulatory,
compliance, or other reasons that prevent us from doing so.
This document is being supplied to you solely for your information, and its contents, information or data may not be reproduced,
redistributed or passed on, directly or indirectly.
Neither Angel One Limited, nor its directors, employees or affiliates shall be liable for any loss or damage that may arise from or in
connection with the use of this information. Angel or its associates or Research Analyst or his relative might have financial interest
in the subject company. Research analyst has not served as an officer, director or employee of the subject company.
