November 11, 2021
www.angelone.in
Technical & Derivatives Report
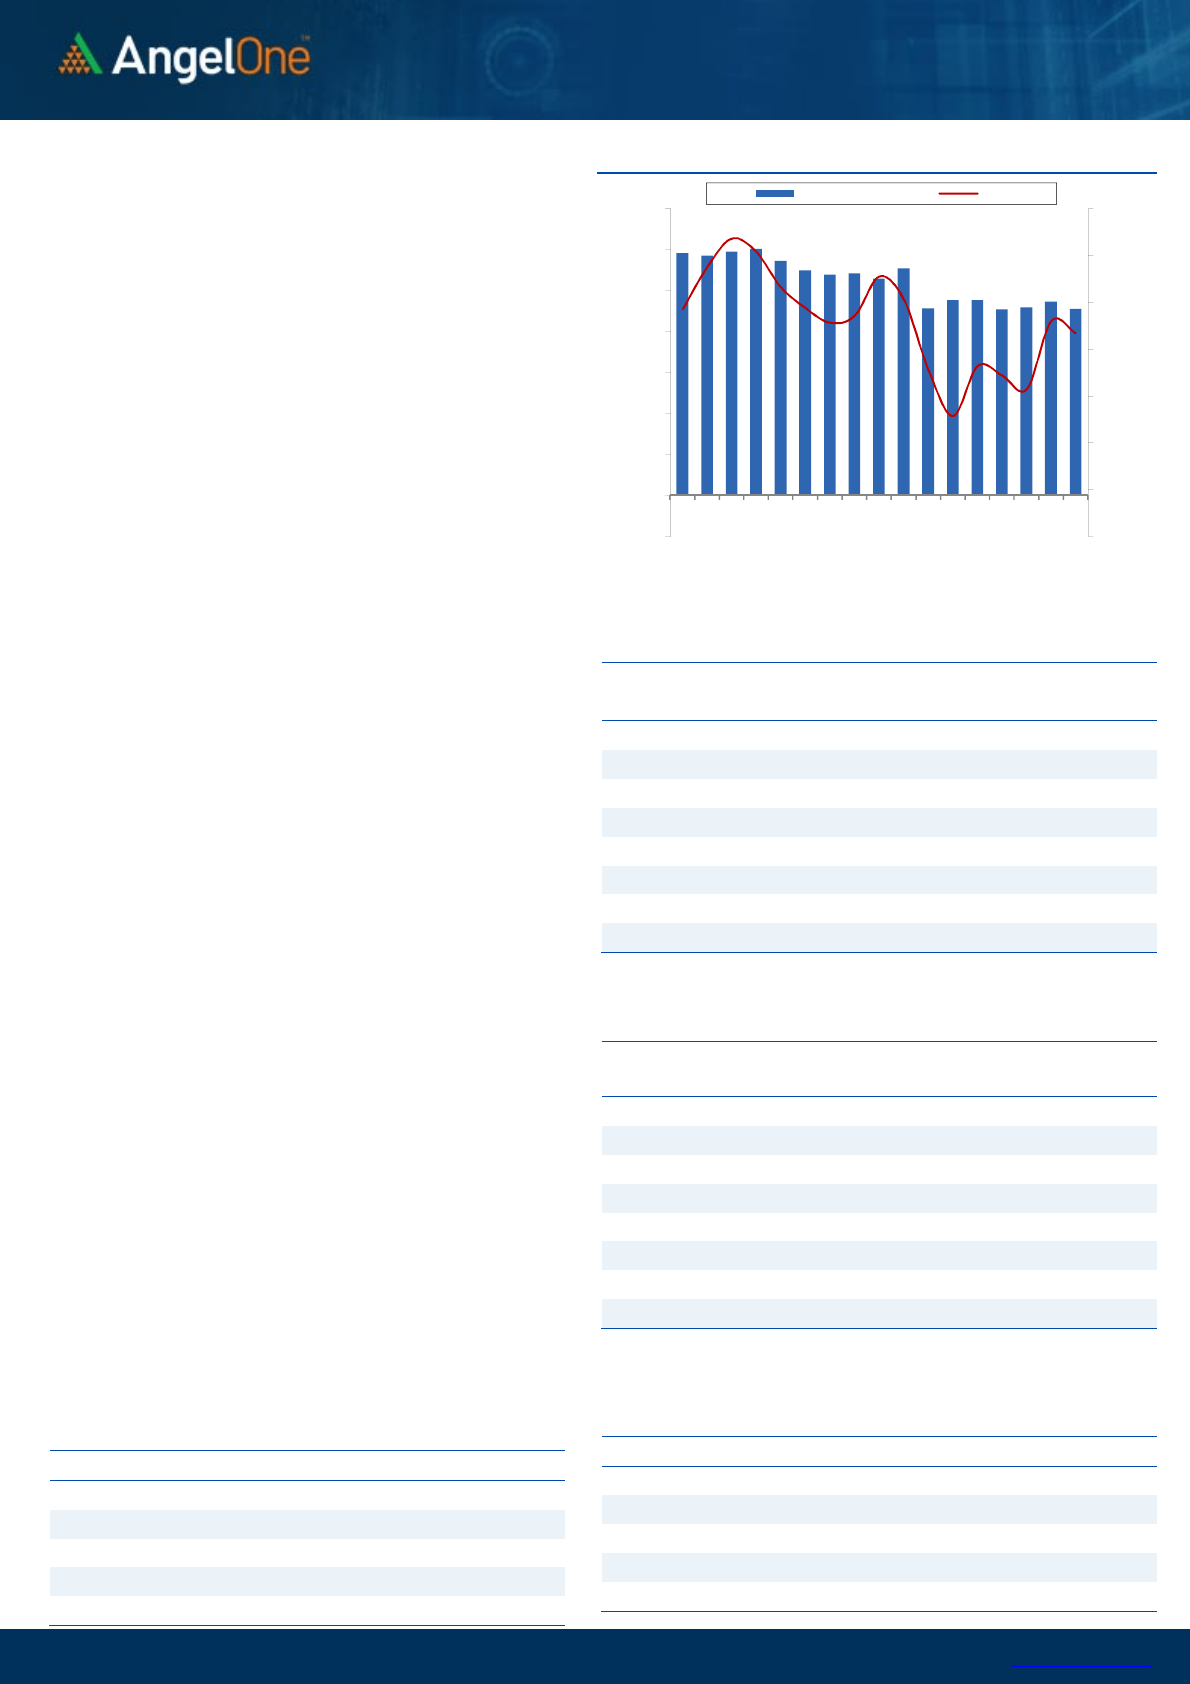
Nifty Bank Outlook - (39023)
BankNifty as well started with a gap down opening and slipped further
lower to mark an intraday low of 38874. Subsequently, we witnessed
a range bound session with intraday bounce got sold into. The bank
index eventually ended with cut of 0.88% tad above 39000.
If we closely watch the daily chart, the Bank Nifty has closed near the
Ascending Trend line support and if see this weakness persists then we
can see an extension of fall towards 38000 – 37500 levels in the near
term. Since it’s a very key support, we may see some bounce aswell
however the charts have been already distorted hence incase of any
bounce use it to lighten up long positions. Yesterday’s low at 38874
will be a key support whereas on the higher side resistance is seen
around 39200 – 39600 levels.
Key Levels
Support 1 – 38850 Resistance 1 – 39200
Support 2 – 38000 Resistance 2 – 39600
Exhibit 2: Nifty Bank Daily Chart
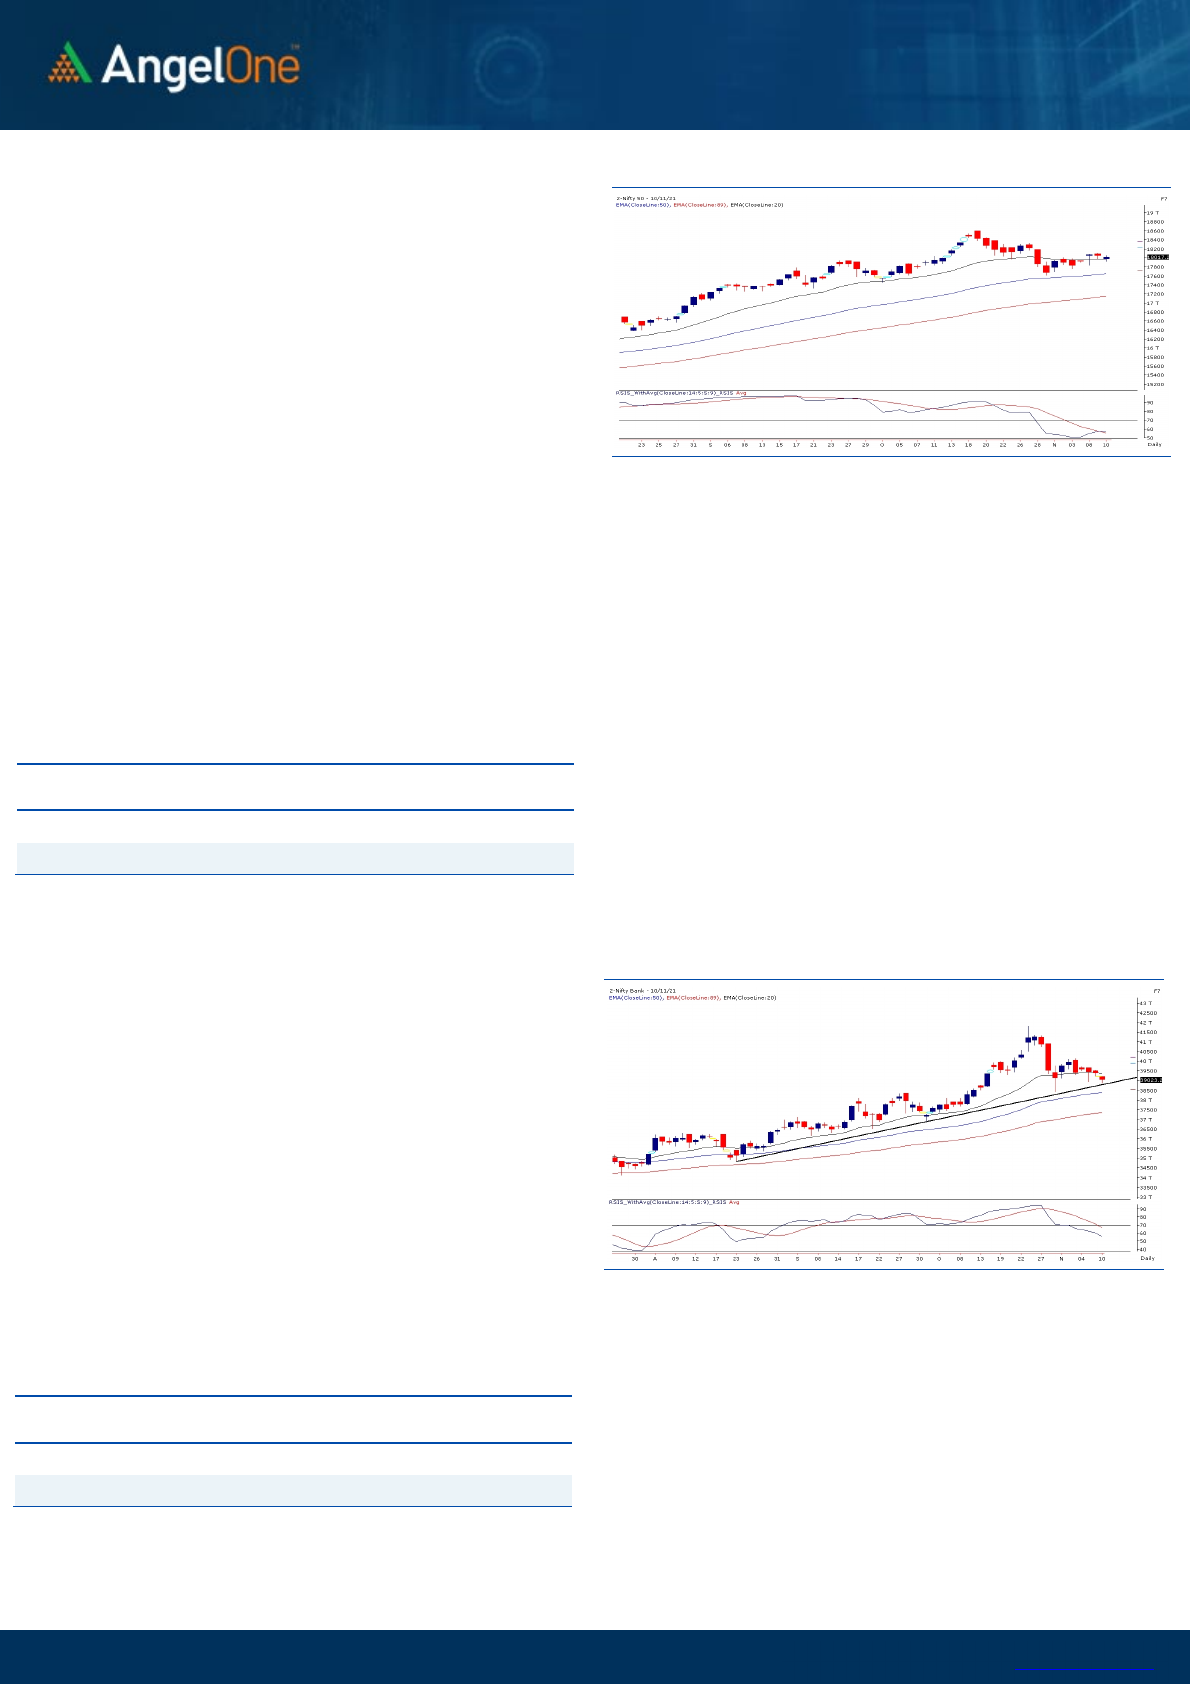
Sensex (60353) / Nifty (18017)
Market started yesterday’s session on a sluggish note, but still it was
certainly not as bad as the SGX Nifty was indicating . Nifty retested
17900 in the early morning trades which was then followed by some
consolidation. Post the mid-session, we witnessed a decent recovery in
some of the heavyweights which pulled the index beyond 18000 to
mark a flat close one day ahead of the weekly expiry.
Although we had a decent recovery post the nervous start, overall
there was no major action seen in the benchmark index. We once gain
had a neutral close around 18000 which keeps the chart structure
unchanged. Hence the view and the levels remained the same as
mentioned in the previous commentary. On an immediate basis 18100
– 18200 should be seen as crucial resistances; whereas with a broader
view, 18350 stands to be a crucial level which if gets surpassed, Nifty
could see new highs thereafter. But till then one should continue with
a ‘Sell on rise’ strategy. On the flipside, 17950 – 17850 are to be
considered as key supports. Traders are still advised to stay light and
even if one wants to focus on individual stocks, a proper money
management is must to follow.
Key Levels
Support 1 – 17950 Resistance 1 – 18100
Support 2 – 17850 Resistance 2 – 18200
Exhibit 1: Nifty Daily Chart
www.angelone.in
Technical & Derivatives Report
November 11, 2021
View
Market started Wednesday’s session on a sluggish note,
but still it was certainly not as bad as the SGX Nifty was
indicating .Nifty retested 17900 in the early morning
trades which was then followed by some consolidation.
Post the mid-session, we witnessed a decent recovery
in some of the heavyweights which pulled the index
beyond 18000 to mark a flat close one day ahead of the
weekly expiry.
FIIs were net sellers in the cash market segment to the
tune of Rs. 469 crores. In index futures, they sold worth
Rs. 512 crores with rise in open interest indicating short
formation.
In F&O space, we saw some open interest reduction in
Nifty and banking index added good amount of fresh
shorts. Stronger hands continued their selling streak in
equities and also preferred adding shorts in index and
stock futures segment. In Nifty options front, there was
massive writing seen in 18100 and 18200 call options in
last two trading sessions. On the other side, some
unwinding was clearly visible in 18100 and 18150 put
options; followed by some build-up in 17750-17800
strikes. Considering the price action, it seems market
has stuck in a tight range of 17900-18100 now and hence,
until we don’t see a directional move beyond this range,
traders should strictly avoid any directional bet in index
and should ideally prefer trading in individual themes.
Comments
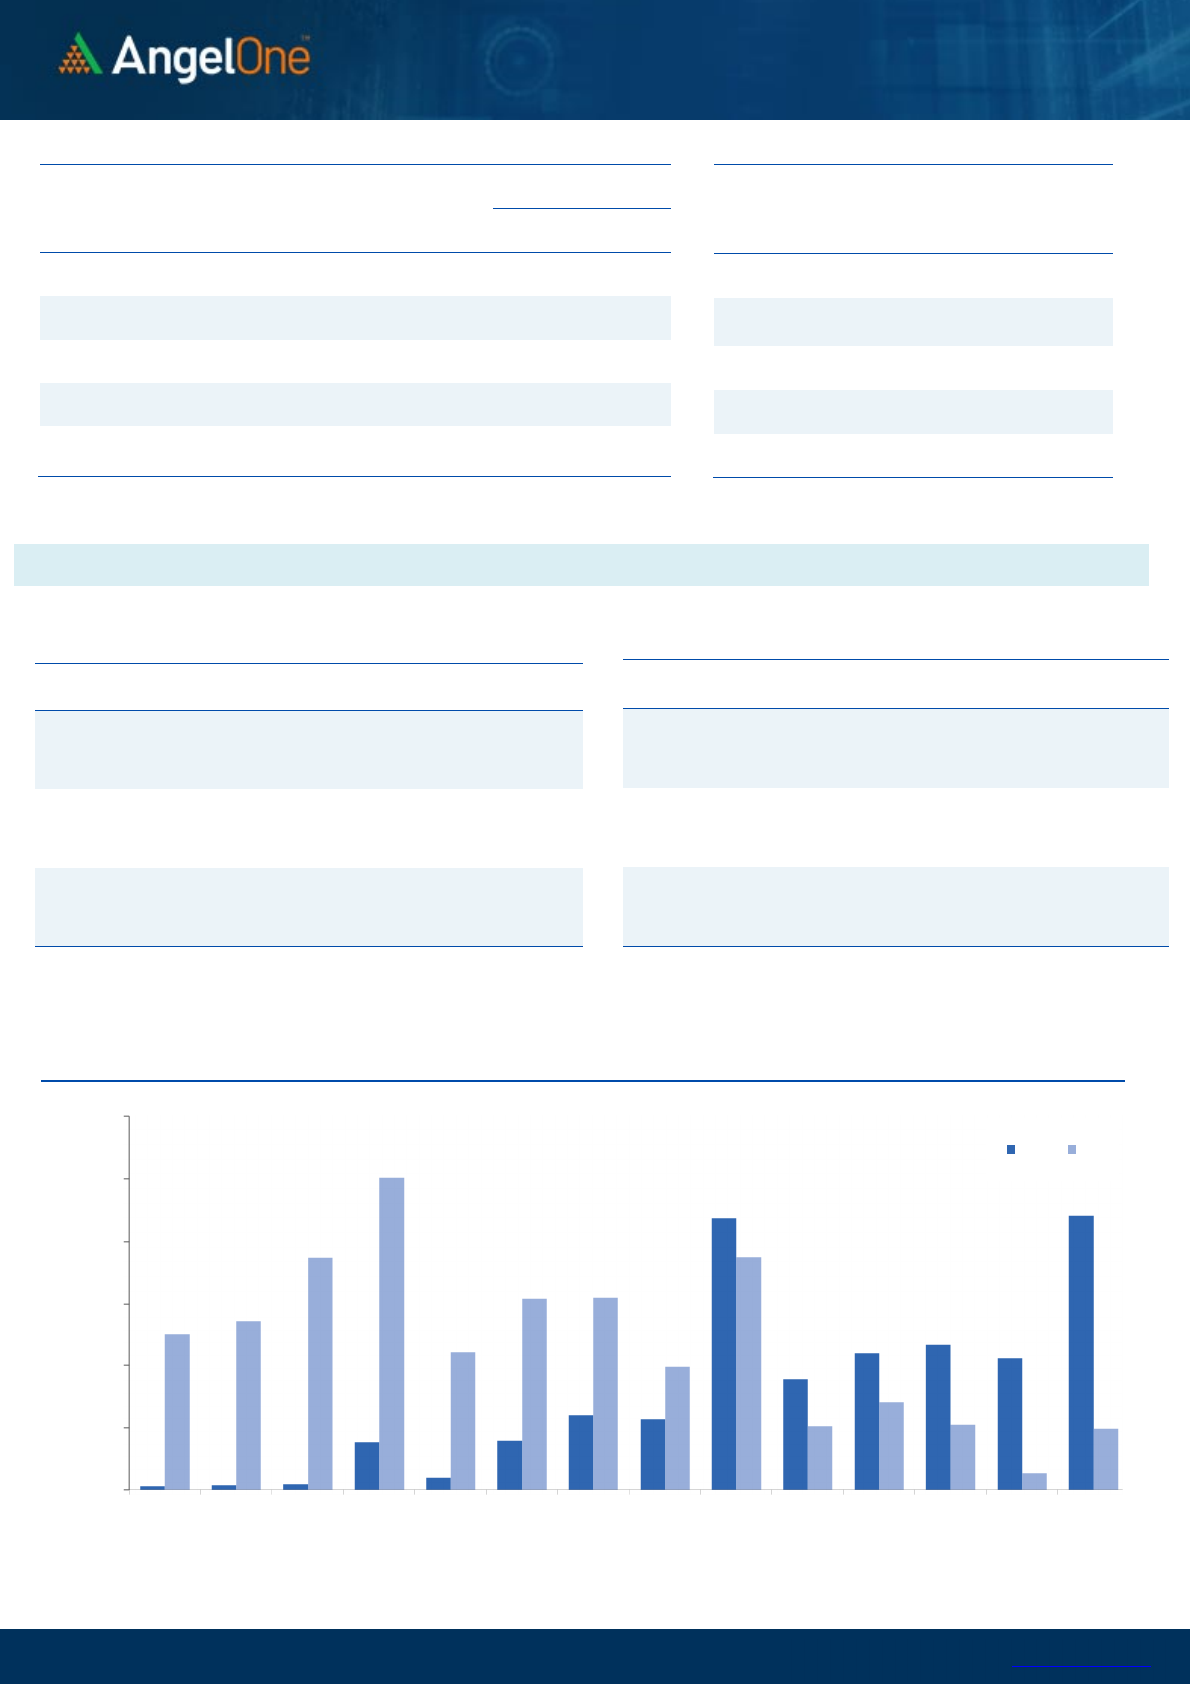
The Nifty futures open interest has decreased by 0.73%.
Bank Nifty futures open interest has increased by 9.58%
as market closed at 18017.20 levels.
The Nifty November future closed with a premium of 5.75
point against a premium of 26.15 point in last trading
session. The December series closed at a premium of
70.10 point.
The INDIA VIX increased from 16.00 to 16.30. At the same
time, the PCR-OI of Nifty has decreased from 1.12 to 0.94.
Few of the liquid counters where we have seen high cost
of carry are BRITANNIA, M&M, TVSMOTOR, RBLBANK
and IBULHSGFIN.
Nifty Vs OI
17200
17400
17600
17800
18000
18200
18400
18600
,0
2,000
4,000
6,000
8,000
10,000
12,000
14,000
16,000
10-13 10-18 10-20 10-22 10-26 10-28 11-1 11-3 11-5
(`000)
Openinterest Nifty
OI Gainers
SCRIP OI
OI
CHG. (%)
PRICE
PRICE
CHG. (%)
BRITANNIA
1410400 30.38 3698.45 2.16
IBULHSGFIN
42209600 28.62 245.35 0.49
HINDALCO
27484525 18.52 449.75 -3.26
STAR
3733425 17.35 503.75 -9.16
PFC
45979200 16.35 140.25 0.68
HDFCBANK
36860450 16.01 1555.25 -1.15
BHEL
146181000 14.19 66.25 -8.35
BERGEPAINT
5562700 13.74 774.95 -0.26
OI Losers
SCRIP OI
OI
CHG. (%)
PRICE
PRICE
CHG. (%)
AMBUJACEM
12160500 -12.68 428.35 -0.78
ABFRL
10202400 -12.39 301.90 -1.42
ADANIENT
23837000 -8.54 1655.80 1.23
EICHERMOT
3844750 -7.86 2746.75 0.39
VOLTAS
2155000 -7.71 1247.60 -0.54
GUJGASLTD
3525000 -7.48 659.45 1.72
MFSL
2113800 -7.43 993.05 -0.89
ULTRACEMCO
1687400 -7.30 8106.80 -0.44
Put-Call Ratio
SCRIP PCR-OI PCR-VOL
NIFTY
0.94 0.78
BANKNIFTY
0.60 0.86
RELIANCE
0.46 0.38
ICICIBANK
0.44 0.35
INFY
0.47 0.40
Historical Volatility
SCRIP HV
STAR
55.80
BHEL
66.57
M&M
41.23
ABFRL
50.46
BRITANNIA
29.89
www.angelone.in
Technical & Derivatives Report
November 11, 2021
Note: Above mentioned Bullish or Bearish Spreads in Nifty (November Series) are given as an information and not as a recommendation.
Nifty
Spot = 18017.20
FII Statistics for November 10, 2021
Detail Buy
Net Contracts
Open Interest
Sell
Value
(in Cr.)
Change
INDEX
FUTURES
2604.75 3116.85 (512.10) 150075 13855.55 2.07
INDEX
OPTIONS
480467.72 480709.53 (241.81) 1498085 138040.31 7.87
297314.41
STOCK
FUTURES
14257.38 15478.64 (1221.26) 1773706 133504.22 1.12
STOCK
OPTIONS
15308.19 15412.74 (104.55) 309398 24081.00 6.50
Total
512638.04
514717.76
(2079.72) 3731264
309481.08
4.22
43446.77
Turnover on November 10, 2021
Instrument
No. of
Contracts
Turnover
( in Cr. )
Change
(%)
Index Futures
257091 24072.82 5.63
Index Options
59350902 5625530.70 24.40
Stock Futures
850854 66216.11 -6.42
Stock Options
2656165 215231.12 -4.38
Total
6,31,15,012
5931050.75 22.52
Bull-Call Spreads
Action Strike Price Risk Reward BEP
Buy
18000 226.65
49.85 50.15 18049.85
Sell
18100 176.80
Buy
18000 226.65
91.10 108.90 18091.10
Sell
18200 135.55
Buy
18100 176.80
41.25 58.75 18141.25
Sell
18200 135.55
Bear-Put Spreads
Action Strike Price Risk Reward BEP
Buy
18000 200.00
41.95 58.05 17958.05
Sell
17900 158.05
Buy
18000 200.00
77.40 122.60 17922.60
Sell
17800 122.60
Buy
17900 158.05
35.45 64.55 17864.55
Sell
17800 122.60
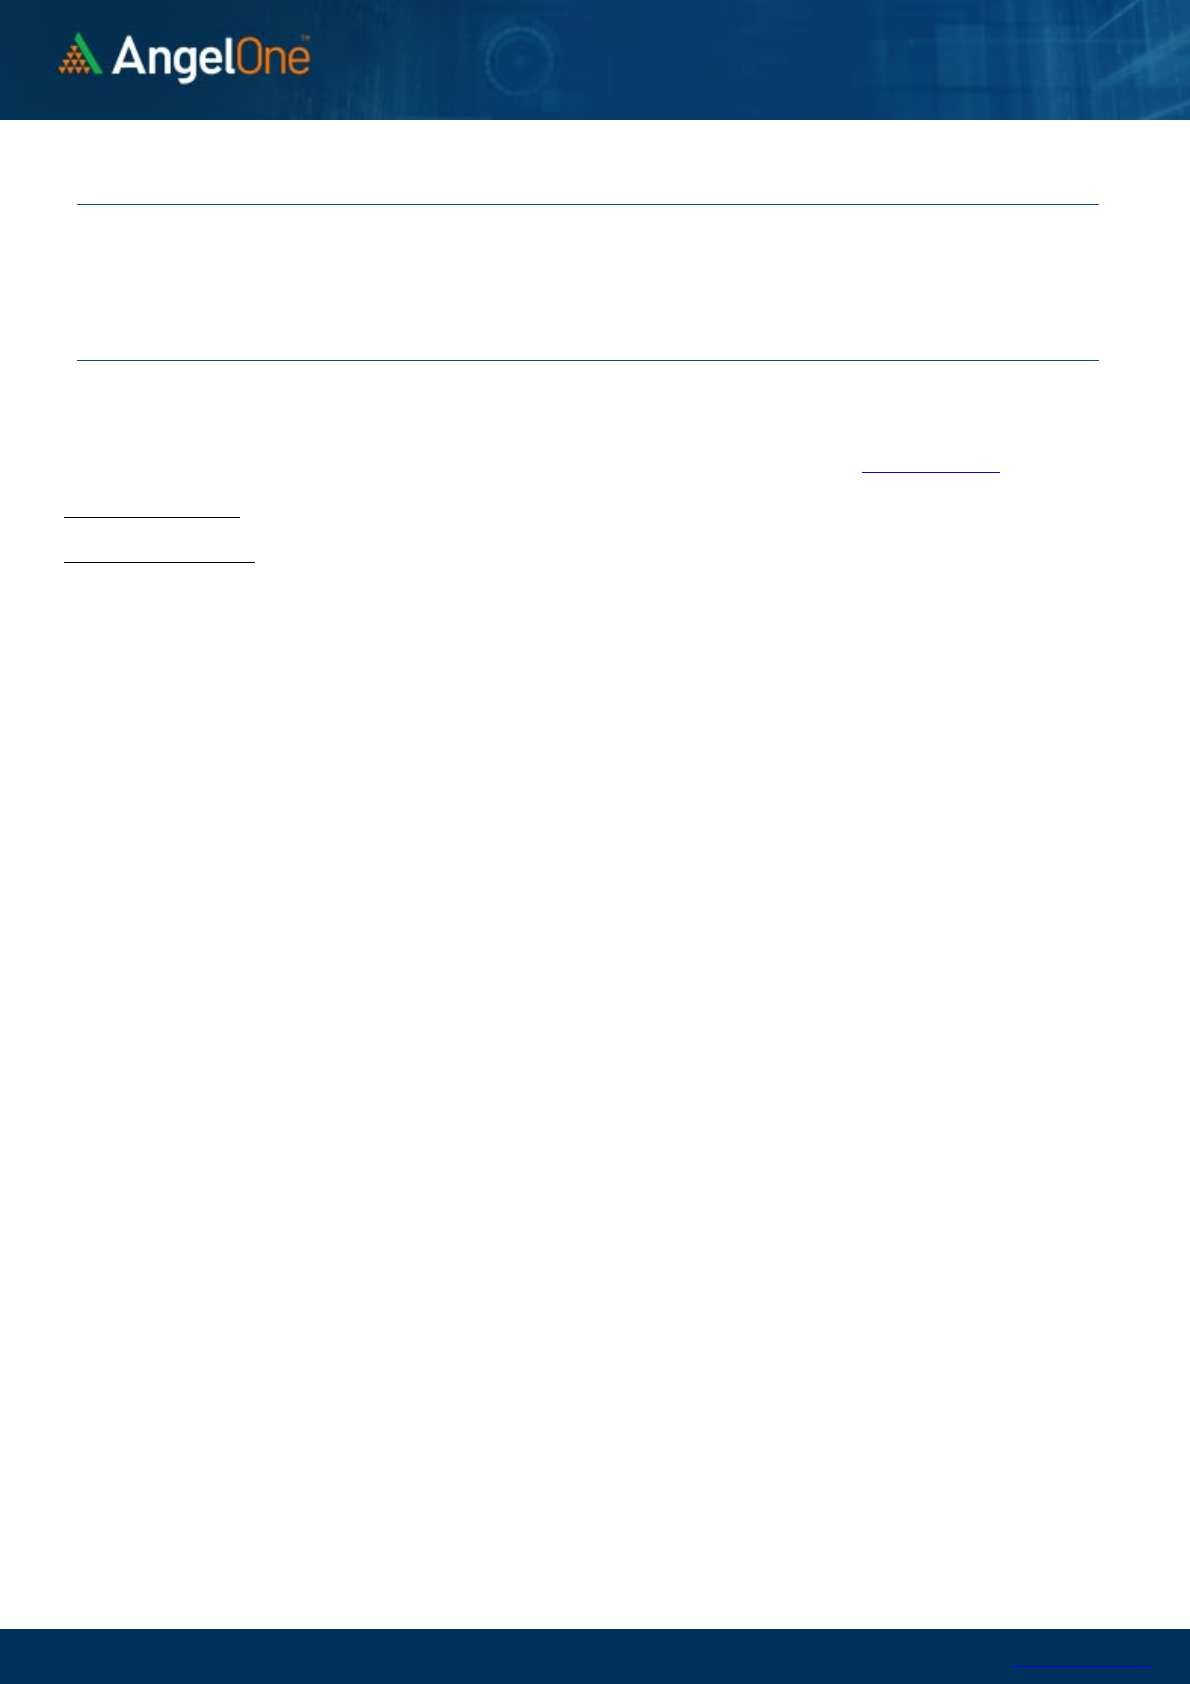
Nifty Put-Call Analysis
,0
500,000
1000,000
1500,000
2000,000
2500,000
3000,000
17200 17300 17400 17500 17600 17700 17800 17900 18000 18100 18200 18300 18400 18500
Call Put

www.angelone.in
Technical & Derivatives Report
November 11, 2021
`
Daily Pivot Levels for Nifty Constituents
Scrips S2 S1 PIVOT R1 R2
ADANIPORTS 723 730
738 745 753
ASIANPAINT 3,052 3,080
3,108 3,136 3,165
AXISBANK 724 736
745 758 766
BAJAJ-AUTO 3,715 3,743
3,772 3,801 3,830
BAJFINANCE 7,460 7,521
7,565 7,626 7,670
BAJAJFINSV 17,862 18,094
18,235 18,467 18,607
BPCL 428 430
432 433 436
BHARTIARTL 696 716
727 747 758
BRITANNIA 3,553 3,626
3,673 3,746 3,793
CIPLA 901 907
916 921 930
COALINDIA 164 165
168 170 172
DIVISLAB 4,825 4,866
4,906 4,946 4,987
DRREDDY 4,742 4,786
4,818 4,862 4,894
EICHERMOT 2,685 2,716
2,741 2,772 2,796
GRASIM 1,828 1,851
1,865 1,889 1,903
HCLTECH 1,156 1,163
1,169 1,175 1,182
HDFCBANK 1,539 1,547
1,558 1,566 1,577
HDFCLIFE 698 702
705 709 712
HDFC 2,863 2,904
2,928 2,969 2,993
HEROMOTOCO 2,687 2,703
2,718 2,733 2,748
HINDALCO 439 444
454 460 470
HINDUNILVR 2,381 2,391
2,405 2,415 2,429
ICICIBANK 768 775
779 786 791
IOC 137 138
140 141 142
INDUSINDBK 1,003 1,018
1,042 1,057 1,081
INFY 1,709 1,724
1,738 1,753 1,767
ITC 225 228
230 233 236
JSW STEEL 640 651
664 675 687
KOTAKBANK 2,049 2,062
2,077 2,091 2,105
LT 1,923 1,937
1,945 1,959 1,967
M&M 883 901
913 931 943
MARUTI 7,397 7,454
7,517 7,574 7,637
NESTLEIND 18,689 18,821
18,932 19,064 19,174
NTPC 136 137
137 138 139
ONGC 155 157
158 159 160
POWERGRID 182 183
185 186 188
RELIANCE 2,483 2,516
2,537 2,571 2,592
SBILIFE 1,166 1,175
1,190 1,199 1,214
SHREECEM 28,786 29,071
29,250 29,535 29,714
SBIN 518 521
525 528 532
SUNPHARMA 790 800
808 818 826
TCS 3,455 3,470
3,495 3,509 3,534
TATACONSUM
824 833
840 849 855
TATAMOTORS 493 502
509 518 525
TATASTEEL 1,263 1,281
1,305 1,323 1,347
TECHM 1,535 1,551
1,562 1,578 1,589
TITAN 2,440 2,462
2,495 2,517 2,549
ULTRACEMCO 7,977 8,042
8,115 8,180 8,253
UPL 729 750
762 783 795
WIPRO 647 650
654 657 662
www.angelone.in
Technical & Derivatives Report
November 11, 2021
*
Research Team Tel: 022 – 39357600 (Extn. 6844) Website: www.angelone.in
For Technical Queries E-mail: technicalresearch-cso@angelbroking.com
For Derivatives Queries E-mail: derivatives.desk@angelbroking.com
DISCLAIMER
Angel Broking Limited (hereinafter referred to as “Angel”) is a registered Member of National Stock Exchange of India Limited,
Bombay Stock Exchange Limited and Metropolitan Stock Exchange Limited. It is also registered as a Depository Participant with
CDSL and Portfolio Manager and Investment Adviser with SEBI. It also has registration with AMFI as a Mutual Fund Distributor. Angel
Broking Limited is a registered entity with SEBI for Research Analyst in terms of SEBI (Research Analyst) Regulations, 2014 vide
registration number INH000000164. Angel or its associates has not been debarred/ suspended by SEBI or any other regulatory
authority for accessing /dealing in securities Market. Angel or its associates/analyst has not received any compensation / managed
or co-managed public offering of securities of the company covered by Analyst during the past twelve months.
This document is solely for the personal information of the recipient, and must not be singularly used as the basis of any investment
decision. Nothing in this document should be construed as investment or financial advice. Each recipient of this document should
make such investigations as they deem necessary to arrive at an independent evaluation of an investment in the securities of the
companies referred to in this document (including the merits and risks involved), and should consult their own advisors to determine
the merits and risks of such an investment.
Reports based on technical and derivative analysis center on studying charts of a stock's price movement, outstanding positions and
trading volume, as opposed to focusing on a company's fundamentals and, as such, may not match with a report on a company's
fundamentals. Investors are advised to refer the Fundamental and Technical Research Reports available on our website to evaluate
the contrary view, if any.
The information in this document has been printed on the basis of publicly available information, internal data and other reliable
sources believed to be true, but we do not represent that it is accurate or complete and it should not be relied on as such, as this
document is for general guidance only. Angel Broking Limited or any of its affiliates/ group companies shall not be in any way
responsible for any loss or damage that may arise to any person from any inadvertent error in the information contained in this
report. Angel Broking Limited has not independently verified all the information contained within this document. Accordingly, we
cannot testify, nor make any representation or warranty, express or implied, to the accuracy, contents or data contained within this
document. While Angel Broking Limited endeavors to update on a reasonable basis the information discussed in this material, there
may be regulatory, compliance, or other reasons that prevent us from doing so.
This document is being supplied to you solely for your information, and its contents, information or data may not be reproduced,
redistributed or passed on, directly or indirectly.
Neither Angel Broking Limited, nor its directors, employees or affiliates shall be liable for any loss or damage that may arise from
or in connection with the use of this information.
Technical and Derivatives Team:
Sameet Chavan Chief Analyst – Technical & Derivatives sameet.chavan@angelone.in
Rajesh Bhosale Technical Analyst rajesh.bhosle@angelone.in
Sneha Seth Derivatives Analyst sneha.seth@angelone.in
