Aug 11, 2022
www.angelone.in
Technical & Derivatives Report
OOOOOOOO
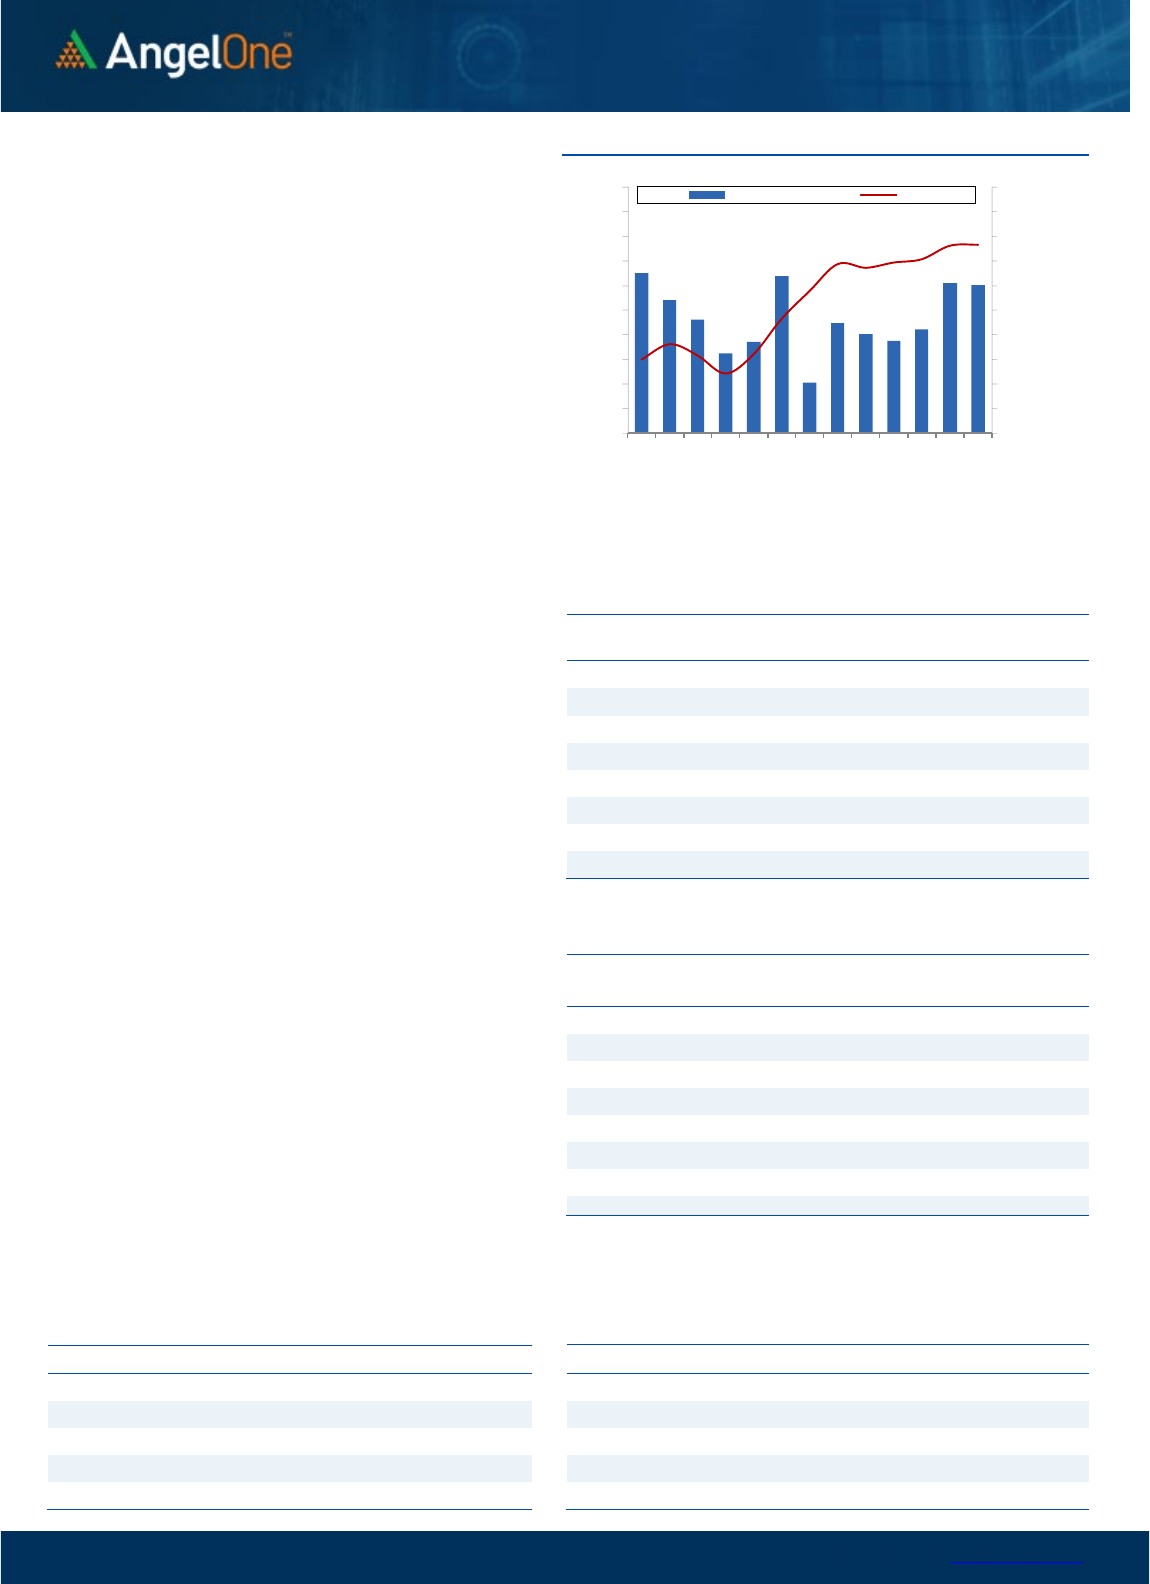
Nifty Bank Outlook (38288)
Post a mid-week holiday, Bank Nifty started on a flat note and
throughout the session, there was a lack of momentum as the Index
remained within a tight range and ended flat a tad below the opening
levels.
In our previous outlook, we had mentioned Bank Index approaching
the supply zone of April's month swing high. The undertone remains
positive however since the oscillators are highly overbought, we are
witnessing some signs of fatigue around this crucial hurdle. On the
daily chart, we witnessed a classical Doji pattern yesterday indicating
a lack of traction and going ahead we expect some further
consolidation in the near term with 38500 - 38760 as resistance
whereas 38000 - 37880 as immediate support. Yesterday
trading opportunities were seen on both sides of the trend and traders
should continue to focus on such outperforming opportunities.
Key Levels
Support 1 – 38000 Resistance 1 – 38500
Support 2 – 37880 Resistance 2 – 38760
Exhibit 1: Nifty Daily Chart
Exhibit 2: Nifty Bank
Daily
Chart
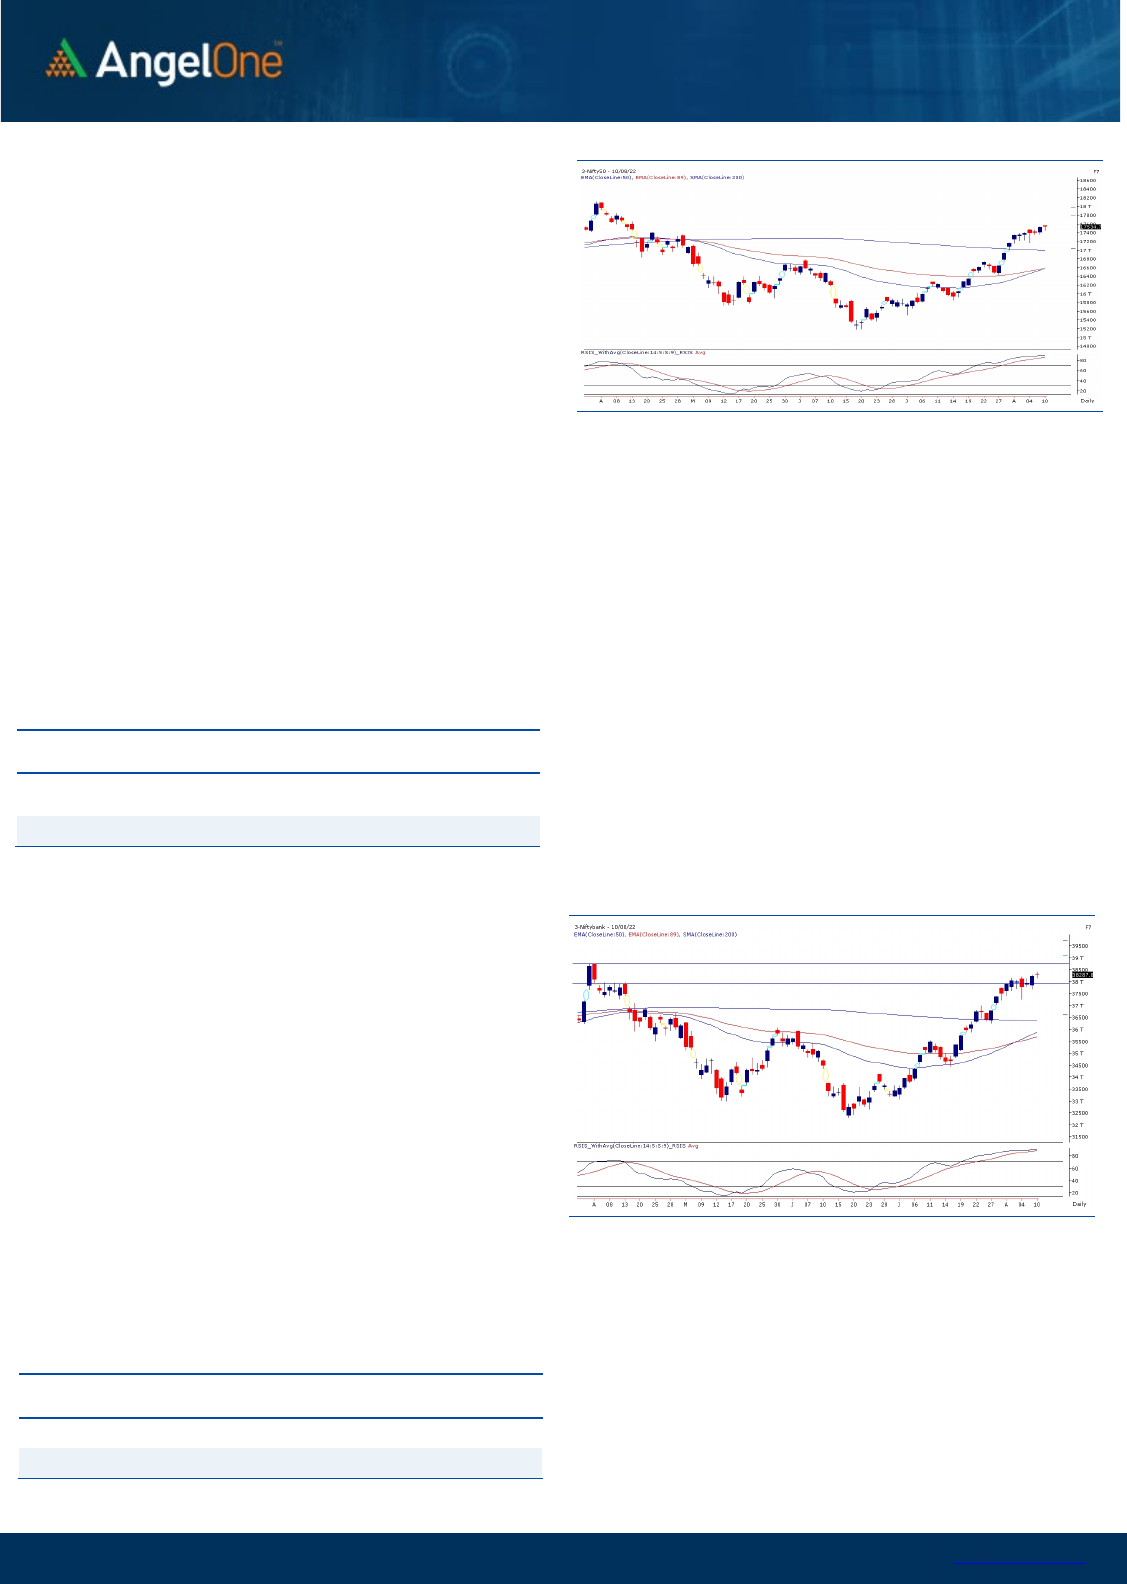
Sensex (58817) / Nifty (17535)
Despite quiet global cues yesterday morning, our markets started the
session slightly on the positive side. However, within a blink of an eye,
this tiny lead just got disappeared. After a small pause, the buying
emerged at lower levels after entering the sub-17450 terrain. The
momentum wasn’t as strong as it was on Monday’s session. As a result,
the Nifty kept consolidating throughout the remaining part of the
session and eventually ended the session tad above previous close.
Except initial down tick, it was a day of some consolidation for key
indices. For most of the session, it kept on flirting around the
equilibrium point and eventually managed to close with negligible
gains. It seems that after one day rally, key indices have again slipped
into a consolidation mode. So as far as levels are concerned, 17400 –
17350 is likely to cushion any kind of intraday decline in the market;
whereas on the flipside, 17600 remains an immediate hurdle. Till the
time we do not surpass this range, the consolidation is likely to
continue. But there was complete abundance when it comes to the
stock specific action yesterday. Hence, traders can continue with their
stock centric approach for a while and try to follow strict stop losses for
existing positions.
Key Levels
Support 1 – 17400 Resistance 1 – 17600
Support 2 – 17350 Resistance 2 – 17650
www.angelone.in
Technical & Derivatives Report
Aug 11, 2022
View
Ahead of weekly expiry, we have seen a slender
range-bound movement in the index. The
benchmark index settled on a muted note with a
mere gain of 0.06 percent to maintain its positive
stature and concluded at 17535.
FIIs were net buyers in the cash market segment to
the tune of Rs. 1062 crores. Simultaneously, in Index
futures, they sold worth Rs. 877 crores with a
decrease in open interest, indicating long unwinding.
Looking at the overall F&O data, we have witnessed
mixed trade in both indices ahead of the weekly expiry.
On the options front, the major concentration of OI is
seen at 17400-17500 put strikes, which is likely to
cushion any correction. On the contrary, 17600 call
strike has seen piling up of OI concentration followed
by 17800 CE, which is likely to act as immediate
resistance for the index. The Long Short ratio has also
reduced to 52% from 55%. Hence, considering the
recent developments, some tentativeness could be
sensed at the higher end, though the undertone
remains in favor of the bulls. Meanwhile, it is advisable
to keep a close tab on the mentioned levels and stay
abreast with global markets.
Comments
The Nifty futures open interest has decreased by
0.31%. and Bank Nifty futures open interest has
increased by 2.19% as the market closed at 17534.75.
The Nifty Aug future closed with a premium of 23.5
point against a premium of 32.65 point in the last
trading session. The Sep series closed at a premium
of 91.90 point.
The INDIA VIX increased from 19.30 to 19.58. At the
same time, the PCR-OI of Nifty has decreased from
1.30 to 1.23.
Few of the liquid counters where we have seen high
cost of carry are TATACHEM, CUB, MRF, IGL and
ABBOTINDIA.
Historical Volatility
SCRIP HV
IDEA 84.99
IBULHSGFIN 76.00
RBLBANK 72.35
HINDCOPPER 65.94
ZEEL 65.77
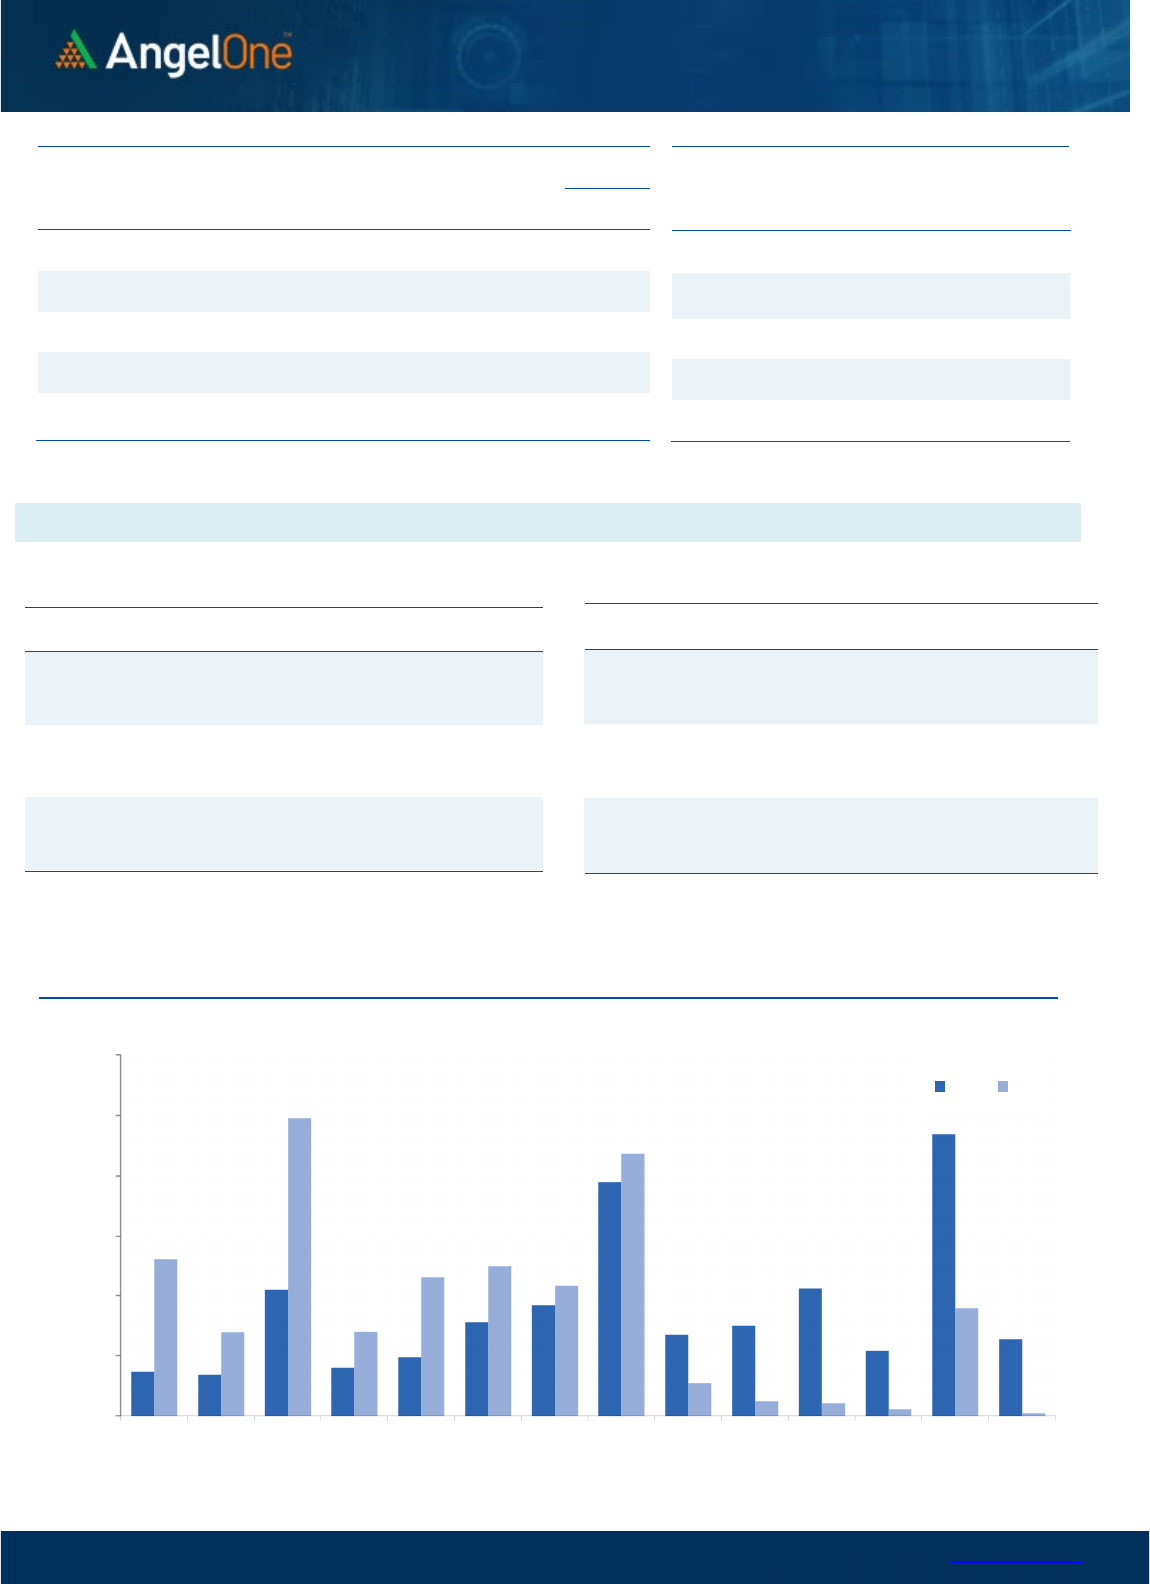
Nifty Vs OI
16000
16200
16400
16600
16800
17000
17200
17400
17600
17800
18000
10,000
10,500
11,000
11,500
12,000
12,500
13,000
13,500
14,000
14,500
15,000
7/21 7/25 7/27 8/29 8/2 8/5 8/10
Openinterest Nifty
OI Gainers
SCRIP OI
OI
CHG. (%)
PRICE
PRICE
CHG. (%)
TATACHEM 7590000 39.16 1074.15 12.17
CUB 6635000 23.56 176.70 8.80
MRF 85400 17.34 83466.80 -5.24
AARTIIND 3995850 16.13 819.75 2.16
HINDALCO 29552825 13.13 440.10 4.50
COROMANDEL 1387400 12.61 1076.25 2.44
ICICIPRULI 9375000 11.41 557.15 -2.57
ABB 936750 10.89 2770.55 1.76
OI Losers
SCRIP OI
OI
CHG. (%)
PRICE
PRICE
CHG. (%)
WHIRLPOOL 437150 -11.92 1794.90 -0.02
BALRAMCHIN 9040000 -10.33 330.95 -6.19
ASTRAL 618475 -8.80 1943.15 -2.00
GUJGASLTD 4991250 -8.29 454.75 2.22
PERSISTENT 529050 -7.74 3643.40 -3.40
ESCORTS 2588300 -6.46 1689.90 2.52
IDFCFIRSTB 219690000 -6.04 44.80 0.22
BHARTIARTL 48383500 -5.78 715.25 1.46
Put-Call Ratio
SCRIP PCR (OI) PCR (VOL)
NIFTY 1.23 0.96
BANKNIFTY 1.09 0.93
RELIANCE 0.52 0.52
ICICIBANK 1.08 0.57
INFY 0.70 0.75
www.angelone.in
Technical & Derivatives Report
Aug 11, 2022
Note: Above mentioned Bullish or Bearish Spreads in Nifty (Aug Series) are given as an information and not as a recommendation.
Nifty Spot =
17,
5
34
.
75
FII Statistics for
August
10
, 2022
Detail Buy
Contracts
Open
Interest
Value
(in Cr.)
Sell
Net
CHANGE
INDEX
FUTURES
1951.76 2828.49 (876.73) 148732 13507.61 (4.99)
INDEX
OPTIONS
825889.24 825098.32 790.92
1284792 115746.19 0.95
STOCK
FUTURES
10395.31 10856.08 (460.77) 2144035 147417.54 (0.06)
STOCK
OPTIONS
7566.93 7467.06 99.87
132118 9331.35 8.49
Total 845803.24
846249.95
(446.71) 3709677
286002.69
0.36
Turnover on
August
10
, 2022
Instrument
No. of
Contracts
Turnover
( in Cr. )
Change
(%)
Index Futures
281991 25666.54 -13.78
Index Options
116111420
10668407.62 25.07
Stock Futures
802655 56403.90 7.18
Stock Options
3205401 237860.64 5.80
Total
32,05,401 237860.64 24.34
Bull-Call Spreads
Action Strike Price Risk Reward BEP
Buy
17500 272.00
54.70
45.30
17554.70
Sell
17600 217.30
Buy
17500 272.00
103.45
96.55
17603.45
Sell
17700 168.55
Buy
17600 217.30
48.75 51.25 17648.75
Sell
17700 168.55
Bear
-
Put Spreads
Action Strike Price Risk Reward BEP
Buy 17500 215.25
38.35
61.65
17461.65
Sell
17400 176.90
Buy 17500 215.25
70.80
129.20
17429.20
Sell 17300 144.45
Buy
17400 176.90
32.45 67.55 17367.55
Sell
17300 144.45
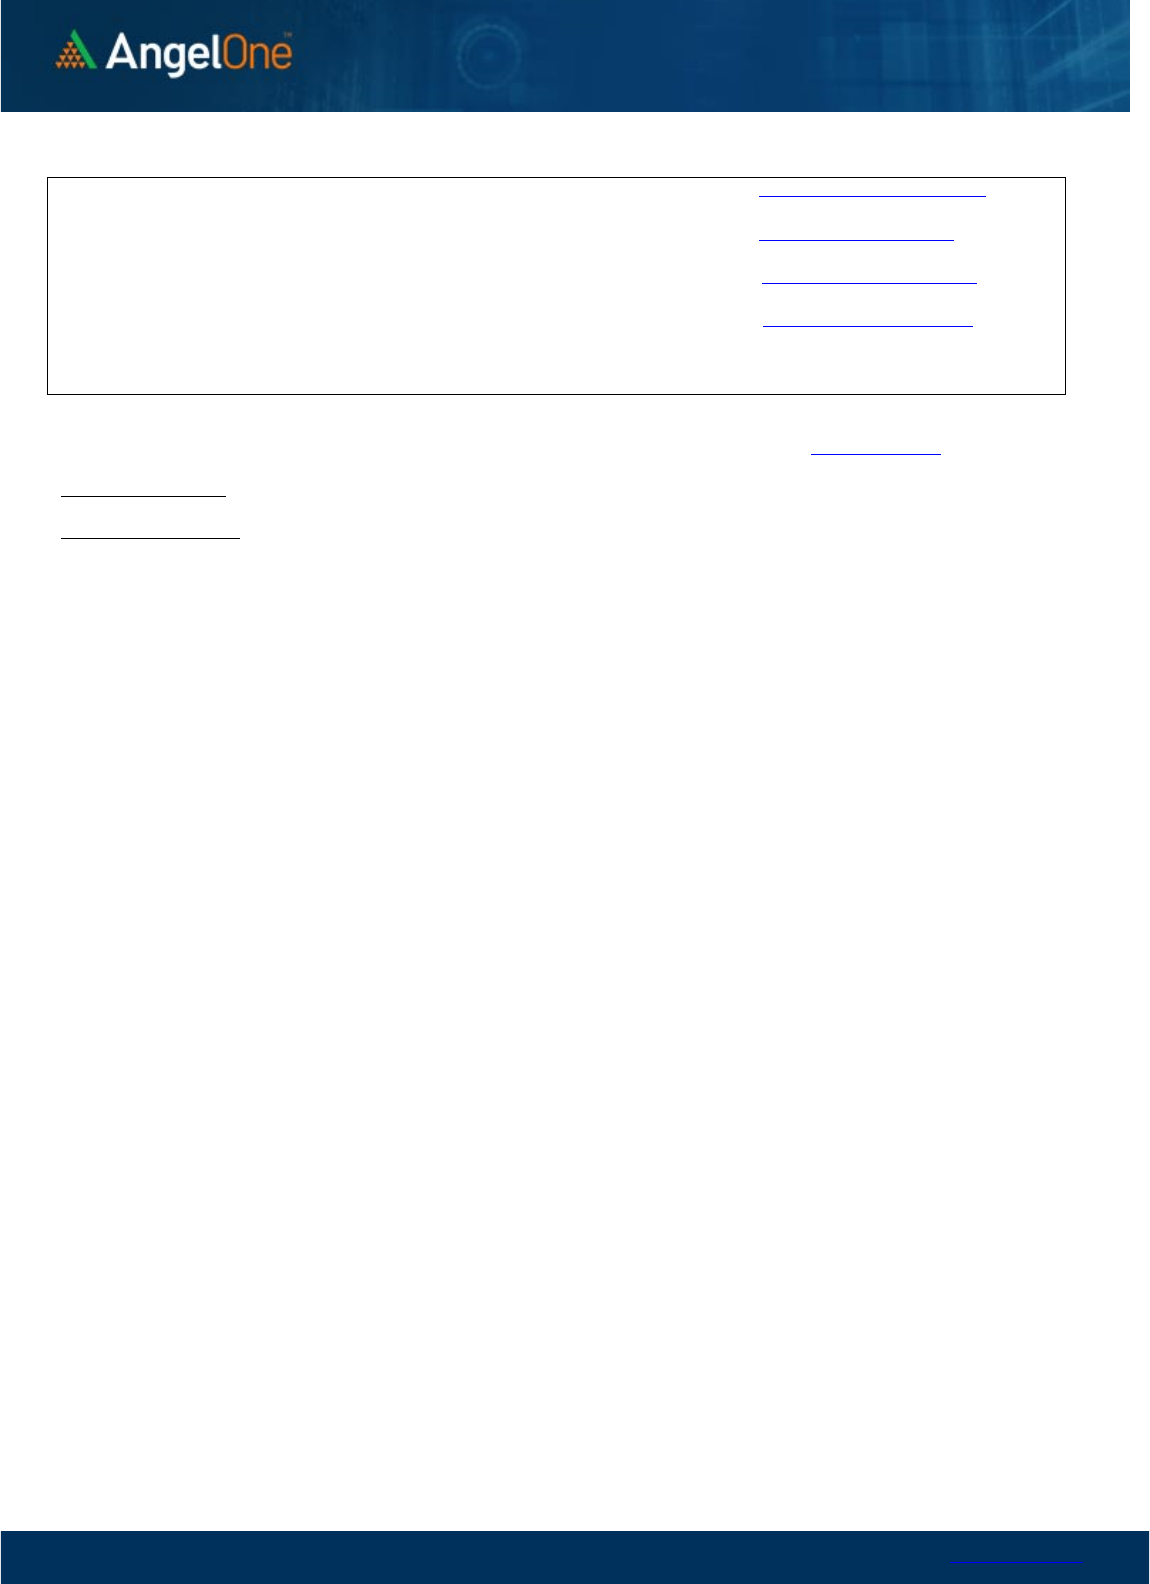
Nifty Put
-
Call Analysis
,0
500,000
1000,000
1500,000
2000,000
2500,000
3000,000
16800 16900 17000 17100 17200 17300 17400 17500 17600 17700 17800 17900 18000 18100
Call Put

www.angelone.in
Technical & Derivatives Report
Aug 11, 2022
`
Daily Pivot Levels for Nifty Constituents
Scrips
S2
S1
PIVOT
R1 R2
ADANIPORTS 763 777
792
806
822
APOLLOHOSP 4,285 4,401
4,513
4,630 4,742
ASIANPAINT 3,365 3,388
3,419
3,442 3,473
AXISBANK 729 734
741 746
753
BAJAJ-AUTO 3,986 4,011
4,038
4,063
4,090
BAJFINANCE 6,944 7,047
7,208 7,311
7,472
BAJAJFINSV
15,333
15,488
15,581
15,736
15,829
BPCL
324
326
328
330
332
BHARTIARTL
701
708
713
720
725
BRITANNIA 3,598 3,623
3,649 3,674 3,700
CIPLA 1,021 1,030
1,038
1,047
1,055
COALINDIA 214 217
219
222
224
DIVISLAB 3,882 3,915
3,945 3,978
4,007
DRREDDY 4,191 4,217
4,241
4,267
4,290
EICHERMOT 3,095 3,125
3,147
3,177
3,199
GRASIM
1,575
1,593
1,605
1,623
1,634
HCLTECH 937 944
956
963
975
HDFCBANK
1,440
1,453
1,462
1,476
1,485
HDFCLIFE
534
537
541 544
548
HDFC
2,356
2,377
2,392
2,413
2,428
HEROMOTOCO
2,712
2,744
2,764
2,796
2,817
HINDALCO
406
423
434
451
462
HINDUNILVR 2,605 2,624
2,650
2,669
2,696
ICICIBANK
837
843
848
854
859
INDUSINDBK
1,033
1,048
1,058
1,073
1,082
INFY 1,571 1,587
1,604
1,620
1,637
ITC
309
310
312
313
315
JSW STEEL
654
662
668
677
683
KOTAKBANK
1,805
1,817
1,833
1,845
1,861
LT
1,803
1,829
1,848
1,874
1,893
M&M
1,250
1,259
1,269
1,278
1,289
MARUTI 8,728 8,804
8,902
8,977
9,075
NESTLEIND 19,163 19,466
19,808
20,111
20,453
NTPC 154 155
156
157
158
ONGC
131
133
135
136
138
POWERGRID
219
221
223
225
227
RELIANCE 2,544 2,563
2,576
2,596
2,609
SBILIFE
1,254
1,263
1,279
1,289
1,304
SHREECEM 20,542 20,823
21,137
21,418
21,732
SBIN
507
511
517
521
527
SUNPHARMA
906
913
920
927
934
TCS 3,308 3,331
3,358 3,381
3,408
TATACONSUM
783
787
790
794
798
TATAMOTORS
458
467
472
481
486
TATASTEEL 105 107
109
111
112
TECHM
1,036
1,046
1,052
1,062
1,069
TITAN 2,387 2,411
2,440
2,463 2,493
ULTRACEMCO 6,478 6,537
6,639
6,698
6,801
UPL
746
756
762
771
777
WIPRO 421 426
431 435
441
www.angelone.in
Technical & Derivatives Report
Aug 11, 2022
*
Technical and Derivatives Team:
Sameet Chavan Chief Analyst – Technical & Derivatives sameet.chavan@angelone.in
Sneha Seth Senior Analyst – Technical & Derivatives sneha.seth@angelone.in
Rajesh Bhosale Technical Analyst rajesh.bhosle@angelone.in
Osho Krishan Senior Analyst – Technical & Derivatives osho.krishan@angelone.in
Research Team Tel: 022 – 39357600 (Extn. 6844) Website: www.angelone.in
For Technical Queries E-mail: technicalresearch-cso@angelone.in
For Derivatives Queries E-mail: derivatives.desk@angelone.in
DISCLAIMER
Angel One Limited (hereinafter referred to as “Angel”) is a registered Member of National Stock Exchange of India Limited, Bombay
Stock Exchange Limited and Metropolitan Stock Exchange Limited. It is also registered as a Depository Participant with CDSL and
Portfolio Manager and investment advisor with SEBI. It also has registration with AMFI as a Mutual Fund Distributor. Angel One
Limited is a registered entity with SEBI for Research Analyst in terms of SEBI (Research Analyst) Regulations, 2014 vide registration
number INH000000164. Angel or its associates has not been debarred/ suspended by SEBI or any other regulatory authority for
accessing /dealing in securities Market.
This document is solely for the personal information of the recipient, and must not be singularly used as the basis of any investment
decision. Nothing in this document should be construed as investment or financial advice. Each recipient of this document should
make such investigations as they deem necessary to arrive at an independent evaluation of an investment in the securities of the
companies referred to in this document (including the merits and risks involved), and should consult their own advisors to determine
the merits and risks of such an investment.
Angel or its associates or research analyst or his relative may have actual/beneficial ownership of 1% or more in the securities of
the subject company at the end of the month immediately preceding the date of publication of the research report. Neither Angel or
its associates nor Research Analysts or his relative has any material conflict of interest at the time of publication of research report.
Angel or its associates might have received any compensation from the companies mentioned in the report during the period
preceding twelve months from the date of this report for services in respect of managing or co-managing public offerings, corporate
finance, investment banking or merchant banking, brokerage services or other advisory service in a merger or specific transaction
in the normal course of business. Angel or its associates did not receive any compensation or other benefits from the companies
mentioned in the report or third party in connection with the research report. Neither Angel nor its research analyst entity has been
engaged in market making activity for the subject company.
Reports based on technical and derivative analysis center on studying charts of a stock's price movement, outstanding positions and
trading volume, as opposed to focusing on a company's fundamentals and, as such, may not match with a report on a company's
fundamentals. Investors are advised to refer the Fundamental and Technical Research Reports available on our website to evaluate
the contrary view, if any.
The information in this document has been printed on the basis of publicly available information, internal data and other reliable
sources believed to be true, but we do not represent that it is accurate or complete and it should not be relied on as such, as this
document is for general guidance only. Angel One Limited or any of its affiliates/ group companies shall not be in any way responsible
for any loss or damage that may arise to any person from any inadvertent error in the information contained in this report. Angel One
Limited has not independently verified all the information contained within this document. Accordingly, we cannot testify, nor make
any representation or warranty, express or implied, to the accuracy, contents or data contained within this document. While Angel
One Limited endeavors to update on a reasonable basis the information discussed in this material, there may be regulatory,
compliance, or other reasons that prevent us from doing so.
This document is being supplied to you solely for your information, and its contents, information or data may not be reproduced,
redistributed or passed on, directly or indirectly.
Neither Angel One Limited, nor its directors, employees or affiliates shall be liable for any loss or damage that may arise from or in
connection with the use of this information. Angel or its associates or Research Analyst or his relative might have financial interest
in the subject company. Research analyst has not served as an officer, director or employee of the subject company.
