May 11, 2022
www.angelone.in
Technical & Derivatives Report
Nifty Bank Outlook
-
(34483)
The US markets had yet another terrible session overnight; but
despite this our markets did not open much lower. In fact, the
banking index started off marginally in the red and immediately
entered the positive terrain in the initial trades. As the day
progressed, the BANKNIFTY showed its dominance by leading
from the front. As we stepped into the last hour, BANKNIFTY was
knocking the door at 34800; but it immediately reversed from
thereon and within a blink of an eye, major chunk of gains just
got disappeared. Eventually, the index ended around 34500 by
adding more than half a percent gains. The BANKNIFTY showed
some strength yesterday but with the tail end correction, the
closing was not that sturdy as it should have been. It seems that
traders are a bit sceptical of carrying long positions overnight
due to recent streak of gap downs in our market. As far as levels
are concerned, 34150 followed by 33900 has now become a
sacrosanct support; whereas on the higher side, we may not see
a convincing rebound till the time 34800 – 35000 are not
surpassed on a sustainable basis. Yesterday’s move was
promising and if there is no aberration globally, the banking
stocks can make a comeback strongly in coming days.
Key Levels
Support 1 – 34150 Resistance 1 – 34800
Support 2 – 33900 Resistance 2 – 35000
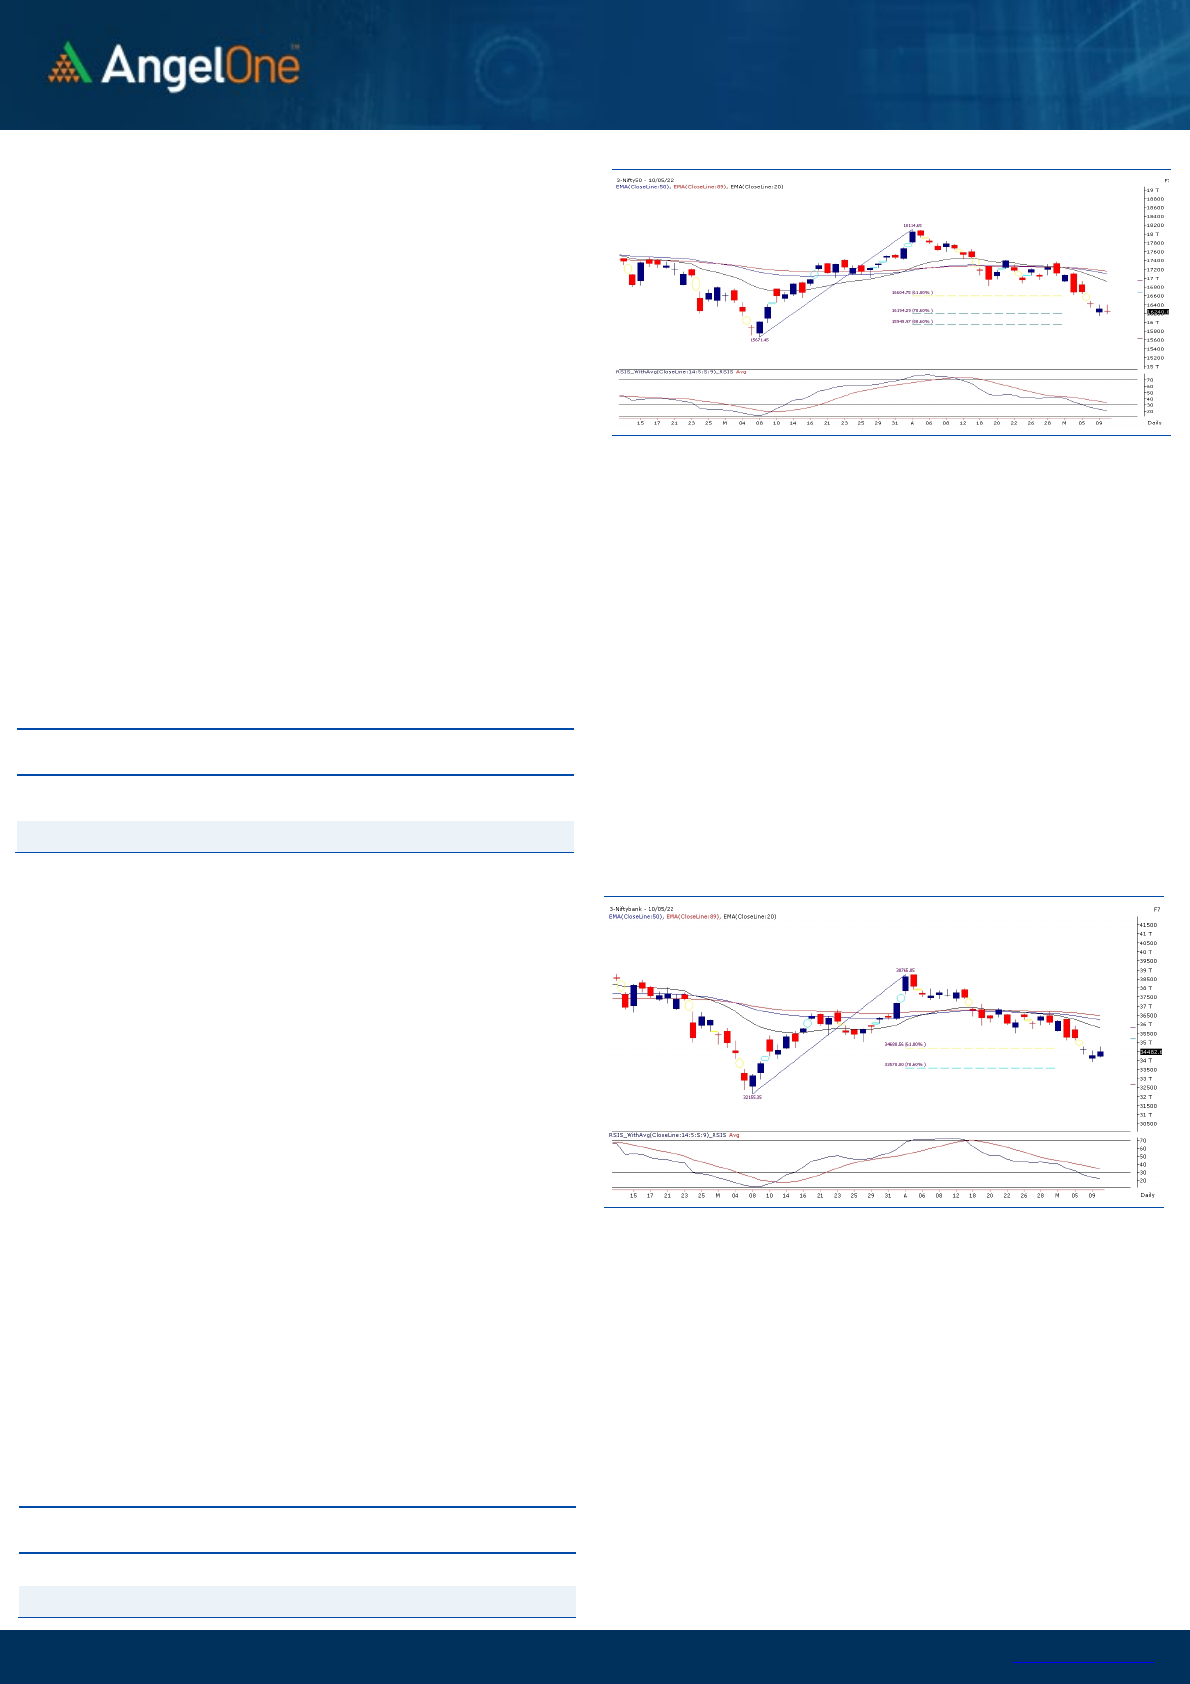
Exhibit 1: Nifty Daily Chart
Exhibit 2: Nifty Bank Daily Chart
Sensex (54365) / Nifty (16240)
The Indian equities started on a subdued note, led by the mixed
global cues, wherein the benchmark index Nifty50 witnessed a
slender range-bound movement throughout. There was no
significant action seen in the primary index until a sell-off
triggered by the fag end, which certainly showcased the
tentativeness among the market participants. Post the lackluster
session, Nifty concluded the day in red with a mere loss of 0.38
percent at 16240 levels.
At present, the index placement on the daily chart depicts the
lost traction due to across-board weakness in domestic and
global markets. As far as levels are concerned, the Nifty is
currently placed near the 78.60% of Fibonacci retracement, while
any further sell-off could drag it towards the psychological mark
of 16000 in the near future. As we allude to our previous
commentary, the unfilled gap of 16480-16650 is the sturdy wall
for the bulls. Hence, looking at the technical setup, the market is
likely to trade in the mentioned range until a breakout on either
side is seen in a decisive manner.
Key Levels
Support 1 – 16100 Resistance 1 – 16400
Support 2 – 16000 Resistance 2 – 16480
Some traction was seen in the midcaps and selective banking
counters that kept the traders active throughout the day.
Going forward, apart from the slender range-bound
movement in the indices, many stock-specific adjustments
are likely to continue. Hence, traders are advised to have a
stock-centric approach in such a market scenario, and any
aggressive bets should be avoided.

www.angelone.in
Technical & Derivatives Report
May 11, 2022
View
We had a muted start on Tuesday and than index
traded in a slender range for the major part of the
day. As we entered the final hour all of a sudden
market corrected to conclude tad below 16250.
FIIs were net sellers in the cash market segment
to the tune of Rs. 3961 crores. Simultaneously, in
Index futures, they bought worth Rs. 345 crores
with fall in open interest, indicating short
covering after quite some time.
Although, we saw some selling in the fag end but we
observed decent short covering in the Nifty and
fresh long addition in banking index. FIIs continue
with their selling streak in equities but preferred
covering their bearish bets in index futures. The
futures which traded in discount of Monday have
been trading at premium again. In index options
front, fresh build-up was seen in 16300-16700 call
strikes. On the other side, some positions got piled
up in 17200. Considering the above development, we
dont see major downside from heron and hence, we
would advise trader using intraday declines to add
quality stocks.
Comments
The Nifty futures open interest has decreased by 4.96%.
and BANK Nifty futures open interest has increased by
5.62% as the market closed at 16240.05.
The Nifty May future closed with a premium of 7.05 point
against a discount of 3.00 point in the last trading
session. The June series closed at a premium of 11.55
point.
The INDIA VIX increased from 22.00 to 22.30. At the
same time, the PCR-OI of Nifty has decreased from 0.80
to 0.76.
Few of the liquid counters where we have seen high
cost of carry are IDEA, M&M, NATIONALUM, BATAINDIA
and ICICIPRULI.
Historical Volatility
SCRIP HV
COALINDIA 45.32
VOLTAS 40.44
TATASTEEL 49.70
ONGC 47.00
GNFC 60.70
Nifty Vs OI
15600
15800
16000
16200
16400
16600
16800
17000
17200
17400
17600
,0
2,000
4,000
6,000
8,000
10,000
12,000
14,000
16,000
4-20 4-22 4-26 4-28 5-2 5-5 5-9
Openinterest Nifty
OI Gainers
SCRIP OI
OI
CHG. (%)
PRICE
PRICE
CHG. (%)
ALKEM 296400 11.60 2971.60 -3.63
VOLTAS 4270500 11.33 988.75 -5.88
SRF 4030500 10.83 2113.10 -5.22
DIXON 931875 10.02 3680.10 -3.65
TATASTEEL 32209475 8.57 1164.90 -6.83
INDUSTOWER 14277200 7.69 208.00 0.92
LALPATHLAB 836875 7.10 2316.45 -2.42
PVR 2757832 6.96 1772.25 4.13
OI Losers
SCRIP OI
OI
CHG. (%)
PRICE
PRICE
CHG. (%)
ABB 415500 -9.72 2230.55 -3.21
ONGC 45661000 -7.09 154.45 -6.24
OFSS 298575 -7.01 3571.10 0.08
GUJGASLTD 3367500 -5.61 507.05 -2.35
HINDPETRO 11542500 -5.04 270.50 0.74
VEDL 44632250 -4.36 330.35 -5.51
UBL 1167350 -3.92 1457.95 -0.61
HAL 2511325 -3.59 1550.60 -1.31
Put-Call Ratio
SCRIP PCR (OI) PCR (VOL)
NIFTY 0.76 0.79
BANKNIFTY 0.71 0.85
RELIANCE 0.29 0.36
ICICIBANK 0.44 0.36
INFY 0.40 0.38
www.angelone.in
Technical & Derivatives Report
May 11, 2022
Note: Above mentioned Bullish or Bearish Spreads in Nifty (May Series) are given as an information and not as a recommendation.
Nifty Spot = 16,
240.05
FII Statistics for
May
10
, 2021
Detail Buy
Contracts
Open
Interest
Value
(in Cr.)
Sell
Net
CHANGE
INDEX
FUTURES
5390.10 5045.30 344.80
173334 14360.67 (5.54)
INDEX
OPTIONS
629668.51 627496.59 2171.92
1636728 134483.06 7.82
STOCK
FUTURES
15212.53 15592.90 (380.37) 2218462 137286.09 1.81
STOCK
OPTIONS
7212.45 7234.71 (22.26) 124610 8099.90 7.35
Total
657483.59
655369.50
2114.09
4153134
294229.72
3.91
Turnover on
May
10
, 29021
Instrument
No. of
Contracts
Turnover
( in Cr. )
Change
(%)
Index
Futures
479401 40040.93 -3.95
Index
Options
91487930 7718427.11
4.88
Stock
Futures
911688 57695.65 -0.88
Stock
Options
2790072 192053.38 -6.36
Total
27,90,072 192053.38 4.48
Bull
-
Call Spreads
Action Strike Price Risk Reward BEP
Buy
16400 324.95
55.45 44.55 16455.45
Sell
16500 269.50
Buy
16400 324.95
101.00 99.00 16501.00
Sell
16600 223.95
Buy
16500 269.50
45.55 54.45 16545.55
Sell 16600 223.95
Bear
-
Put Spreads
Action Strike Price Risk Reward BEP
Buy
16400 304.30
44.05 55.95 16355.95
Sell
16300 260.25
Buy
16400 304.30
81.90 118.10 16318.10
Sell
16200 222.40
Buy
16300 260.25
37.85 62.15 16262.15
Sell
16200 222.40
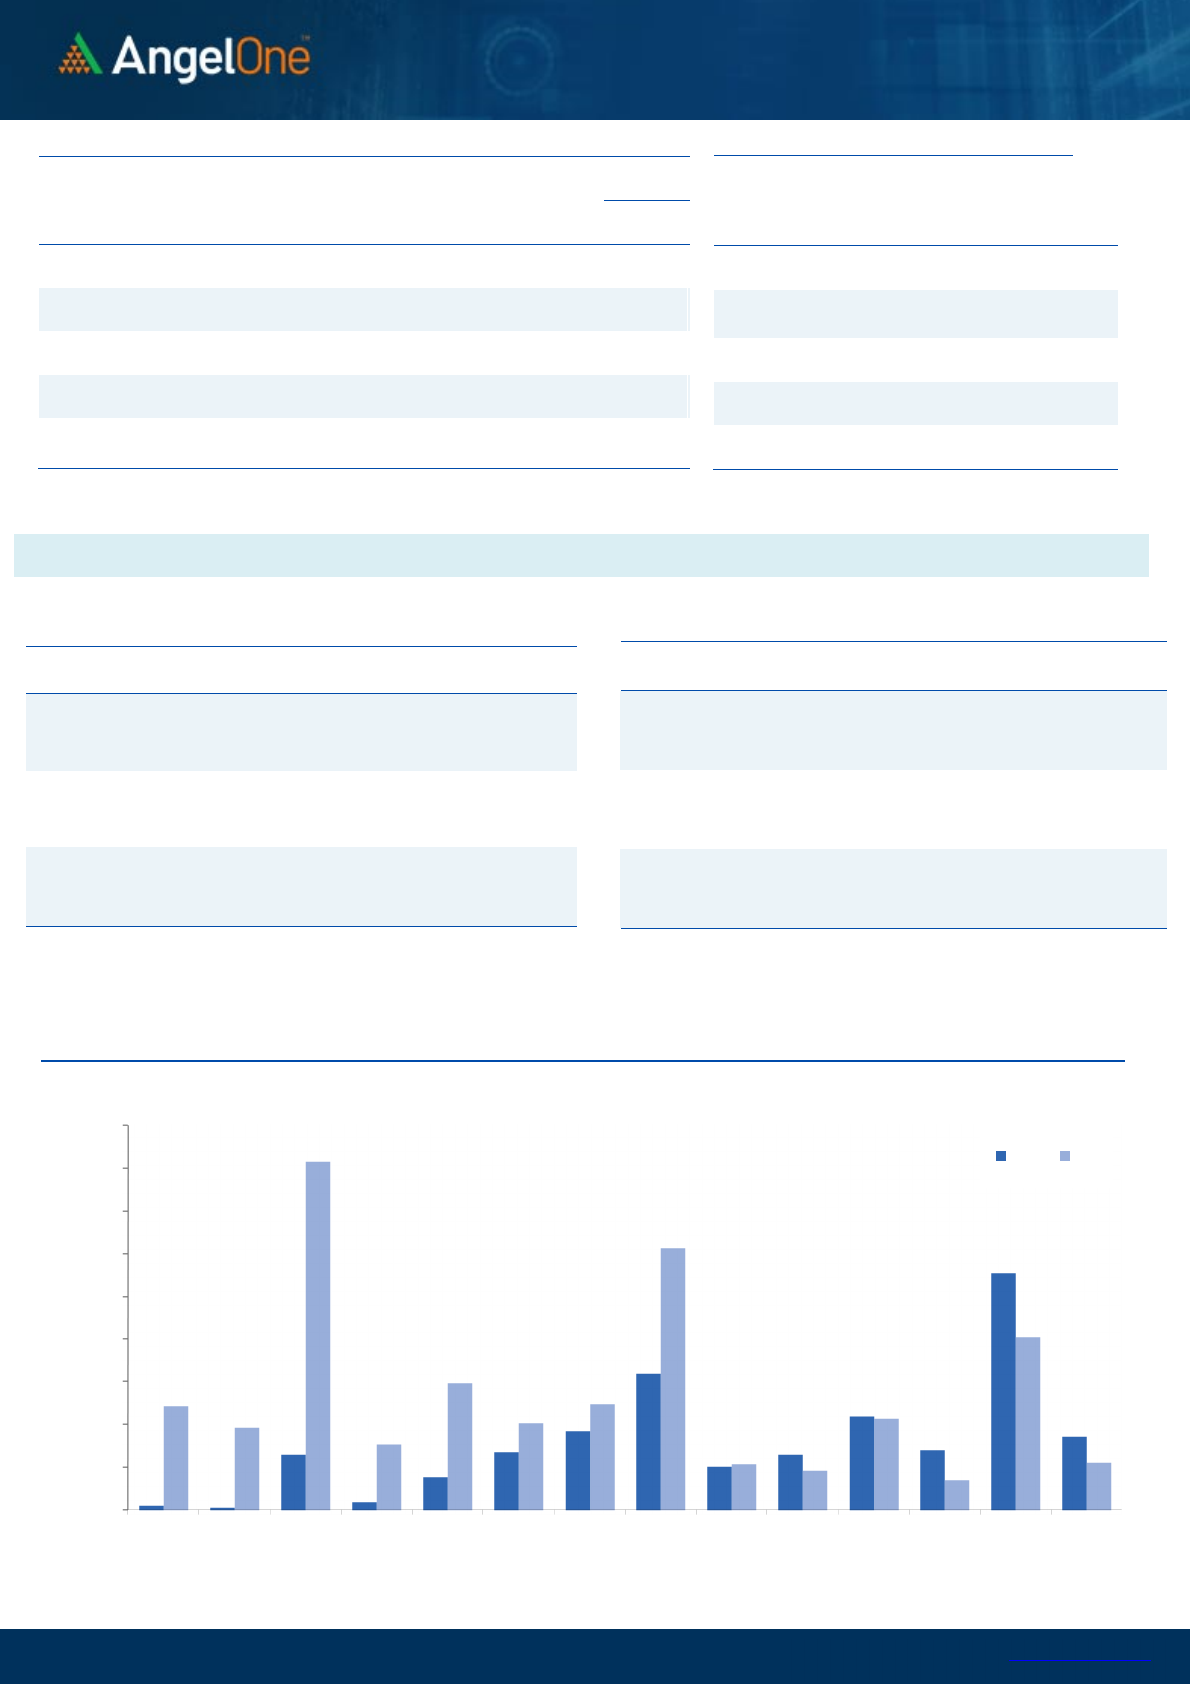
Nifty Put
-
Call Analysis
,0
500,000
1000,000
1500,000
2000,000
2500,000
3000,000
3500,000
4000,000
4500,000
15800 15900 16000 16100 16200 16300 16400 16500 16600 16700 16800 16900 17000 17100
Call Put

www.angelone.in
Technical & Derivatives Report
May 11, 2022
`
Daily Pivot Levels for Nifty Constituents
Scrips
S2
S1
PIVOT
R1
R2
ADANIPORTS 740 755
779 794 818
APOLLOHOSP 3,590 3,638
3,710 3,759 3,831
ASIANPAINT 2,984 3,035
3,087 3,138 3,190
AXISBANK 649 654
663 669 678
BAJAJ-AUTO 3,487 3,540
3,593 3,647 3,700
BAJFINANCE 5,767 5,848
5,981 6,061 6,194
BAJAJFINSV 13,307 13,468
13,724 13,886 14,141
BPCL 348 351
354 357 361
BHARTIARTL 701 710
719 729 738
BRITANNIA 3,182 3,214
3,267 3,300 3,353
CIPLA 907 917
928 938 949
COALINDIA 159 165
174 180 189
DIVISLAB 4,170 4,233
4,273 4,336 4,376
DRREDDY 3,869 3,891
3,913 3,935 3,957
EICHERMOT 2,291 2,353
2,397 2,460 2,504
GRASIM 1,509 1,526
1,551 1,567 1,592
HCLTECH 1,056 1,064
1,075 1,083 1,093
HDFCBANK 1,298 1,320
1,336 1,358 1,374
HDFCLIFE 548 554
563 569 578
HDFC 2,133 2,167
2,194 2,229 2,256
HEROMOTOCO 2,422 2,446
2,483 2,507 2,543
HINDALCO 407 415
429 437 451
HINDUNILVR 2,087 2,134
2,166 2,213 2,245
ICICIBANK 697 704
712 719 727
INDUSINDBK 874 893
906 925 938
INFY 1,533 1,543
1,556 1,566 1,579
ITC 254 257
262 265 270
JSW STEEL 621 633
655 667 689
KOTAKBANK 1,750 1,774
1,791 1,815 1,832
LT 1,584 1,596
1,613 1,625 1,641
M&M 868 878
894 905 921
MARUTI 7,256 7,386
7,480 7,611 7,705
NESTLEIND 16,255 16,388
16,534 16,667 16,813
NTPC 150 153
157 160 164
ONGC 148 151
156 160 165
POWERGRID 239 241
245 247 251
RELIANCE 2,418 2,446
2,486 2,515 2,555
SBILIFE 1,045 1,063
1,080 1,098 1,115
SHREECEM 23,621 23,961
24,239 24,579 24,857
SBIN 468 472
477 481 486
SUNPHARMA 822 842
866 886 911
TCS 3,399 3,419
3,442 3,462 3,485
TATACONSUM
724 735
754 764 783
TATAMOTORS 378 385
397 404 416
TATASTEEL 1,097 1,131
1,193 1,227 1,289
TECHM 1,213 1,228
1,250 1,264 1,286
TITAN 2,088 2,113
2,149 2,174 2,210
ULTRACEMCO 6,107 6,237
6,330 6,460 6,553
UPL 768 779
790 801 812
WIPRO 472 475
479 482 487

www.angelone.in
Technical & Derivatives Report
May 11, 2022
*
Technical and Derivatives Team:
Sameet Chavan
Chief Analyst
–
Technical & Derivatives
sameet.chavan@angelone.in
Sneha Seth Senior Analyst – Technical & Derivatives sneha.seth@angelone.in
Rajesh Bhosale Technical Analyst rajesh.bhosle@angelone.in
Osho Krishan Senior Analyst – Technical & Derivatives osho.krishan@angelone.in
Research Team Tel: 022 – 39357600 (Extn. 6844) Website: www.angelone.in
For Technical Queries E-mail: technicalresearch-cso@angelone.in
For Derivatives Queries E-mail: derivatives.desk@angelone.in
DISCLAIMER
Angel One Limited (hereinafter referred to as “Angel”) is a registered Member of National Stock Exchange of India Limited, Bombay
Stock Exchange Limited and Metropolitan Stock Exchange Limited. It is also registered as a Depository Participant with CDSL and
Portfolio Manager and investment advisor with SEBI. It also has registration with AMFI as a Mutual Fund Distributor. Angel One
Limited is a registered entity with SEBI for Research Analyst in terms of SEBI (Research Analyst) Regulations, 2014 vide registration
number INH000000164. Angel or its associates has not been debarred/ suspended by SEBI or any other regulatory authority for
accessing /dealing in securities Market.
This document is solely for the personal information of the recipient, and must not be singularly used as the basis of any investment
decision. Nothing in this document should be construed as investment or financial advice. Each recipient of this document should
make such investigations as they deem necessary to arrive at an independent evaluation of an investment in the securities of the
companies referred to in this document (including the merits and risks involved), and should consult their own advisors to determine
the merits and risks of such an investment.
Angel or its associates or research analyst or his relative may have actual/beneficial ownership of 1% or more in the securities of
the subject company at the end of the month immediately preceding the date of publication of the research report. Neither Angel or
its associates nor Research Analysts or his relative has any material conflict of interest at the time of publication of research report.
Angel or its associates might have received any compensation from the companies mentioned in the report during the period
preceding twelve months from the date of this report for services in respect of managing or co-managing public offerings, corporate
finance, investment banking or merchant banking, brokerage services or other advisory service in a merger or specific transaction
in the normal course of business. Angel or its associates did not receive any compensation or other benefits from the companies
mentioned in the report or third party in connection with the research report. Neither Angel nor its research analyst entity has been
engaged in market making activity for the subject company.
Reports based on technical and derivative analysis center on studying charts of a stock's price movement, outstanding positions and
trading volume, as opposed to focusing on a company's fundamentals and, as such, may not match with a report on a company's
fundamentals. Investors are advised to refer the Fundamental and Technical Research Reports available on our website to evaluate
the contrary view, if any.
The information in this document has been printed on the basis of publicly available information, internal data and other reliable
sources believed to be true, but we do not represent that it is accurate or complete and it should not be relied on as such, as this
document is for general guidance only. Angel One Limited or any of its affiliates/ group companies shall not be in any way responsible
for any loss or damage that may arise to any person from any inadvertent error in the information contained in this report. Angel One
Limited has not independently verified all the information contained within this document. Accordingly, we cannot testify, nor make
any representation or warranty, express or implied, to the accuracy, contents or data contained within this document. While Angel
One Limited endeavors to update on a reasonable basis the information discussed in this material, there may be regulatory,
compliance, or other reasons that prevent us from doing so.
This document is being supplied to you solely for your information, and its contents, information or data may not be reproduced,
redistributed or passed on, directly or indirectly.
Neither Angel One Limited, nor its directors, employees or affiliates shall be liable for any loss or damage that may arise from or in
connection with the use of this information. Angel or its associates or Research Analyst or his relative might have financial interest
in the subject company. Research analyst has not served as an officer, director or employee of the subject company.
