November 10, 2021
www.angelone.in
Technical & Derivatives Report
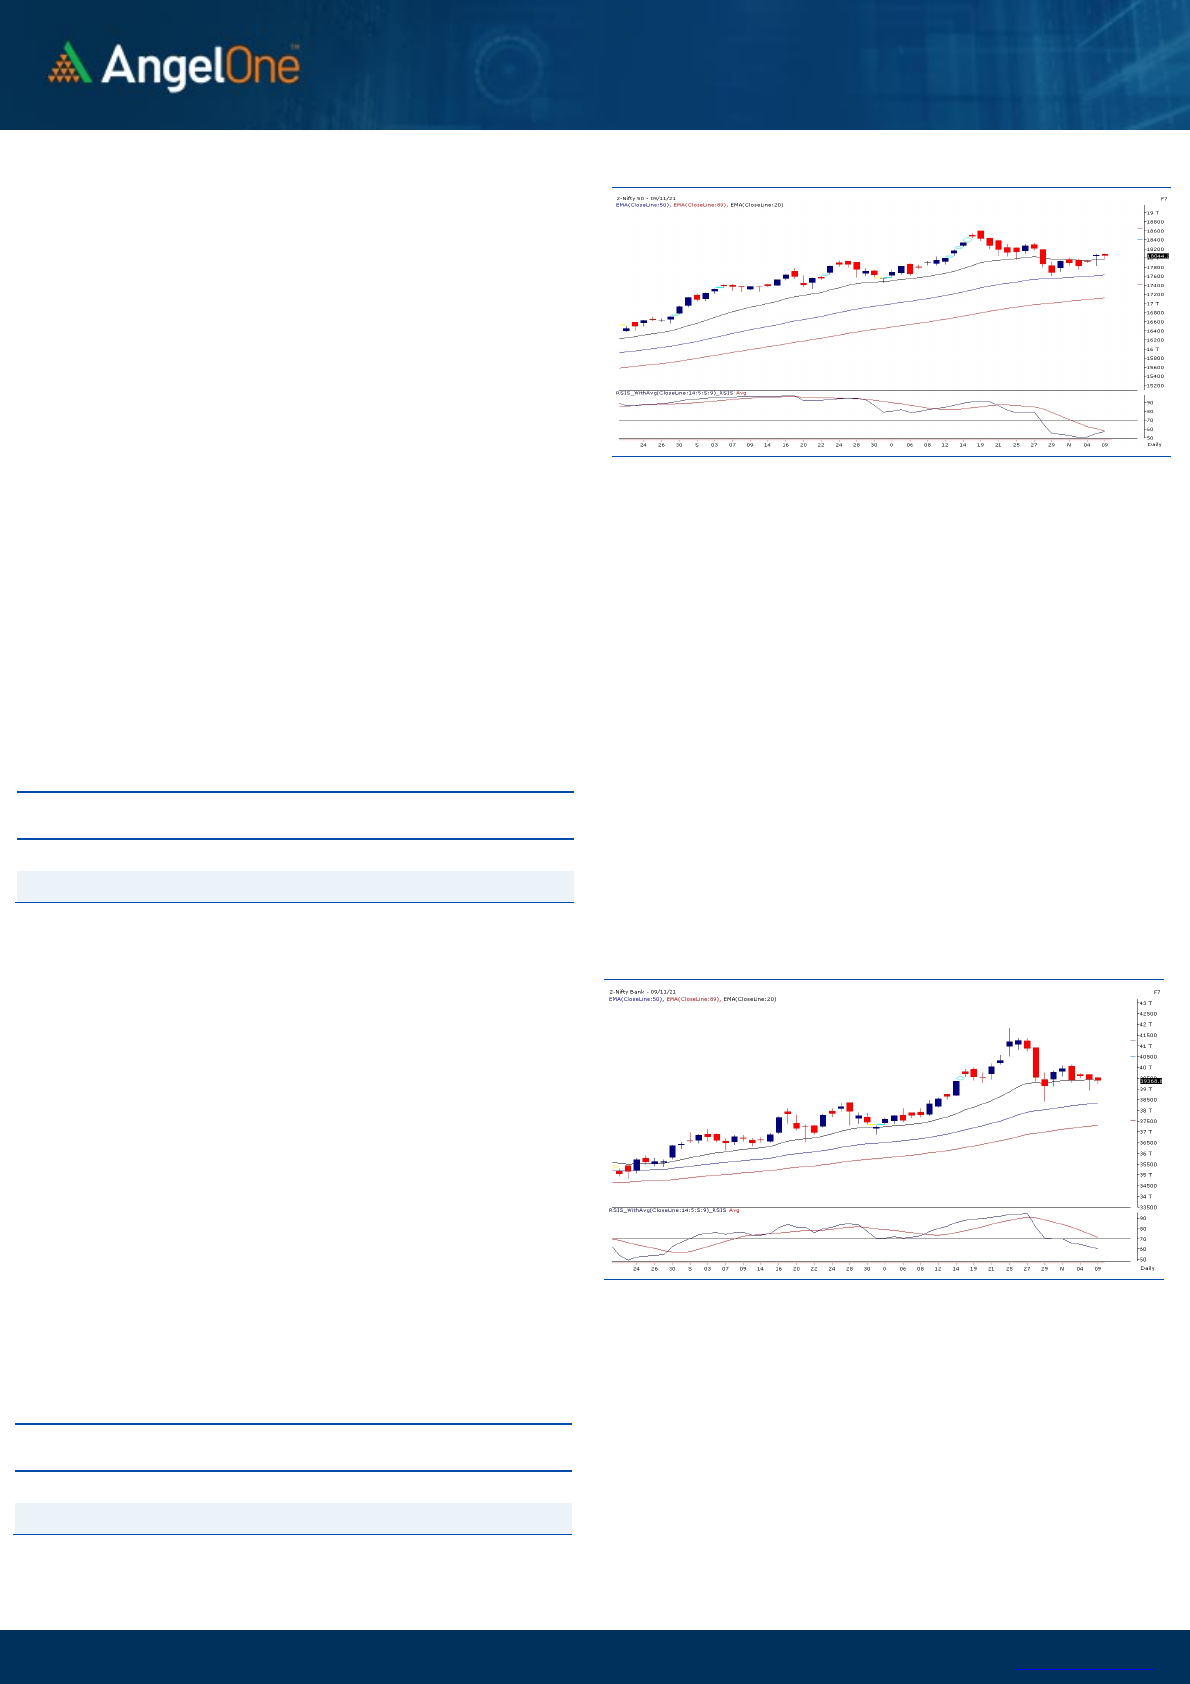
Nifty Bank Outlook - (39369)
We had a flat start yesterday and then prices remained in a range
throughout the session to eventually end with marginal a loss of
0.18% at 39369.
Technically not much has changed as prices traded within a very
slender range of 300 points and ended within the previous candle
range. If we meticulously observe the daily chart, prices have traped
within a range of 40000 – 40200 on the higher side whereas 38400 on
the lower side. In the last few sessions, we have seen
underperformance by heavyweight private banks whereas the PSU
banks and some of the mid-size private banks have shown significanct
outperformance. Hence, as long the bank index is trapped in this
range, traders should continue with stock specific trades that are
giving opportunities on both sides of the trend.
Key Levels
Support 1 – 39000 Resistance 1 – 39750
Support 2 – 38400 Resistance 2 – 40200
Exhibit 2: Nifty Bank Daily Chart
Sensex (60433) / Nifty (18044)
We had a flat opening yesterday on the back of muted cues from the
global peers. In first couple of hours, Nifty had a small bout of profit
booking after testing the 18100 mark. However there was no major
damage done as Nifty stabilised immediately after sneaking below
18000. During the remaining part of the session, it remained in a
slender range to eventually conclude the session with a negligible loss.
Monday’s wild swings on both sides was followed by a quiet session
yesterday; because there were lot of mixed moves within the
heavyweight basket. However the real action was seen outside the
index in some of the individual stocks. Since there was no major price
movement in the benchmark, our view and levels more or less remains
the same. We have been mentioning the levels of 18100 – 18200
(immediate resistances) in order to regain strength but if we take a
close look at the broader picture, 18350 stands to be a crucial level
which if gets surpassed, Nifty could see new highs thereafter. But till
then one should continue with a ‘Sell on rise’ strategy. On the flipside,
17950 – 17850 are to be considered as key supports. Traders are still
advised to stay light and even if one wants to focus on individual stocks,
a proper money management is must to follow.
Key Levels
Support 1 – 18000 Resistance 1 – 18100
Support 2 – 17850 Resistance 2 – 18200
Exhibit 1: Nifty Daily Chart
www.angelone.in
Technical & Derivatives Report
November 10, 2021
View
We had a cheerful start backed by positive global cues;
In the initial hour, we saw index inching beyond 18100 but
this gains were short lived as we saw some
nervousness to drag index below 18000 mark in the
midst. In the latter half, index recovered and concluded
the day at 18044.25.
FIIs were net sellers in the cash market segment to the
tune of Rs. 2445 crores. In index futures, they sold worth
Rs. 2621 crores with decrease in open interest indicating
long unwinding.
Post Monday’s recovery, the momentum looked missing
in both the indices. In F&O space, we saw some open
interest reduction and banking index added some mixed
bets. Stronger hands continued their selling streak in
equities and preferred booking profits in index and stock
futures. In Nifty options front, we saw massive writing
in 18200 call options resulting highest build-up for call
shifting from 18500 to 18200 strike. On the other side,
good amount of unwinding was visible in 17900 puts
which holds highest outstanding contracts. Considering
the above data points, we believe upside is now capped
and hence would advocated ligherning longs in any and
buying ATM puts incase Nifty slides below 18000 mark.
Comments
The Nifty futures open interest has decreased by 3.12%.
Bank Nifty futures open interest has increased by 5.73%
as market closed at 18044.25 levels.
The Nifty November future closed with a premium of
26.15 point against a premium of 54.20 point in last
trading session. The December series closed at a
premium of 84.90 point.
The INDIA VIX decreased from 16.34 to 16.00. At the same
time, the PCR-OI of Nifty has decreased from 1.12 to 0.96.
Few of the liquid counters where we have seen high cost
of carry are BRITANNIA, M&M, TVSMOTOR, RBLBANK
and IBULHSGFIN.
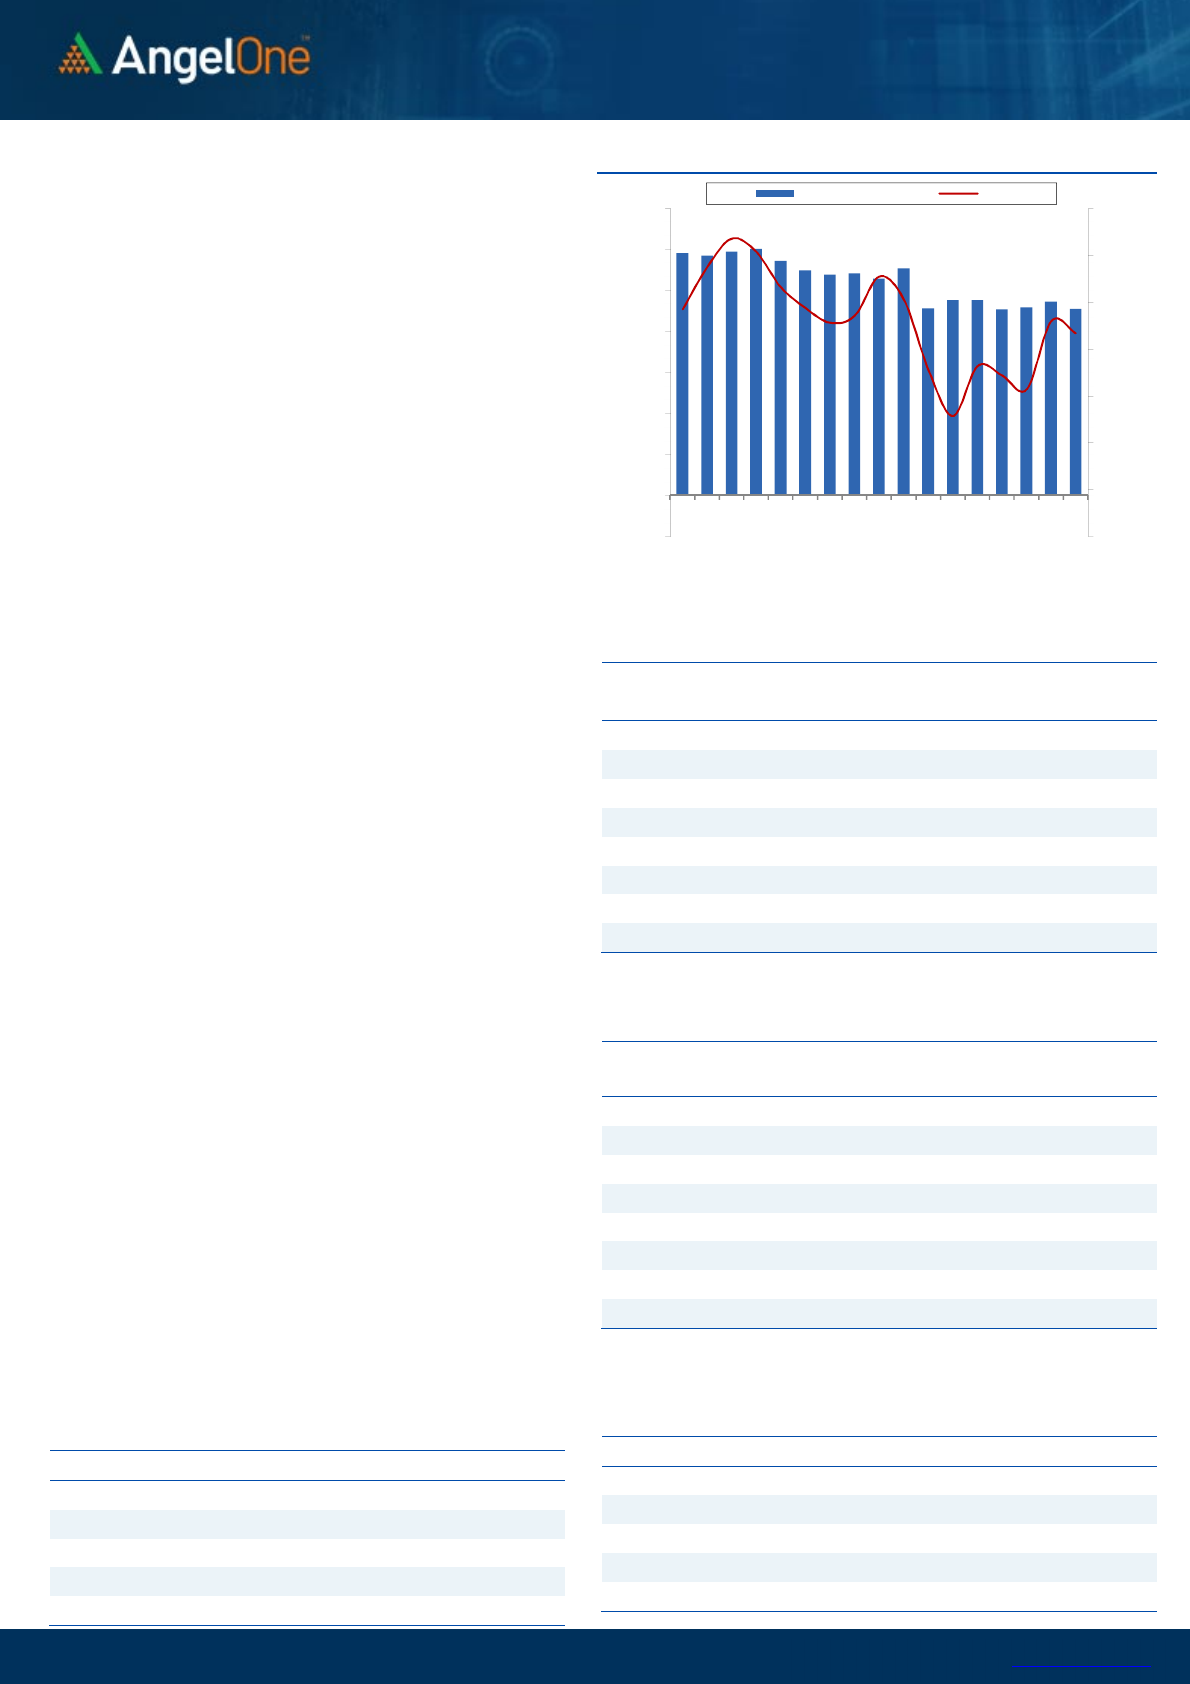
Nifty Vs OI
17200
17400
17600
17800
18000
18200
18400
18600
,0
2,000
4,000
6,000
8,000
10,000
12,000
14,000
16,000
10-13 10-18 10-20 10-22 10-26 10-28 11-1 11-3 11-5
(`000)
Openinterest Nifty
OI Gainers
SCRIP OI
OI
CHG. (%)
PRICE
PRICE
CHG. (%)
BRITANNIA
1409400 30.28 3621.60 -3.01
M&M
13827100 20.37 892.15 4.09
TVSMOTOR
8015000 18.87 731.45 2.31
RBLBANK
31943500 15.91 217.25 6.48
IBULHSGFIN
37361200 13.85 243.65 4.57
PFC
43691400 10.56 139.05 -1.39
INDIAMART
310575 10.52 7212.40 0.57
BOSCHLTD
162550 10.17 18762.10 3.05
OI Losers
SCRIP OI
OI
CHG. (%)
PRICE
PRICE
CHG. (%)
ULTRACEMCO
1699500 -6.64 8165.95 -0.65
VOLTAS
2201500 -5.72 1252.00 1.01
ADANIENT
24591500 -5.65 1635.45 4.52
SBILIFE
7216500 -5.36 1207.25 0.57
PFIZER
202875 -4.92 5240.55 -0.20
SUNTV
13939500 -4.91 581.10 0.56
ABFRL
11086400 -4.80 305.75 5.86
SRTRANSFIN
3120800 -4.68 1616.00 -2.59
Put-Call Ratio
SCRIP PCR-OI PCR-VOL
NIFTY
0.96 0.90
BANKNIFTY
0.64 0.95
RELIANCE
0.42 0.33
ICICIBANK
0.43 0.38
INFY
0.46 0.31
Historical Volatility
SCRIP HV
ABFRL
50.55
RBLBANK
63.31
ESCORTS
45.69
POLYCAB
42.27
M&M
41.13
www.angelone.in
Technical & Derivatives Report
November 10, 2021
Note: Above mentioned Bullish or Bearish Spreads in Nifty (November Series) are given as an information and not as a recommendation.
Nifty Spot = 180
44.25
FII Statistics for November 09, 2021
Detail Buy
Net Contracts
Open Interest
Sell
Value
(in Cr.)
Change
INDEX
FUTURES
2411.50 5033.05 (2621.55) 147027 13648.94 (8.79)
INDEX
OPTIONS
356755.31 354363.95 2391.36
1388780 128195.40 0.78
297314.41
STOCK
FUTURES
14828.24 15676.98 (848.74) 1754006 132414.45 (0.17)
STOCK
OPTIONS
16524.55 16674.36 (149.81) 290519 22816.35 7.18
Total
390519.60
391748.34
(1228.74) 3580332
297075.14
0.37
43446.77
Turnover on November 09, 2021
Instrument
No. of
Contracts
Turnover
( in Cr. )
Change
(%)
Index Futures
242849 22790.04 -38.29
Index Options
47454028 4522043.18 -14.33
Stock Futures
871704 70761.21 -5.55
Stock Options
2695066 225099.61 1.26
Total
5,12,63,647
4840694.04 -13.75
Bull-Call Spreads
Action Strike Price Risk Reward BEP
Buy
18100 204.55
45.15 54.85 18145.15
Sell
18200 159.40
Buy
18100 204.55
82.10 117.90 18182.10
Sell
18300 122.45
Buy
18200 159.40
36.95 63.05 18236.95
Sell
18300 122.45
Bear-Put Spreads
Action Strike Price Risk Reward BEP
Buy
18100 229.35
46.00 54.00 18054.00
Sell
18000 183.35
Buy
18100 229.35
84.40 115.60 18015.60
Sell
17900 144.95
Buy
18000 183.35
38.40 61.60 17961.60
Sell
17900 144.95
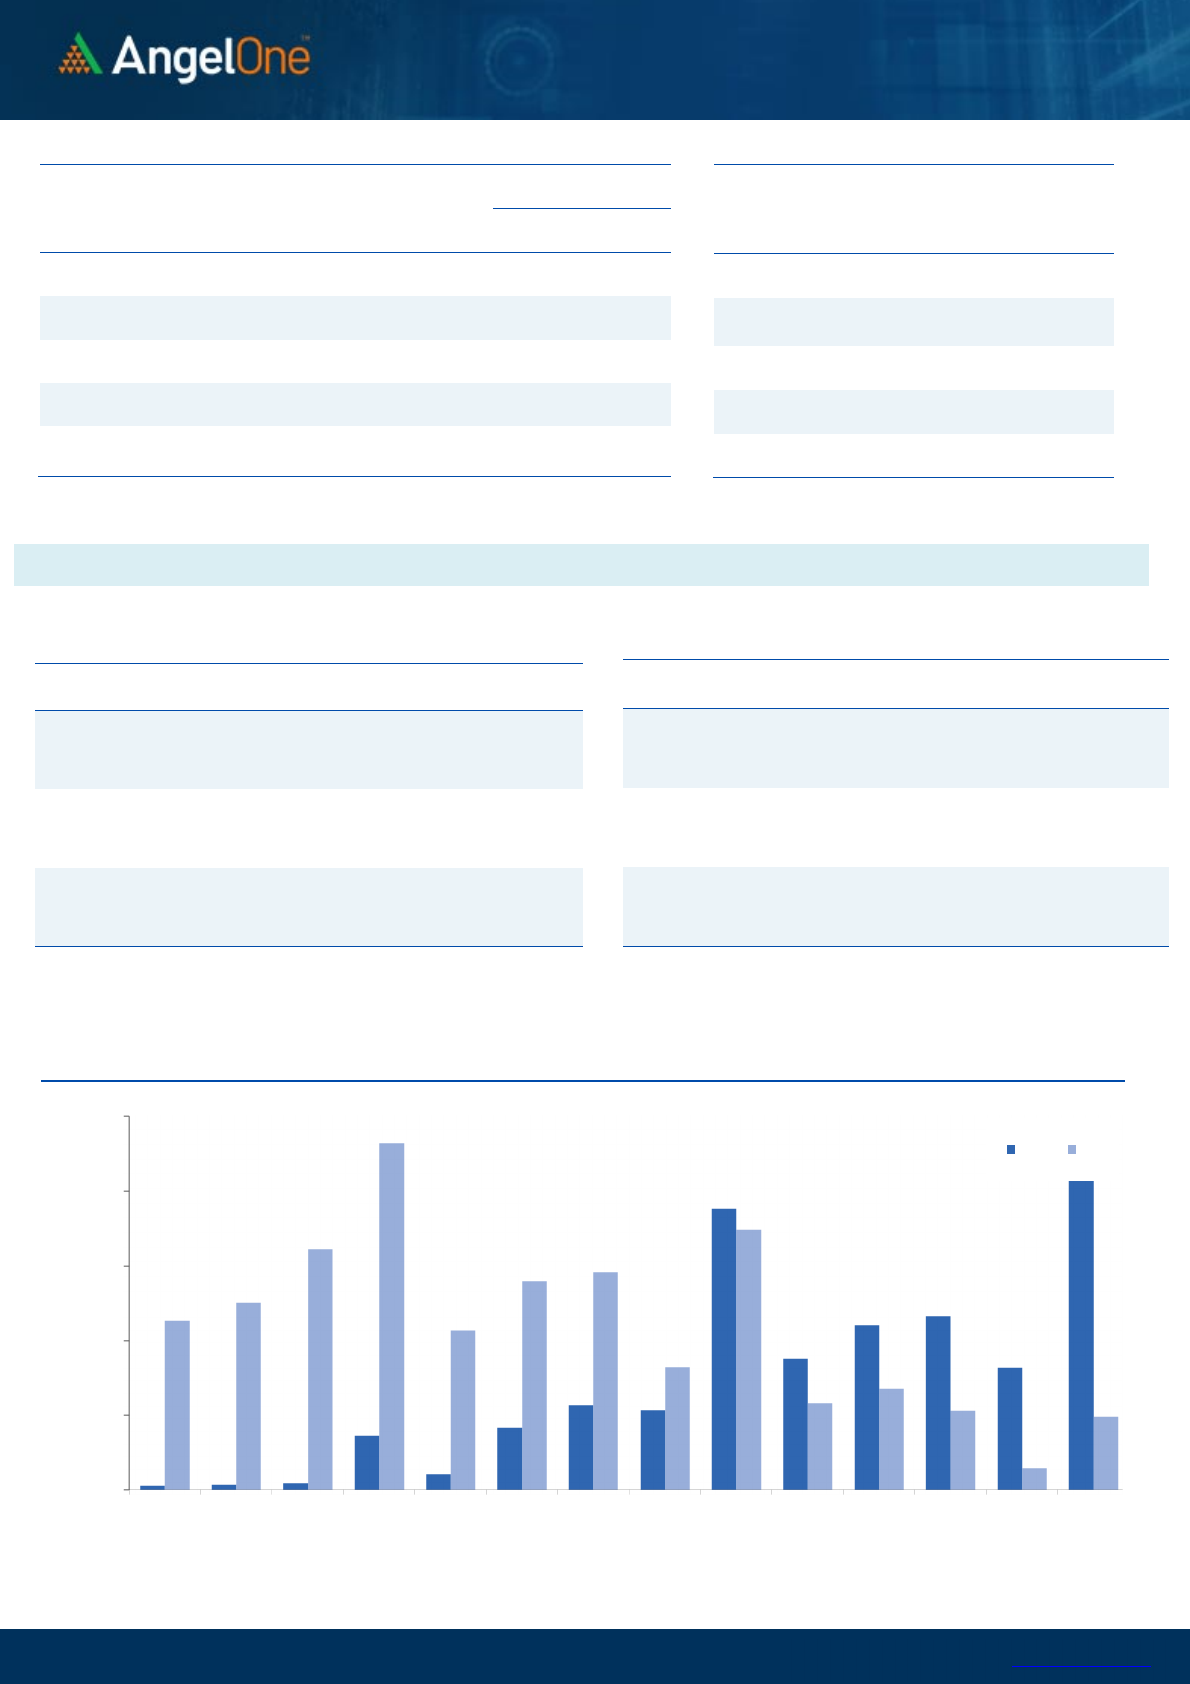
Nifty Put-Call Analysis
,0
500,000
1000,000
1500,000
2000,000
2500,000
17200 17300 17400 17500 17600 17700 17800 17900 18000 18100 18200 18300 18400 18500
Call Put

www.angelone.in
Technical & Derivatives Report
November 10, 2021
`
Daily Pivot Levels for Nifty Constituents
Scrips S2 S1 PIVOT R1 R2
ADANIPORTS 720 729
737 745 753
ASIANPAINT 3,105 3,125
3,140 3,160 3,175
AXISBANK 737 741
747 752 758
BAJAJ-AUTO 3,731 3,763
3,804 3,836 3,877
BAJFINANCE 7,423 7,500
7,627 7,705 7,832
BAJAJFINSV 17,848 18,010
18,243 18,405 18,638
BPCL 424 427
430 433 436
BHARTIARTL 700 707
712 718 723
BRITANNIA 3,495 3,558
3,599 3,662 3,702
CIPLA 901 908
916 923 932
COALINDIA 168 169
171 172 174
DIVISLAB 4,809 4,880
4,987 5,058 5,164
DRREDDY 4,741 4,767
4,801 4,826 4,861
EICHERMOT 2,680 2,702
2,723 2,745 2,766
GRASIM 1,833 1,848
1,864 1,880 1,895
HCLTECH 1,158 1,165
1,178 1,186 1,199
HDFCBANK 1,553 1,563
1,579 1,588 1,604
HDFCLIFE 694 700
705 711 716
HDFC 2,891 2,916
2,942 2,967 2,992
HEROMOTOCO 2,650 2,682
2,716 2,748 2,782
HINDALCO 454 459
468 473 482
HINDUNILVR 2,402 2,416
2,431 2,446 2,461
ICICIBANK 775 781
785 790 794
IOC 138 139
140 141 143
INDUSINDBK 1,049 1,059
1,072 1,081 1,094
INFY 1,716 1,729
1,740 1,753 1,764
ITC 226 227
229 230 232
JSW STEEL 665 671
681 687 697
KOTAKBANK 2,059 2,078
2,102 2,122 2,146
LT 1,912 1,928
1,946 1,962 1,980
M&M 844 868
887 911 930
MARUTI 7,401 7,489
7,627 7,715 7,853
NESTLEIND 18,685 18,813
18,929 19,057 19,173
NTPC 136 137
139 141 143
ONGC 153 155
157 158 160
POWERGRID 182 184
187 190 192
RELIANCE 2,471 2,496
2,513 2,538 2,554
SBILIFE 1,184 1,196
1,204 1,215 1,223
SHREECEM 28,772 29,001
29,380 29,609 29,989
SBIN 518 524
528 533 538
SUNPHARMA 788 795
803 810 818
TCS 3,473 3,489
3,512 3,528 3,551
TATACONSUM
819 827
834 843 850
TATAMOTORS 494 502
511 519 528
TATASTEEL 1,310 1,323
1,342 1,355 1,373
TECHM 1,542 1,551
1,561 1,570 1,580
TITAN 2,463 2,488
2,516 2,540 2,568
ULTRACEMCO 8,076 8,121
8,188 8,233 8,300
UPL 737 742
747 752 758
WIPRO 651 655
660 664 670

www.angelone.in
Technical & Derivatives Report
November 10, 2021
*
Research Team Tel: 022 – 39357600 (Extn. 6844) Website: www.angelone.in
For Technical Queries E-mail: technicalresearch-cso@angelbroking.com
For Derivatives Queries E-mail: derivatives.desk@angelbroking.com
DISCLAIMER
Angel Broking Limited (hereinafter referred to as “Angel”) is a registered Member of National Stock Exchange of India Limited,
Bombay Stock Exchange Limited and Metropolitan Stock Exchange Limited. It is also registered as a Depository Participant with
CDSL and Portfolio Manager and Investment Adviser with SEBI. It also has registration with AMFI as a Mutual Fund Distributor. Angel
Broking Limited is a registered entity with SEBI for Research Analyst in terms of SEBI (Research Analyst) Regulations, 2014 vide
registration number INH000000164. Angel or its associates has not been debarred/ suspended by SEBI or any other regulatory
authority for accessing /dealing in securities Market. Angel or its associates/analyst has not received any compensation / managed
or co-managed public offering of securities of the company covered by Analyst during the past twelve months.
This document is solely for the personal information of the recipient, and must not be singularly used as the basis of any investment
decision. Nothing in this document should be construed as investment or financial advice. Each recipient of this document should
make such investigations as they deem necessary to arrive at an independent evaluation of an investment in the securities of the
companies referred to in this document (including the merits and risks involved), and should consult their own advisors to determine
the merits and risks of such an investment.
Reports based on technical and derivative analysis center on studying charts of a stock's price movement, outstanding positions and
trading volume, as opposed to focusing on a company's fundamentals and, as such, may not match with a report on a company's
fundamentals. Investors are advised to refer the Fundamental and Technical Research Reports available on our website to evaluate
the contrary view, if any.
The information in this document has been printed on the basis of publicly available information, internal data and other reliable
sources believed to be true, but we do not represent that it is accurate or complete and it should not be relied on as such, as this
document is for general guidance only. Angel Broking Limited or any of its affiliates/ group companies shall not be in any way
responsible for any loss or damage that may arise to any person from any inadvertent error in the information contained in this
report. Angel Broking Limited has not independently verified all the information contained within this document. Accordingly, we
cannot testify, nor make any representation or warranty, express or implied, to the accuracy, contents or data contained within this
document. While Angel Broking Limited endeavors to update on a reasonable basis the information discussed in this material, there
may be regulatory, compliance, or other reasons that prevent us from doing so.
This document is being supplied to you solely for your information, and its contents, information or data may not be reproduced,
redistributed or passed on, directly or indirectly.
Neither Angel Broking Limited, nor its directors, employees or affiliates shall be liable for any loss or damage that may arise from
or in connection with the use of this information.
Technical and Derivatives Team:
Sameet Chavan Chief Analyst – Technical & Derivatives sameet.chavan@angelone.in
Rajesh Bhosale Technical Analyst rajesh.bhosle@angelone.in
Sneha Seth Derivatives Analyst sneha.seth@angelone.in
