Aug 10, 2022
www.angelone.in
Technical & Derivatives Report
OOOOOOOO
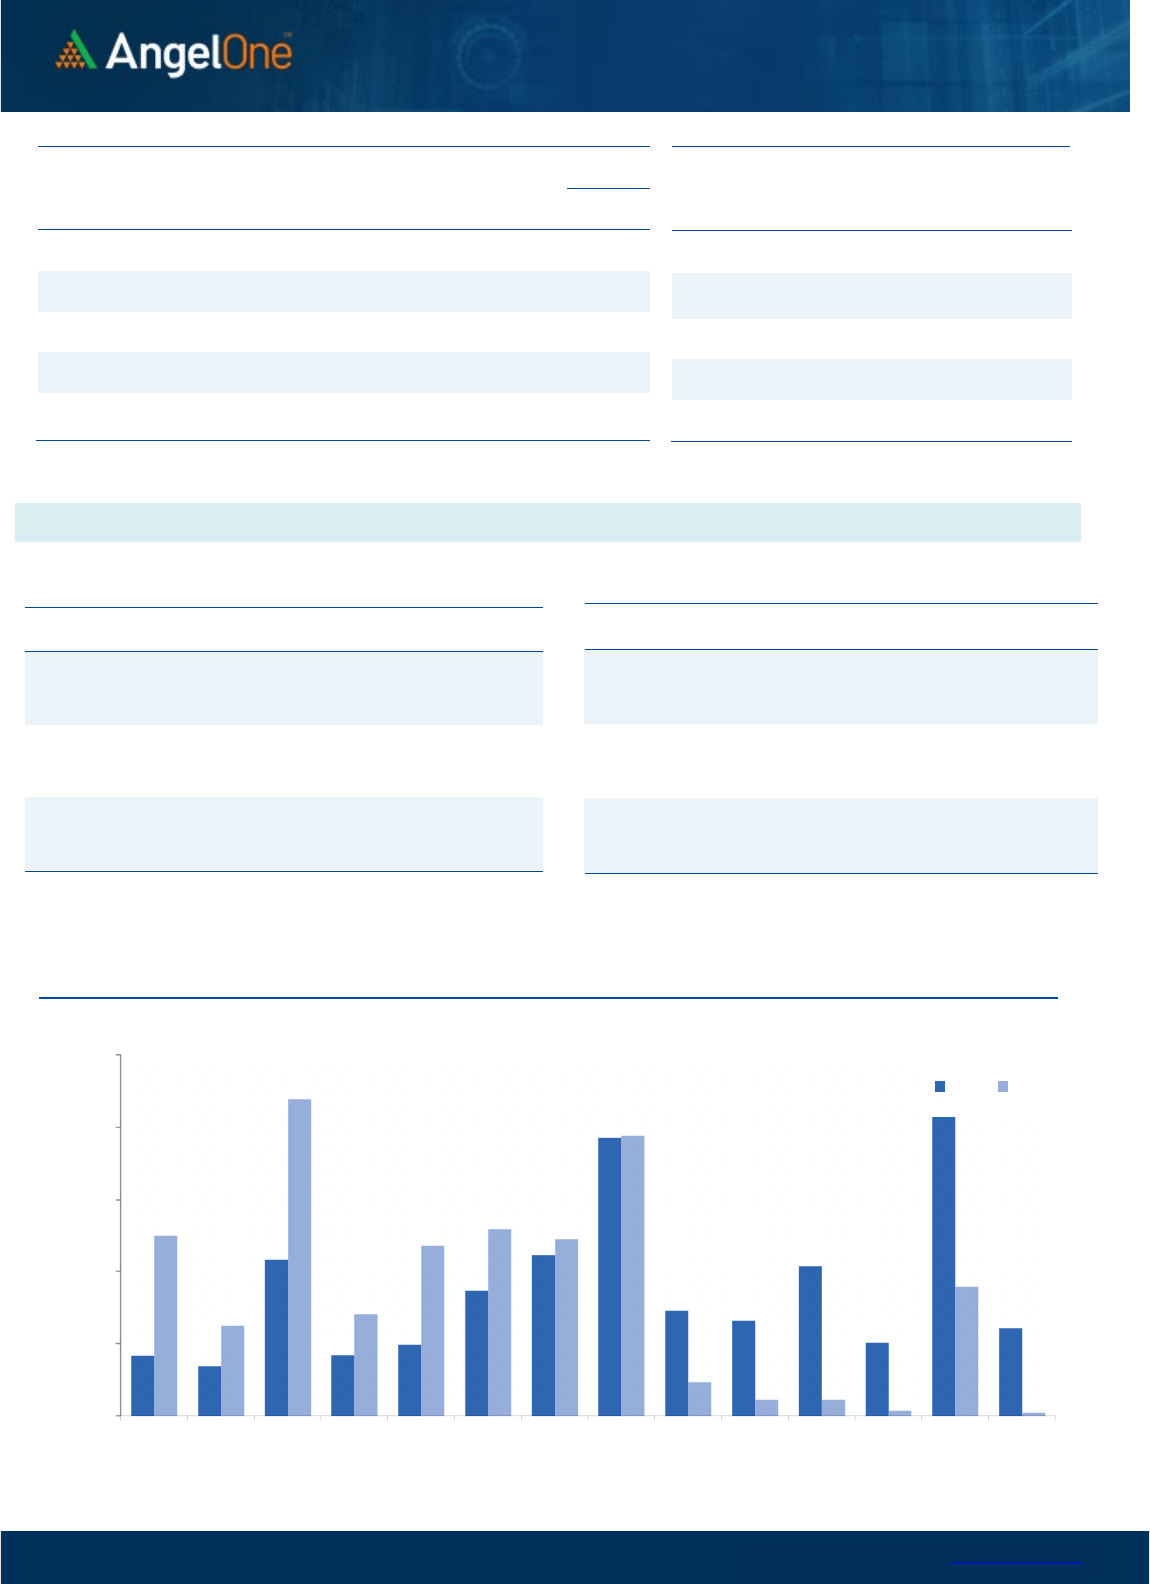
Nifty Bank Outlook (38237)
On Monday, Bank Nifty started on a flat note that was followed by an
immediate dip; this dip however got bought into as there was strong
positive traction seen in heavyweight private banks. The positive
momentum continued throughout the session, to eventually end with
gains of 0.84% at 38237.
The last few sessions were very tiring for the bulls if we consider it
from the banking space point of view and on Monday as well,
initially, there was weakness following the sell-off in PSU heavyweight
SBIN however this was compensated by the rally in the private bank
space. Now, bulls seem to be back in action with the recent congestion
zone being broken on the higher side. However, one should avoid
being complacent as the indicators are in a deep overbought zone and
we have approached the supply zone from where we had seen a sharp
sell-off in April month. The resistance for this zone is between 38500
- 38760 and it would be crucial to see how markets react in this range.
On the flip side, 38000 - 37880 is the immediate support. We sense,
that traders should focus on a stock-specific approach that is likely to
give out performing opportunities on both sides of the trend.
Key Levels
Support 1 – 38000 Resistance 1 – 38500
Support 2 – 37880 Resistance 2 – 38760
Exhibit 1: Nifty Daily Chart
Exhibit 2: Nifty Bank
Daily
Chart
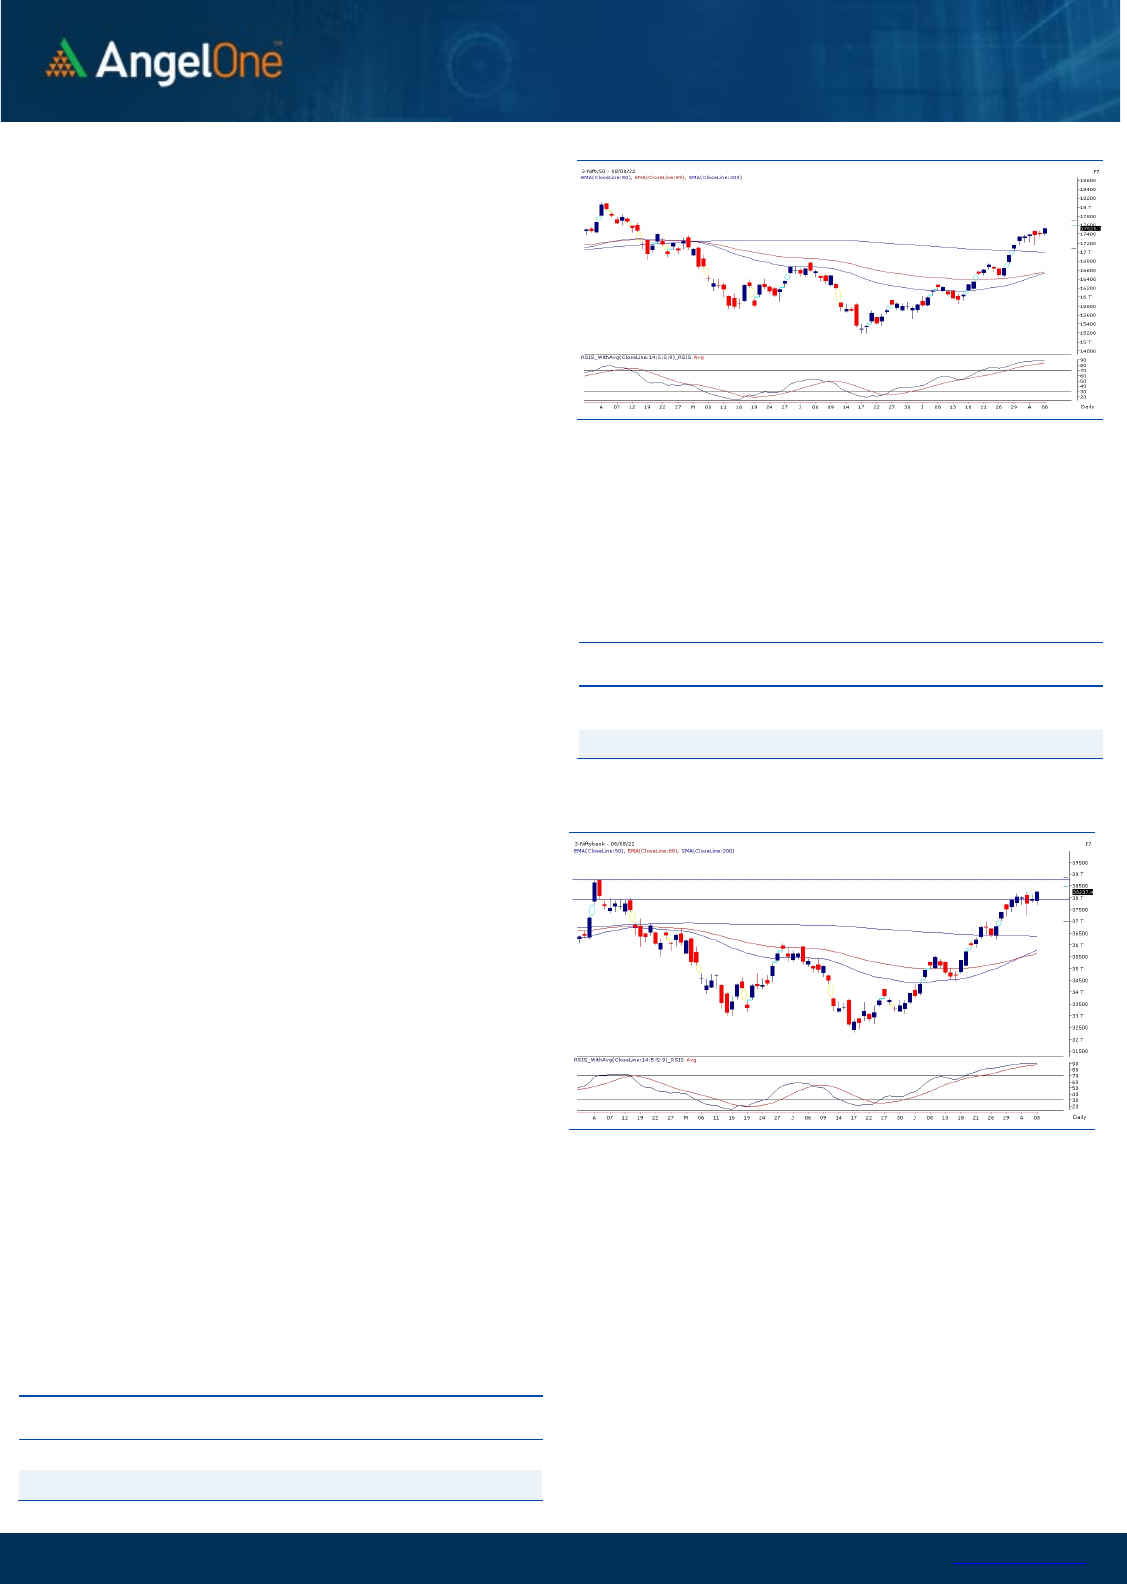
Sensex (58853) / Nifty (17525)
The global cues were muted Monday morning and hence, our markets
too started the week on a flat note. After a small dip in the initial trades,
the buying resumed at lower levels. In fact, the momentum kept on
accelerating as the day progressed to close almost at the highest point
of the day. Eventually, the heavyweights led rally resulted in Nifty
reclaiming the 17500 mark on a closing basis, highest level since April
11.
Barring previous Monday, we witnessed some consolidation in the
following sessions. In fact, we had a reality test on Thursday to retest
sub-17200 levels. Fortunately, all declines were successfully bought
into and on Monday with the help of heavyweights chipping in, the
benchmark index Nifty managed to continue its northward trajectory.
The undertone is strongly bullish and now next level to watch out for is
17650. On the flipside, the immediate support is placed in the vicinity
of 17400 – 17350. Traders can continue with their buy on decline
strategy but one should avoid being complacent as a momentum
trader. Markets are continuing with their vertical move and in such
scenario, we do not get any swing lows which generally be referred as
strong base.
In such scenarios, ideally, previous day’s low should be considered a
key support on a closing basis. Till the time, it remains intact, one
should keep on riding the move. As we alluded to in the above
section, Monday’s rally was mainly propelled by the leaders and
midcaps were a bit quiet; but in our sense, midcaps would also
resume their buying momentum soon. Hence, one can keep focusing
on such potential movers going ahead.
Key Levels
Support 1 – 17400 Resistance 1 – 17600
Support 2 – 17350 Resistance 2 – 17650

www.angelone.in
Technical & Derivatives Report
Aug 10, 2022
View
We have witnessed a promising start of the
truncated week, wherein the benchmark index
Nifty50 reclaimed the 17500 with some authority.
FIIs were net buyers in the cash market segment to
the tune of Rs. 1450 crores. Simultaneously, in Index
futures, they bought worth Rs. 138 crores with an
increase in open interest, indicating long formation.
Looking at the overall F&O data, we have witnessed
long addition in both indices at the start of the week.
On the options front, the major concentration of OI is
seen at 17400-17500 put strikes, which is likely to
cushion any correction in the near period. On the
contrary, 17600 call strike has seen piling up of OI
concentration followed by 17800 CE, which is likely to
act as immediate resistance for the index. Considering
the recent developments and price action, our market
is likely to remain upbeat, wherein any minor
correction could be utilized to add long positions. Also,
it is advisable to look for opportunities outside the
index and stay abreast with global developments.
Comments
The Nifty futures open interest has increased by
7.78%. and BANKNifty futures open interest has
increased by 12.36% as the market closed at 17525.10.
The Nifty Aug future closed with a premium of 32.65
point against a premium of 18.65 point in the last
trading session. The Sep series closed at a premium
of 95.30 point.
The INDIA VIX increased from 18.91 to 19.30. At the
same time, the PCR-OI of Nifty has increased from
1.05 to 1.30.
Few of the liquid counters where we have seen high
cost of carry are ALKEM, HAL, BALKRISIND, GAIL
and MANAPPURAM.
Historical Volatility
SCRIP HV
IDEA 85.20
IBULHSGFIN 76.16
RBLBANK 72.51
HINDCOPPER 66.07
ZEEL 65.93
Nifty Vs OI
16000
16200
16400
16600
16800
17000
17200
17400
17600
17800
18000
10,000
10,500
11,000
11,500
12,000
12,500
13,000
13,500
14,000
14,500
15,000
7/20 7/22 7/26 7/28 8/1 8/4 8/8
Openinterest Nifty
OI
Gainers
SCRIP OI
OI
CHG. (%)
PRICE
PRICE
CHG. (%)
HINDCOPPER 13695500 16.03 111.05 6.59
INDIACEM 11608700 14.83 195.80 2.46
ALKEM 486600 14.76 2984.45 -5.77
TATACHEM 5454000 10.09 957.00 0.91
COALINDIA 37304400 9.60 215.40 3.89
BALKRISIND 2007900 8.21 2149.95 -0.59
AMARAJABAT 6711000 6.20 510.45 1.11
INDHOTEL 26891092 5.72 270.85 0.61
OI Losers
SCRIP OI
OI
CHG. (%)
PRICE
PRICE
CHG. (%)
HINDPETRO 20552400 -12.24 239.05 -4.62
INDIAMART 263850 -8.43 4489.55 -1.88
DRREDDY 2368125 -5.84 4223.30 1.36
NAM-INDIA 2360000 -5.81 305.25 1.35
BALRAMCHIN 10081600 -5.55 352.50 0.64
VOLTAS 4028000 -5.28 982.30 1.42
MANAPPURAM 28032000 -4.85 107.70 -0.74
BAJAJ-AUTO 1855750 -4.77 4022.60 0.69
Put-Call Ratio
SCRIP PCR (OI) PCR (VOL)
NIFTY 1.30 0.84
BANKNIFTY 1.21 0.85
RELIANCE 0.53 0.40
ICICIBANK 0.90 0.51
INFY 0.78 0.84
www.angelone.in
Technical & Derivatives Report
Aug 10, 2022
Note: Above mentioned Bullish or Bearish Spreads in Nifty (Aug Series) are given as an information and not as a recommendation.
Nifty Spot =
17,
525
.
1
0
FII Statistics for
August
0
8
, 2022
Detail Buy
Contracts
Open
Interest
Value
(in Cr.)
Sell
Net
CHANGE
INDEX
FUTURES
2566.95 2429.15 137.80
156542 14185.58 7.42
INDEX
OPTIONS
698027.34 692697.28 5330.06
1272700 114241.91 20.68
STOCK
FUTURES
9758.31 9321.56 436.75
2145265 147413.09 (0.02)
STOCK
OPTIONS
7610.02 7768.78 (158.76) 121776 8558.80 6.13
Total 717962.62
712216.77
5745.85
3696283
284399.38
6.81
Turnover on
August
0
8
, 2022
Instrument
No. of
Contracts
Turnover
( in Cr. )
Change
(%)
Index Futures
326393 29769.23 -11.36
Index Options
94868447 8530158.87 19.81
Stock Futures
734372 52622.99 -12.90
Stock Options
3003208 224816.70 -1.83
Total
30,03,208 224816.70 18.73
Bull-Call Spreads
Action Strike Price Risk Reward BEP
Buy
17500 282.00
55.35
44.65
17555.35
Sell
17600 226.65
Buy
17500 282.00
104.95
95.05
17604.95
Sell
17700 177.05
Buy
17600 226.65
49.60 50.40 17649.60
Sell
17700 177.05
Bear
-
Put Spreads
Action Strike Price Risk Reward BEP
Buy 17500 224.25
38.50
61.50
17461.50
Sell
17400 185.75
Buy 17500 224.25
70.90
129.10
17429.10
Sell 17300 153.35
Buy
17400 185.75
32.40 67.60 17367.60
Sell
17300 153.35
Nifty Put
-
Call Analysis
,0
500,000
1000,000
1500,000
2000,000
2500,000
16800 16900 17000 17100 17200 17300 17400 17500 17600 17700 17800 17900 18000 18100
Call Put

www.angelone.in
Technical & Derivatives Report
Aug 10, 2022
`
Daily Pivot Levels for Nifty Constituents
Scrips
S2
S1
PIVOT
R1 R2
ADANIPORTS 779 790
807
818
834
APOLLOHOSP 4,333 4,380
4,427 4,475 4,522
ASIANPAINT
3,417
3,438
3,457 3,478
3,498
AXISBANK
721
733
740
753
760
BAJAJ-AUTO
3,981
4,002
4,021
4,042
4,061
BAJFINANCE
7,201
7,271
7,335 7,405
7,469
BAJAJFINSV
14,839
15,185
15,387
15,733
15,935
BPCL 315 321
325
330
335
BHARTIARTL
694
699
704
710
715
BRITANNIA 3,560 3,596
3,649 3,685 3,738
CIPLA 1,016 1,023
1,031
1,038
1,046
COALINDIA
204
210
213
219
222
DIVISLAB 3,847 3,892
3,921
3,966
3,995
DRREDDY
4,128
4,175
4,205 4,253
4,282
EICHERMOT 3,038 3,078
3,111
3,151
3,184
GRASIM
1,575
1,587
1,597
1,609
1,619
HCLTECH
943
955
961
973
979
HDFCBANK 1,414 1,438
1,451
1,475
1,489
HDFCLIFE 531 534
539
542
546
HDFC
2,319
2,357
2,379
2,416 2,439
HEROMOTOCO
2,690
2,714
2,754
2,778
2,817
HINDALCO
411
416
419 425
428
HINDUNILVR
2,613
2,632
2,645 2,664
2,677
ICICIBANK
826
831
837
842
848
INDUSINDBK
1,023
1,037
1,047
1,061
1,071
INFY
1,586
1,603
1,612 1,629
1,638
ITC
308
311
312
315
316
JSW STEEL
656
662
669
676
683
KOTAKBANK
1,804
1,824
1,837
1,857
1,870
LT
1,776
1,803
1,817
1,844
1,859
M&M
1,229
1,253
1,266
1,290
1,304
MARUTI 8,763 8,843
8,920 9,000
9,077
NESTLEIND
19,293
19,473
19,730
19,910
20,167
NTPC 153 156
158 161
163
ONGC 134 135
136
138
139
POWERGRID 218 220
223
225
228
RELIANCE 2,508 2,538
2,561
2,590
2,613
SBILIFE
1,243
1,257
1,265
1,278
1,286
SHREECEM
20,888
21,042
21,157
21,311
21,426
SBIN
509
515
519
525
530
SUNPHARMA
901
906
913
917
924
TCS 3,320 3,347
3,363
3,390
3,406
TATACONSUM
775 782
788
795 801
TATAMOTORS 461 465
468
472
476
TATASTEEL
106
107
107
108
109
TECHM 1,041 1,049
1,057
1,065
1,073
TITAN
2,410
2,429
2,452 2,470 2,493
ULTRACEMCO
6,572
6,625
6,700
6,753
6,828
UPL
731
740
746
755
761
WIPRO
430
433
438
441
446

www.angelone.in
Technical & Derivatives Report
Aug 10, 2022
*
Technical and Derivatives Team:
Sameet Chavan Chief Analyst – Technical & Derivatives sameet.chavan@angelone.in
Sneha Seth Senior Analyst – Technical & Derivatives sneha.seth@angelone.in
Rajesh Bhosale Technical Analyst rajesh.bhosle@angelone.in
Osho Krishan Senior Analyst – Technical & Derivatives osho.krishan@angelone.in
Research Team Tel: 022 – 39357600 (Extn. 6844) Website: www.angelone.in
For Technical Queries E-mail: technicalresearch-cso@angelone.in
For Derivatives Queries E-mail: derivatives.desk@angelone.in
DISCLAIMER
Angel One Limited (hereinafter referred to as “Angel”) is a registered Member of National Stock Exchange of India Limited, Bombay
Stock Exchange Limited and Metropolitan Stock Exchange Limited. It is also registered as a Depository Participant with CDSL and
Portfolio Manager and investment advisor with SEBI. It also has registration with AMFI as a Mutual Fund Distributor. Angel One
Limited is a registered entity with SEBI for Research Analyst in terms of SEBI (Research Analyst) Regulations, 2014 vide registration
number INH000000164. Angel or its associates has not been debarred/ suspended by SEBI or any other regulatory authority for
accessing /dealing in securities Market.
This document is solely for the personal information of the recipient, and must not be singularly used as the basis of any investment
decision. Nothing in this document should be construed as investment or financial advice. Each recipient of this document should
make such investigations as they deem necessary to arrive at an independent evaluation of an investment in the securities of the
companies referred to in this document (including the merits and risks involved), and should consult their own advisors to determine
the merits and risks of such an investment.
Angel or its associates or research analyst or his relative may have actual/beneficial ownership of 1% or more in the securities of
the subject company at the end of the month immediately preceding the date of publication of the research report. Neither Angel or
its associates nor Research Analysts or his relative has any material conflict of interest at the time of publication of research report.
Angel or its associates might have received any compensation from the companies mentioned in the report during the period
preceding twelve months from the date of this report for services in respect of managing or co-managing public offerings, corporate
finance, investment banking or merchant banking, brokerage services or other advisory service in a merger or specific transaction
in the normal course of business. Angel or its associates did not receive any compensation or other benefits from the companies
mentioned in the report or third party in connection with the research report. Neither Angel nor its research analyst entity has been
engaged in market making activity for the subject company.
Reports based on technical and derivative analysis center on studying charts of a stock's price movement, outstanding positions and
trading volume, as opposed to focusing on a company's fundamentals and, as such, may not match with a report on a company's
fundamentals. Investors are advised to refer the Fundamental and Technical Research Reports available on our website to evaluate
the contrary view, if any.
The information in this document has been printed on the basis of publicly available information, internal data and other reliable
sources believed to be true, but we do not represent that it is accurate or complete and it should not be relied on as such, as this
document is for general guidance only. Angel One Limited or any of its affiliates/ group companies shall not be in any way responsible
for any loss or damage that may arise to any person from any inadvertent error in the information contained in this report. Angel One
Limited has not independently verified all the information contained within this document. Accordingly, we cannot testify, nor make
any representation or warranty, express or implied, to the accuracy, contents or data contained within this document. While Angel
One Limited endeavors to update on a reasonable basis the information discussed in this material, there may be regulatory,
compliance, or other reasons that prevent us from doing so.
This document is being supplied to you solely for your information, and its contents, information or data may not be reproduced,
redistributed or passed on, directly or indirectly.
Neither Angel One Limited, nor its directors, employees or affiliates shall be liable for any loss or damage that may arise from or in
connection with the use of this information. Angel or its associates or Research Analyst or his relative might have financial interest
in the subject company. Research analyst has not served as an officer, director or employee of the subject company.
