March 10, 2023
www.angelone.in
Technical & Derivatives Report
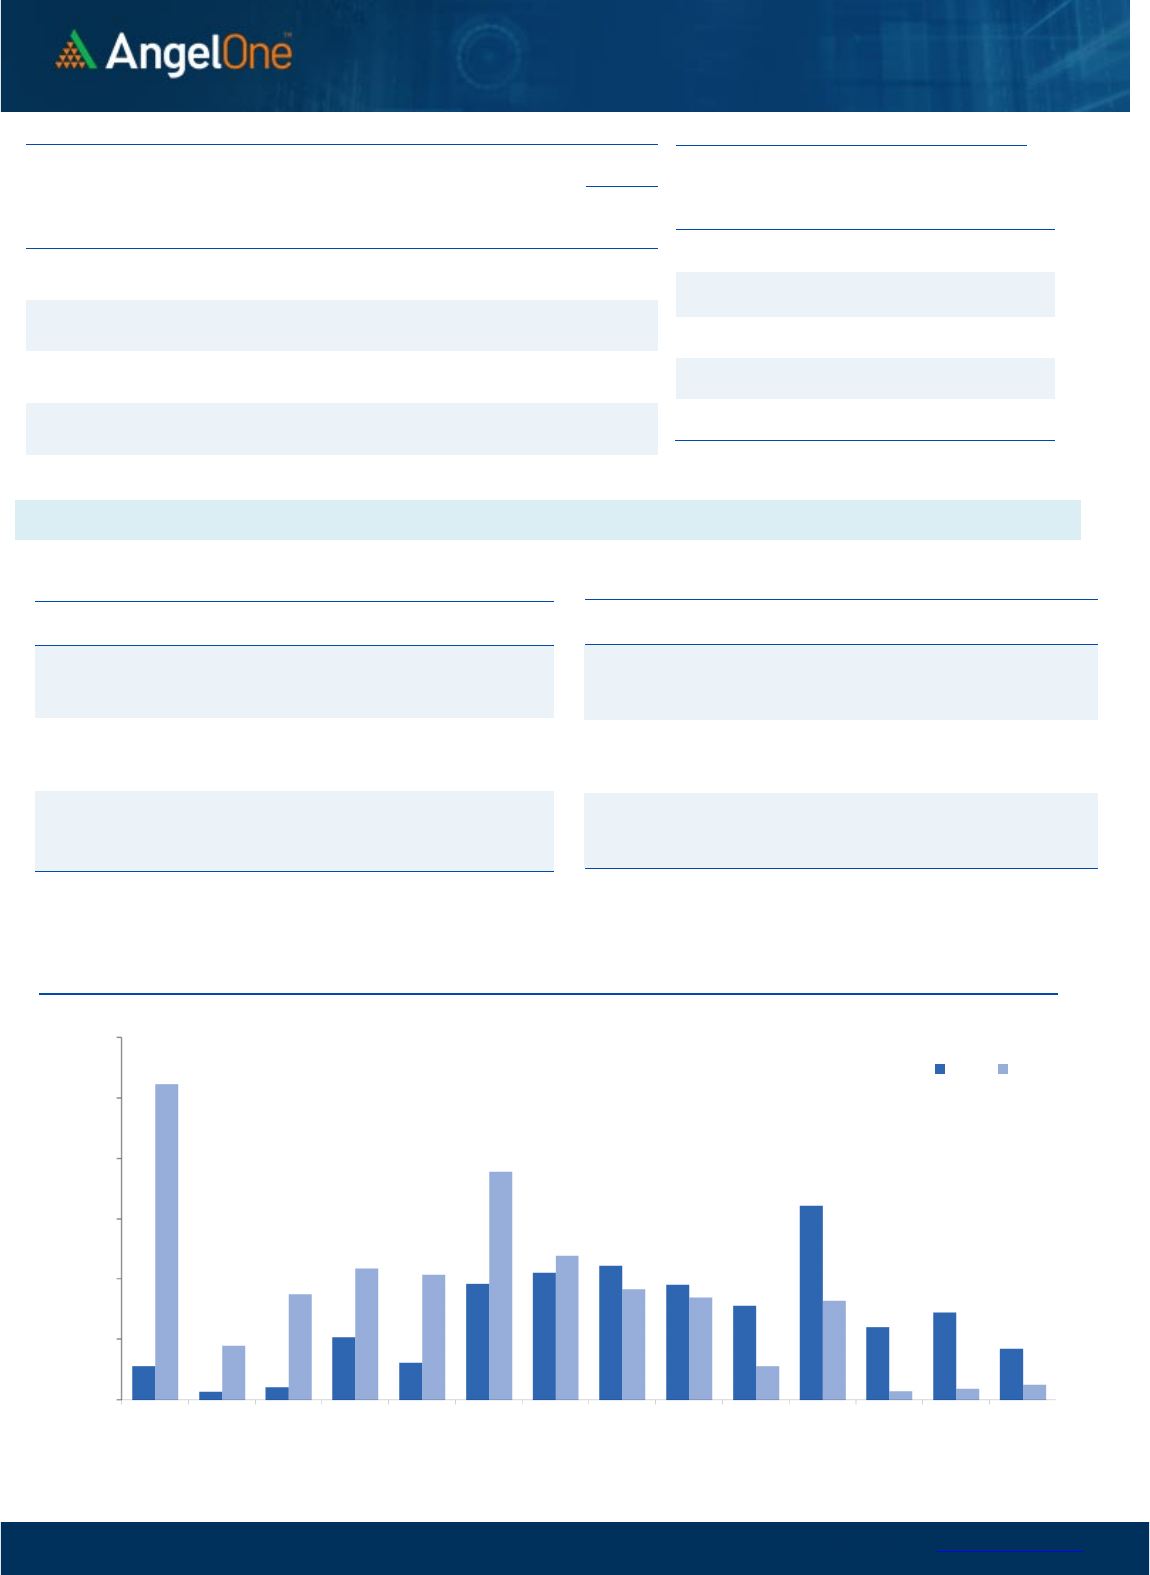
Nifty Bank
Outlook (
41
25
7
)
Post Wednesday’s strong close, we began the weekly expiry
session above 41500 and saw follow-up buying to head towards
41650. However, like Monday’s session some tentativeness was
observed at higher levels which got aggravated as we progressed
to drag the banking index towards 41200. Eventually, we
concluded the day with a cut of 0.77% to the previous day’s close.
If we look back in the February series, specifically in the midst, the
banking index spent almost two weeks in the vicinity of 41000-
42000 and now it’s the third week wherein the index is hovering
around the same zone. Considering the broader picture, we have
managed to conclude the session above the support zone
of 41000-41200 and above the rising trendline support mentioned
in the previous commentary. Hence, as long we manage to sustain
above key supports, we would use such dips to add longs in the
market. On the upside, considering the recent price action, 41600-
41700 remains a sturdy wall followed by 42000. Traders are
advised to keep a close tab on the above-mentioned levels and
avoid any positional bearish trades.
Key Levels
Support 1 – 41100 Resistance 1 – 41600
Support 2 – 41000 Resistance 2 – 42000
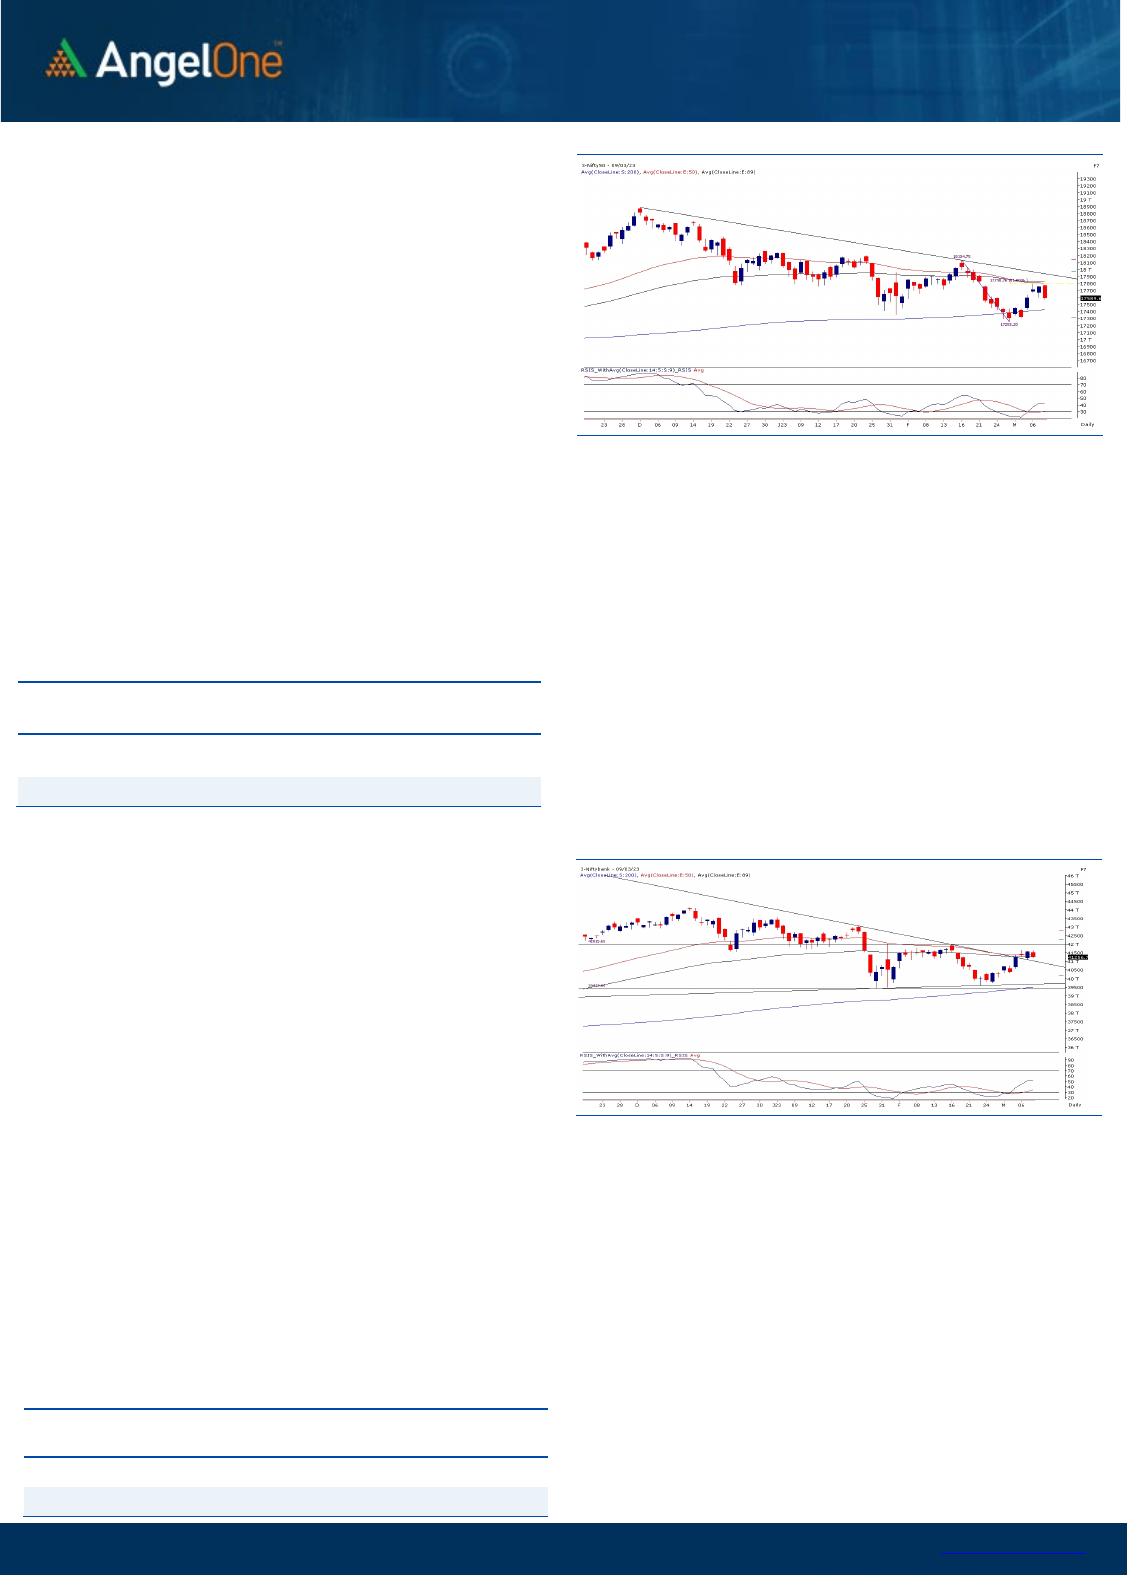
Exhibit 1: Nifty Daily Chart
Exhibit 2: Nifty Bank Daily Chart
Sensex (
59806
) / Nifty (
1
7
590
)
Our markets witnessed a marginally positive opening, however right
from the word go prices started to slide lower forming an open high
kind of scenario. During the midst, there was a mild bounce back
that was inferior to the Bank Nifty. Eventually, this bounce as well
got sold into as one more round of profit booking resulted in Nifty
ending below 17600 with a loss of around nine-tenths of a percent.
It was a disappointing session for the bulls as, despite some recent
positive developments, the markets are lacking sustenance at
higher levels. The culprit remains heavyweights, as one or
the another from them continues to comfort in the back seat;
yesterday the major draggers were Reliance and Auto counters.
Nifty has now given up initial weekly gains and is now placed at a
neutral juncture. Going ahead, 17500 followed by 200SMA placed
at 17430 would be considered sacrosanct support and we remain
hopeful that buying will re-emerge at lower levels. However, since
we are not seeing follow-up buying traders need to avoid undue risk
and need to be very fussy in their stock selection.
Key Levels
Support 1 – 17500 Resistance 1 – 17700
Support 2 – 17430 Resistance 2 – 17800
On the flip side, the 61.8% retracement level (17800) that we
have been highlighting since the last couple of sessions remains
a stiff resistance, and for the trend to technically turn into
positive need to close above it with some authority; before that
17700 should also be considered as immediate resistance. The
banking space remains a key ray of hope for the bulls as the bank
index continues to show resilience and has been well sustained
above the recent bullish breakout levels. Also, one needs to
keep a tab on global developments as some positive
developments there could trigger optimism back in our markets.

www.angelone.in
Technical & Derivatives Report
March 10, 2023
View
Our market lacked sustenance at higher grounds and
slipped to pare down the overall weekly gains. The
benchmark index Nifty50 shed nearly a percent to
settle a tad below the 17600 level.
FIIs were net sellers in the cash market segment to
the tune of Rs. 562 crores. Simultaneously, in Index
futures, they sold worth Rs. 2253 crores with an
increase in open interest, indicating short addition.
Looking at the F&O data, we witnessed short
formation in both key indices on the weekly expiry
session. On the options front, the 17600 put strike
holds a significant OI concentration, followed by
17500 PE, indicating nearby support for Nifty. On the
higher end, the 17700-call strike has the maximum
OI concentration, indicating the immediate hurdle.
Meanwhile, the stronger hands have added shorts in
the system resulting in a plunge to ‘Long Short Ratio’
to 20% from 25%. Considering the recent price
action, we would advocate avoiding aggressive bets
in the index and being fussy with stock selection.
Comments
The Nifty futures open interest has increased by 7.15%
and Bank Nifty futures open interest has increased by
1.64% as the market closed at 17589.60.
The Nifty March future closed with a premium of 55.50
point against a premium of 40.15 point in the last
trading session. The April series closed at a premium of
160.15 point.
The INDIA VIX increased from 12.45 to 12.72. At the
same time, the PCR-OI of Nifty has decreased from 1.26
to 0.85.
Few of the liquid counters where we have seen high
cost of carry are M&M, SBILIFE, BALKRISIND, RELIANCE,
AND DIXON.
Historical Volatility
SCRIP HV
ADANIENT 94.54
IDEA 70.70
IBULHSGFIN 67.07
RBLBANK 63.66
ADANIPORTS 60.05
Nifty Vs OI
17200
17300
17400
17500
17600
17700
17800
17900
18000
18100
18200
4,000
6,000
8,000
10,000
12,000
14,000
16,000
2/15 2/17 2/22 2/24 2/28 3/2 3/6 3/9
Openinterest Nifty
OI Gainers
SCRIP OI
OI
CHG. (%)
PRICE
PRICE
CHG. (%)
GNFC 9360000 13.62 558.40 -2.40
CROMPTON 6054000 10.30 300.45 -2.33
RBLBANK 28285000 8.54 159.65 -3.55
TECHM 12103200 7.89 1060.00 -1.73
MPHASIS 2229150 6.62 2104.90 -2.22
RELIANCE 38906750 6.12 2359.30 -2.16
CUB 12795000 5.27 140.25 -0.95
MUTHOOTFIN 7936500 5.11 943.80 -0.48
OI Losers
SCRIP OI
OI
CHG. (%)
PRICE
PRICE
CHG. (%)
BALRAMCHIN 17600 -9.25 396.75 -0.71
HONAUT 22515 -4.94 35844.30 0.30
ABCAPITAL 34338600 -4.79 156.65 -0.85
GUJGASLTD 5295000 -4.64 514.00 1.10
TRENT 3610000 -4.22 1335.00 -0.46
SHRIRAMFIN 3943200 -3.83 1290.40 1.43
TORNTPOWER 3378000 -3.64 533.35 0.43
ATUL 145500 -3.58 6953.65 -0.26
Put-Call Ratio
SCRIP PCR (OI) PCR (VOL)
NIFTY 0.85 1.05
BANKNIFTY 0.88 1.02
RELIANCE 0.57 0.63
ICICIBANK 0.63 0.57
INFY 0.46 0.39
www.angelone.in
Technical & Derivatives Report
March 10, 2023
Note: Above mentioned Bullish or Bearish Spreads in Nifty (March Series) are given as an information and not as a recommendation.
Nifty Spot =
1
7
589
.
6
0
0900
Lot Size = 75
FII Statistics for
March 0
9
, 202
3
Detail Buy
Contracts
Open
Interest
Value
(in Cr.)
Sell
Net
CHANGE
INDEX
FUTURES
2545.71 4799.08 (2253.37) 174408 16103.79 11.23
INDEX
OPTIONS
2430814.53 2422159.78 8654.75
1733886 156741.64 (38.40)
STOCK
FUTURES
6791.68 9182.53 (2390.85) 2165261 144152.04 0.64
STOCK
OPTIONS
8805.64 8990.08 (184.44) 153058 10244.53 9.65
Total 2448957.56
2445131.47
3826.09
4226613
327242.00
(19.69)
Turnover
on
March
0
9
, 202
3
Instrument
No. of
Contracts
Turnover
( in Cr. )
Change
(%)
Index Futures
287272 27386.44
-14.94
Index Options
372884868
51869.90
12.01
Stock Futures
627837 41770.16
-7.86
Stock Options
2605038 3200.12 -13.20
Total
26,05,038 3200.12 -2.59
Bull-Call Spreads
Action Strike Price Risk Reward BEP
Buy
17600 214.00
54.50
45.50
17654.50
Sell
17700 159.50
Buy
17600 214.00
98.35
101.65
17698.35
Sell
17800 115.65
Buy
17700 159.50
43.85 56.15 17743.85
Sell
17800 115.65
Bear-Put Spreads
Action Strike Price Risk Reward BEP
Buy
17600 169.05
36.50
63.50
17563.50
Sell 17500 132.55
Buy 17600 169.05
65.70
134.30
17534.30
Sell
17400 103.35
Buy
17500 132.55
29.20 70.80 17470.80
Sell 17400 103.35
Nifty Put-Call Analysis
,0
1000,000
2000,000
3000,000
4000,000
5000,000
6000,000
17000 17100 17200 17300 17400 17500 17600 17700 17800 17900 18000 18100 18200 18300
Call Put

www.angelone.in
Technical & Derivatives Report
March 10, 2023
`
Daily
Pivot Levels for Nifty Constituents
Scrips
S2
S1
PIVOT
R1
R2
ADANIENT
1,812
1,883
1,976
2,046
2,139
ADANIPORTS 669 683
700
714
731
APOLLOHOSP
4,294
4,356
4,447
4,509
4,600
ASIANPAINT
2,819
2,836
2,854
2,872
2,890
AXISBANK 856 862
868
874
880
BAJAJ-AUTO
3,780
3,797
3,818
3,835
3,856
BAJFINANCE
5,794
5,848
5,944
5,998
6,094
BAJAJFINSV
1,332
1,342
1,361
1,371
1,389
BPCL 322 323
325
327
328
BHARTIARTL 755 764
780
789
804
BRITANNIA
4,231
4,261
4,306
4,336
4,380
CIPLA 865 874
885
893
905
COALINDIA 222 223
225
227
228
DIVISLAB
2,763
2,787
2,827
2,850
2,891
DRREDDY
4,330
4,356
4,397
4,422
4,464
EICHERMOT
3,092
3,119
3,170
3,197
3,247
GRASIM
1,575
1,588
1,599
1,612
1,622
HCLTECH
1,106
1,112
1,119
1,124
1,132
HDFCBANK
1,616
1,623
1,635
1,642
1,654
HDFCLIFE
486
489
493
495
499
HDFC
2,644
2,655
2,674
2,685
2,704
HEROMOTOCO
2,407
2,426
2,458
2,477
2,509
HINDALCO 401 405
412
416
422
HINDUNILVR
2,435
2,448
2,470
2,483
2,505
ICICIBANK 844 850
860
866
876
INDUSINDBK
1,151
1,161
1,172
1,181
1,192
INFY
1,461
1,471
1,484
1,494
1,508
ITC 381 384
389
392
397
JSW STEEL 662 671
682
691
701
KOTAKBANK
1,694
1,705
1,725
1,736
1,756
LT
2,160
2,177
2,188
2,204
2,215
M&M
1,213
1,230
1,263
1,280
1,312
MARUTI
8,401
8,472
8,604
8,675
8,807
NESTLEIND
18,366
18,451
18,515
18,600
18,664
NTPC 176 178
180
182
184
ONGC 154 155
157
158
160
POWERGRID 222 224
227
229
232
RELIANCE
2,315
2,337
2,377
2,399
2,439
SBILIFE
1,065
1,081
1,108
1,124
1,151
SBIN 553 556
561
564
569
SUNPHARMA 941 947
953
959
965
TCS
3,297
3,317
3,351
3,371
3,405
TATACONSUM
699 704
713
719
728
TATAMOTORS 424 428
435
439
446
TATASTEEL 107 107
108
109
110
TECHM
1,041
1,050
1,067
1,076
1,093
TITAN
2,337
2,353
2,380
2,396
2,423
ULTRACEMCO
7,156
7,200
7,250
7,294
7,345
UPL 703 708
715
720
728
WIPRO 387 389
391
393
395

www.angelone.in
Technical & Derivatives Report
March 10, 2023
*
Technical and Derivatives Team:
Sameet Chavan Chief Analyst – Technical & Derivatives sameet.chavan@angelone.in
Sneha Seth Senior Analyst – Technical & Derivatives sneha.seth@angelone.in
Rajesh Bhosale Technical Analyst rajesh.bhosle@angelone.in
Osho Krishan Senior Analyst – Technical & Derivatives osho.krishan@angelone.in
Research Team Tel: 022 – 39357600 Website: www.angelone.in
For Technical Queries E-mail: technicalresearch-cso@angelone.in
For Derivatives Queries E-mail: derivatives.desk@angelone.in
DISCLAIMER
Angel One Limited (hereinafter referred to as “Angel”) is a registered Member of National Stock Exchange of India Limited, Bombay Stock Exchange
Limited and Metropolitan Stock Exchange Limited. It is also registered as a Depository Participant with CDSL and Portfolio Manager and investment
advisor with SEBI. It also has registration with AMFI as a Mutual Fund Distributor. Angel One Limited is a registered entity with SEBI for Research
Analyst in terms of SEBI (Research Analyst) Regulations, 2014 vide registration number INH000000164. Angel or its associates has not been
debarred/ suspended by SEBI or any other regulatory authority for accessing /dealing in securities Market.
This document is solely for the personal information of the recipient, and must not be singularly used as the basis of any investment decision.
Nothing in this document should be construed as investment or financial advice. Each recipient of this document should make such investigations
as they deem necessary to arrive at an independent evaluation of an investment in the securities of the companies referred to in this document
(including the merits and risks involved), and should consult their own advisors to determine the merits and risks of such an investment.
Angel or its associates or research analyst or his relative may have actual/beneficial ownership of 1% or more in the securities of the subject
company at the end of the month immediately preceding the date of publication of the research report. Neither Angel or its associates nor
Research Analysts or his relative has any material conflict of interest at the time of publication of research report.
Angel or its associates might have received any compensation from the companies mentioned in the report during the period preceding twelve
months from the date of this report for services in respect of managing or co-managing public offerings, corporate finance, investment banking or
merchant banking, brokerage services or other advisory service in a merger or specific transaction in the normal course of business. Angel or its
associates did not receive any compensation or other benefits from the companies mentioned in the report or third party in connection with the
research report. Neither Angel nor its research analyst entity has been engaged in market making activity for the subject company.
Reports based on technical and derivative analysis center on studying charts of a stock's price movement, outstanding positions and trading
volume, as opposed to focusing on a company's fundamentals and, as such, may not match with a report on a company's fundamentals. Investors
are advised to refer the Fundamental and Technical Research Reports available on our website to evaluate the contrary view, if any.
The information in this document has been printed on the basis of publicly available information, internal data and other reliable sources believed
to be true, but we do not represent that it is accurate or complete and it should not be relied on as such, as this document is for general guidance
only. Angel One Limited or any of its affiliates/ group companies shall not be in any way responsible for any loss or damage that may arise to any
person from any inadvertent error in the information contained in this report. Angel One Limited has not independently verified all the information
contained within this document. Accordingly, we cannot testify, nor make any representation or warranty, express or implied, to the accuracy,
contents or data contained within this document. While Angel One Limited endeavors to update on a reasonable basis the information discussed
in this material, there may be regulatory, compliance, or other reasons that prevent us from doing so.
This document is being supplied to you solely for your information, and its contents, information or data may not be reproduced, redistributed or
passed on, directly or indirectly.
Neither Angel One Limited, nor its directors, employees or affiliates shall be liable for any loss or damage that may arise from or in connection
with the use of this information. Angel or its associates or Research Analyst or his relative might have financial interest in the subject company.
Research analyst has not served as an officer, director or employee of the subject company.
