DEC 09, 2022
www.angelone.in
Technical & Derivatives Report
xOOOOOOOO
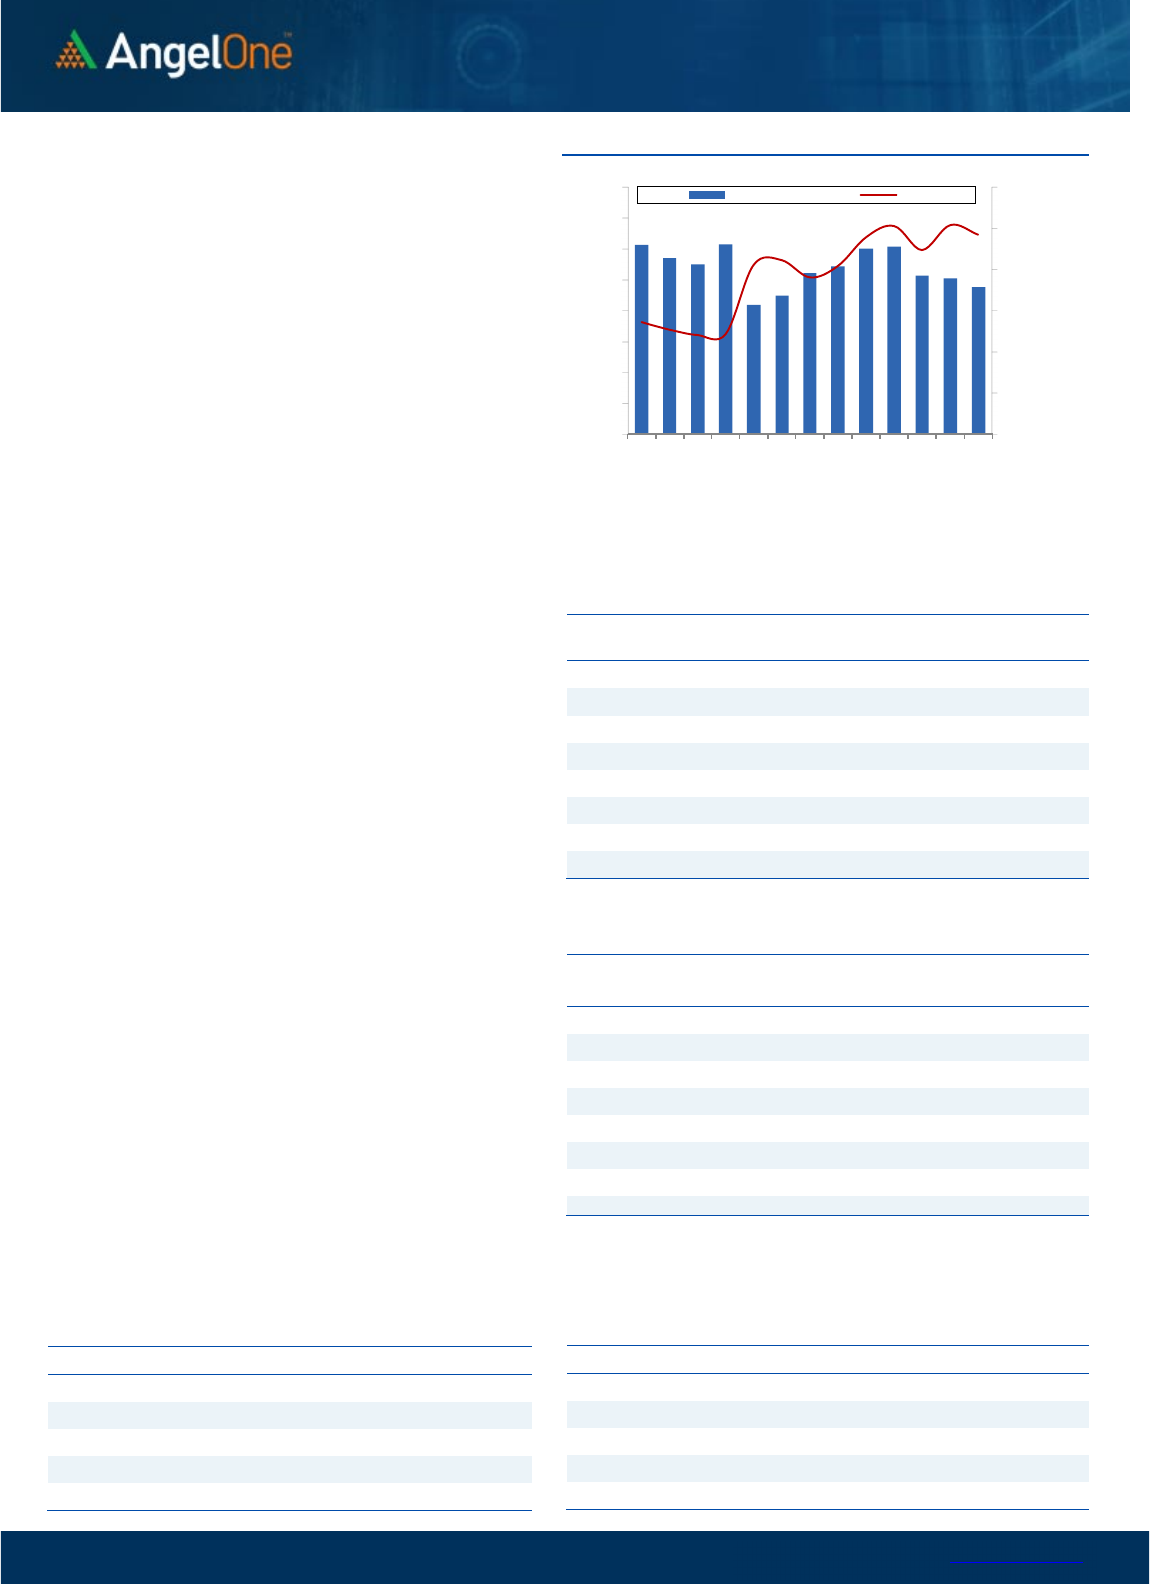
Nifty Bank
Outlook (
43
597
)
On the weekly expiry day, Bank Nifty started on a flat note however
as the day progressed there was buying seen in some of the
heavyweights that triggered positive momentum back in this
space. The Bank Nifty completely outperformed once again as the
benchmark index witnessed a lethargic session the bank nifty
ended up making new highs by closing with gains of more than a
percent tad below 43600.
In our yesterday's report, we had mentioned that the intraday
range was getting squeezed and very soon range breakout can be
seen possibly on the upside. After the last few days of
consolidation, the momentum is back in this space, and considering
the chart structure of some of the heavyweights; we can expect a
further extension of this upmove. Merry run continues within the
PSU banking space as the PSU Bank Index was up around 4 percent
and some of the private banks as well showed strong traction. We
hence reiterate, to continue with stock-specific trades for
outperforming opportunities. As far as levels are concerned, 43350
- 43200 is seen as strong support whereas on the higher side 43900
- 44200 is seen as immediate resistance.
Key Levels
Support 1 – 43350 Resistance 1 – 43900
Support 2 – 43200 Resistance 2 – 44200
Exhibit 1: Nifty
Daily
Chart
Exhibit 2: Nifty Bank
Daily
Chart
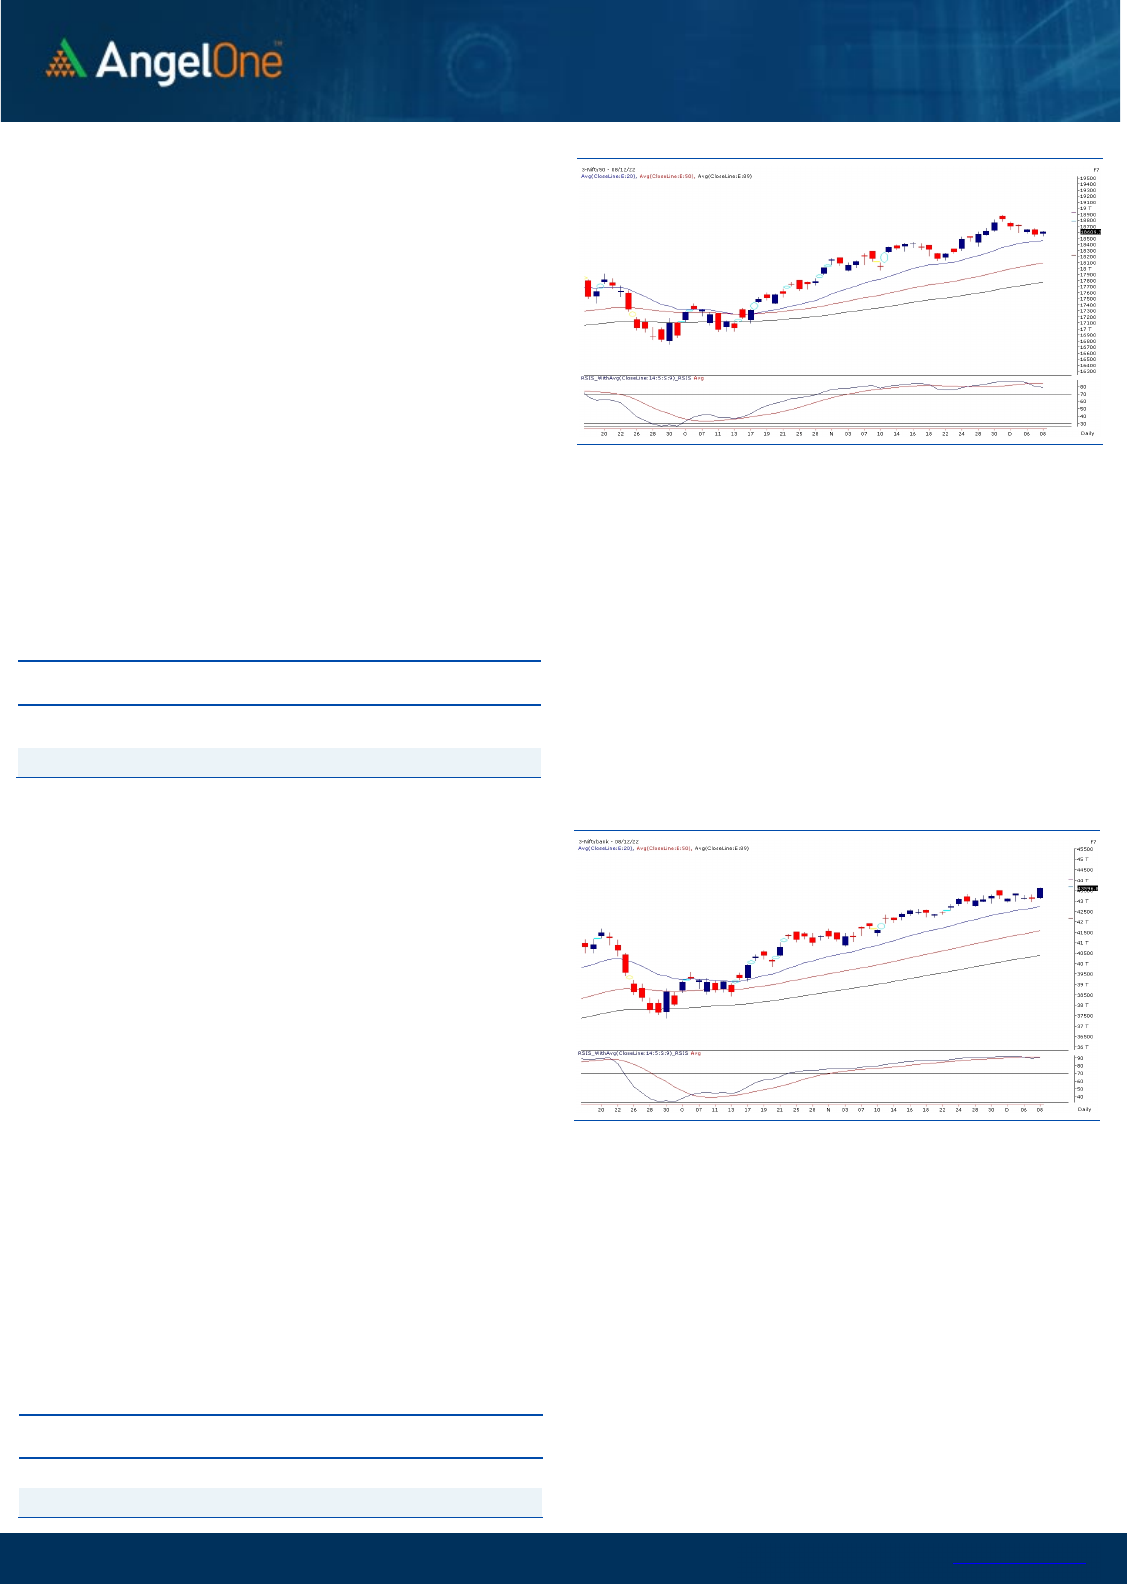
Sensex (62571) / Nifty (18609)
The Indian equity market started the day on a flat note tracking the
mixed global cues, wherein the benchmark index Nifty50 witnessed
a slender range-bound movement throughout the trading session.
The index managed to firmly withhold its crucial support on the
weekly expiry showcasing the resilience of the bulls in not giving up
easily. Amidst the intense tug of war, Nifty concluded the day with
a mere gain of 0.26 percent and settled a tad above 18600 levels.
We allude to our previous commentary of keeping the approach of
buying the dip until the sacrosanct support is firmly withheld, which
certainly aligns with the current situation. On the technical front,
there is no significant change in the chart structure except for the
narrowing down of the trading zone. As far as levels are concerned,
18500 is a critical level to watch for on the downside, and till it is
safeguarded, there is no sign of worry in the market. On the higher
end, a decisive closure above the 18700 zone could only bring back
the glee among the market participants.
Key Levels
Support 1 – 18500 Resistance 1 – 18700
Support 2 – 18400 Resistance 2 – 18780
Going forward, we reiterate to keep a close tab on the mentioned
levels and keep focusing on thematic movers for better trading
opportunities. There have been contributions across the board,
the significant benefactors that boosted the bullish sentiments
were from the Banking space, especially the PSU bank index
which soared to a new 52-week high. Looking at these
developments, the undertone is likely to remain upbeat, and any
intraday blip is expected to augur well for the bulls.
www.angelone.in
Technical & Derivatives Report
DEC 09, 2022
View
Like recent trend, the index continues to consolidate in
a slender range of less than 100 points. Eventually, due
to final hour buying interest we managed to conclude
the session tad above 18600 mark.
FIIs were net sellers in the cash market segment to
the tune of Rs. 1132 crores. Simultaneously, in Index
futures, they bought worth Rs. 770 crores with a
marginal rise in open interest, indicating blend of short
covering and long formation.
Banking index clearly outperformed the benchmark
index and added decent longs in futures segment. In
case of Nifty, we observed some unwinding. Stronger
hands too covered few shorts and added bullish bets
in index futures, resulting rise in Long Short Ratio
from 58% to 60%. For now, 18500-18550 remains a
strong support zone and as long we manage to sustain
above same biasness remains on the positive side.
Comments
The Nifty futures open interest has decreased by
1.48% and Bank Nifty futures open interest has
increased by 11.41% as the market closed at 18609.35.
The Nifty December future closed with a premium of
110.80 point against a premium of 128.60 point in the
last trading session. The January series closed at a
premium of 217.20 point.
The INDIA VIX decreased from 14.04 to 13.39. At the
same time, the PCR-OI of Nifty has increased to 0.76
from 0.85.
Few of the liquid counters where we have seen high
cost of carry are IDEA, COROMANDEL, FSL,
AMARAJABAT and GMRINFRA.
Historical Volatility
SCRIP HV
COROMANDEL 35.65
BANKBARODA 49.62
SUNPHARMA 29.58
BHARATFORG 41.79
RAMCOCEM 39.37
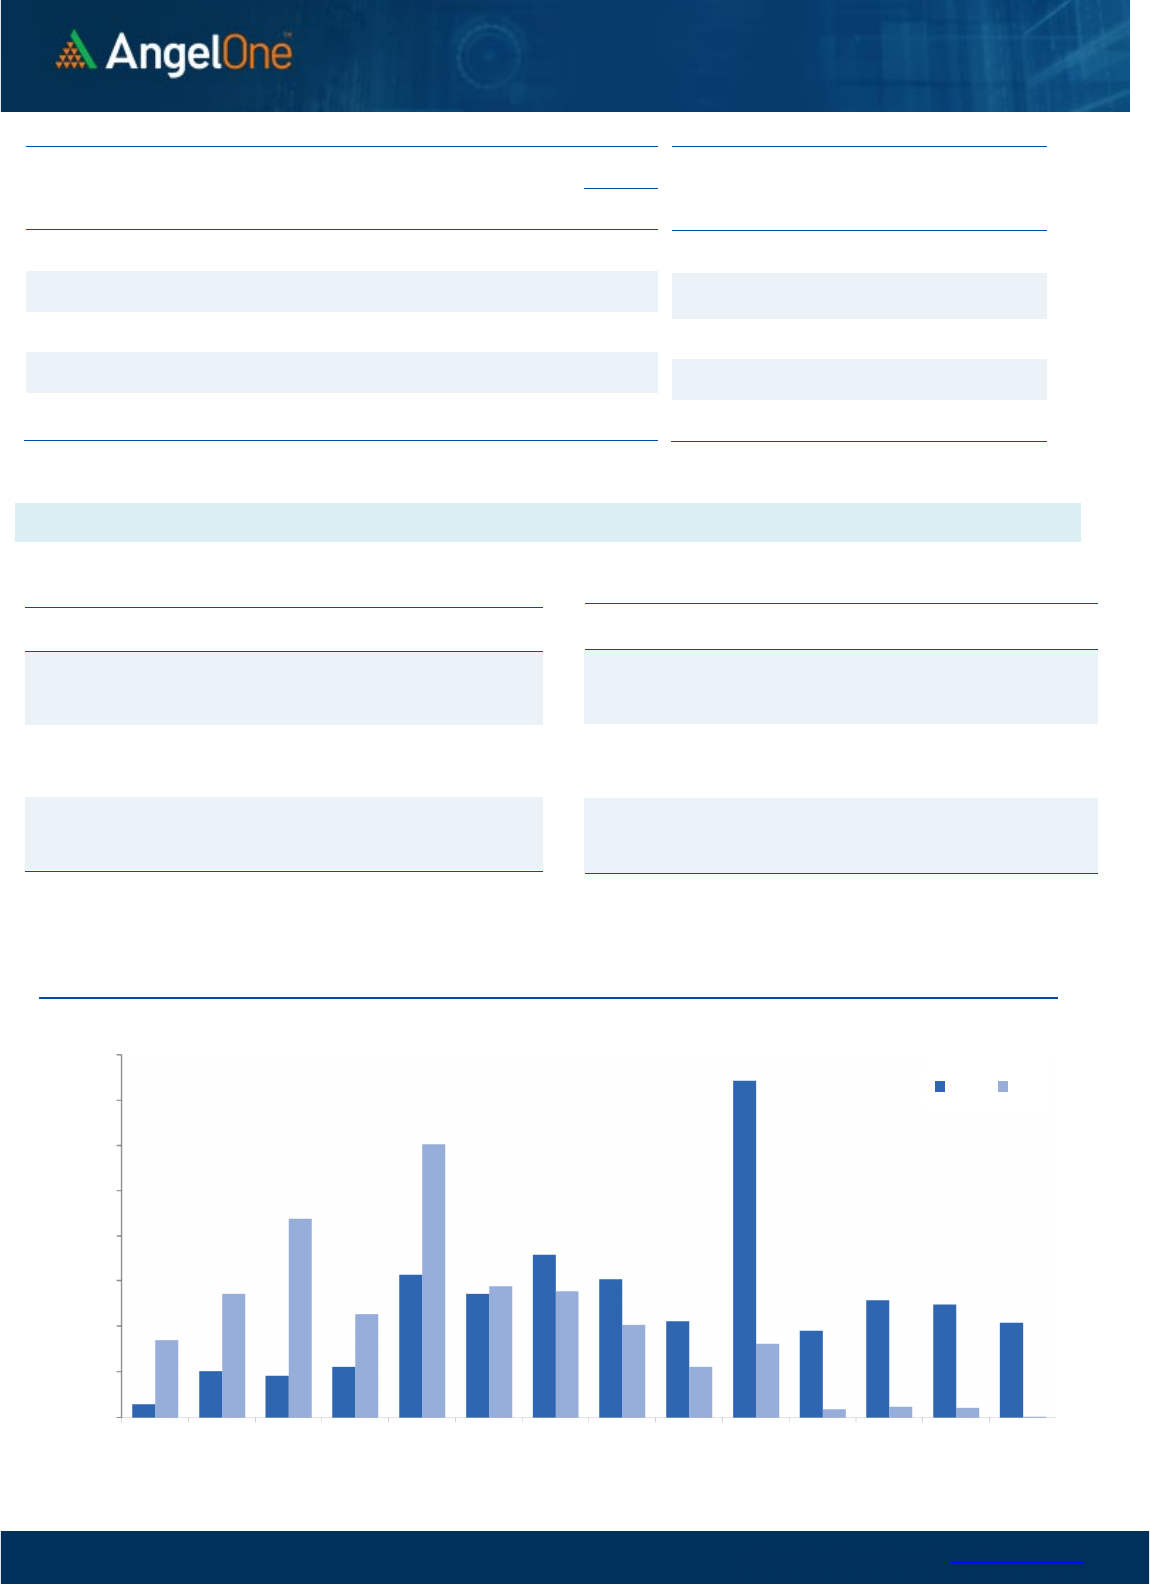
Nifty Vs OI
17800
18000
18200
18400
18600
18800
19000
8,000
9,000
10,000
11,000
12,000
13,000
14,000
15,000
16,000
11/17 11/22 11/24 11/28 11/30 12/2 12/6
Openinterest Nifty
OI Gainers
SCRIP OI
OI
CHG. (%)
PRICE
PRICE
CHG. (%)
KOTAKBANK 26880000 14.96 1897.00 -0.72
DIXON 577000 12.17 4164.20 -2.34
BANKBARODA 99549450 11.54 188.25 6.26
COROMANDEL 2911300 8.51 966.25 4.75
ASTRAL 1613150 8.19 2065.55 3.51
AXISBANK 42031200 7.04 939.35 2.32
AUBANK 7521000 6.36 672.95 0.13
POWERGRID 36660600 6.04 217.80 -1.41
OI Losers
SCRIP OI
OI
CHG. (%)
PRICE
PRICE
CHG. (%)
PNB 221632000 -9.88 57.70 4.03
POLYCAB 947100 -6.82 2732.45 1.03
ICICIGI 3493075 -4.72 1249.15 0.26
BOSCHLTD 121150 -4.42 17454.60 2.06
GLENMARK 5865150 -4.39 431.25 2.53
SIEMENS 2147200 -4.11 2945.90 1.11
BANDHANBNK 52286400 -4.09 251.50 1.77
HINDUNILVR 7233300 -3.82 2705.25 -0.05
Put-Call Ratio
SCRIP PCR (OI) PCR (VOL)
NIFTY 0.85 0.86
BANKNIFTY 1.25 0.92
RELIANCE 0.48 0.37
ICICIBANK 0.49 0.40
INFY 0.44 0.48
www.angelone.in
Technical & Derivatives Report
DEC 09, 2022
Note: Above mentioned Bullish or Bearish Spreads in Nifty (Dec Series) are given as an information and not as a recommendation.
Nifty Spot =
1
8
609.30
FII Statistics for
December
0
8
, 2022
Detail Buy
Contracts
Open
Interest
Value
(in Cr.)
Sell
Net
CHANGE
INDEX
FUTURES
3098.04 2328.18 769.86
179365 17700.16 0.11
INDEX
OPTIONS
2256185.44 2245014.96 11170.48
1434043 138505.61 (31.06)
STOCK
FUTURES
8240.65 8213.36 27.29
1926515 135358.10 (0.20)
STOCK
OPTIONS
8407.07 8548.76 (141.69) 144252 10375.91 4.75
Total 2275931.20
2264105.26
11825.94
3684175
301939.78
(14.86)
Turnover on
December
0
8
, 2022
Instrument
No. of
Contracts
Turnover
( in Cr. )
Change
(%)
Index
Futures
253143 2570784.05
10313.17
Index
Options
296637863 4210455.95
10737.58
Stock
Futures
607205 4457190.09
9516.82
Stock
Options
2416648 299915.43 9279.86
Total
2,416,648 299915.43 10103.37
Bull-Call Spreads
Action Strike Price Risk Reward BEP
Buy
18600 271.15
61.30
38.70
18661.30
Sell
18700 209.85
Buy
18600 271.15
113.80
86.20
18713.80
Sell
18800 157.35
Buy
18700 209.85
52.50 47.50 18752.50
Sell 18800 157.35
Bear
-
Put Spreads
Action Strike Price Risk Reward BEP
Buy 18600 152.15
36.55
63.45
18563.45
Sell
18500 119.65
Buy 18600 152.15
68.15
131.85
18531.85
Sell 18400 94.20
Buy
18500 119.65
31.60 68.40 18468.40
Sell 18400 94.20
Nifty Put
-
Call Analysis
,0
500,000
1000,000
1500,000
2000,000
2500,000
3000,000
3500,000
4000,000
18100 18200 18300 18400 18500 18600 18700 18800 18900 19000 19100 19200 19300 19400
Call Put

www.angelone.in
Technical & Derivatives Report
DEC 09, 2022
`
Daily Pivot Levels for Nifty Constituents
Scrips
S2
S1
PIVOT
R1 R2
ADANIENT 3,983 4,004
4,024
4,046 4,066
ADANIPORTS
882
887
893
898
904
APOLLOHOSP 4,625 4,665
4,721
4,761
4,818
ASIANPAINT
3,183
3,202
3,222
3,241 3,260
AXISBANK
903
922
933
952
963
BAJAJ-AUTO
3,597
3,617
3,638
3,657
3,678
BAJFINANCE 6,487 6,535
6,607
6,655
6,727
BAJAJFINSV
1,593
1,607
1,614
1,628
1,636
BPCL
330
333
335
338
340
BHARTIARTL 819 826
833
840
847
BRITANNIA 4,349 4,372
4,407
4,430
4,466
CIPLA
1,098
1,103
1,108
1,113
1,118
COALINDIA
228
229
230
231
232
DIVISLAB
3,241
3,264
3,307 3,330 3,374
DRREDDY 4,307 4,332
4,356 4,380
4,404
EICHERMOT 3,255 3,289
3,309 3,343
3,363
GRASIM
1,795
1,804
1,815
1,823
1,834
HCLTECH
1,090
1,096
1,105
1,110
1,120
HDFCBANK
1,596
1,608
1,617 1,629
1,638
HDFCLIFE
570
574
577
581
585
HDFC
2,635
2,650
2,662
2,677
2,689
HEROMOTOCO
2,727
2,743
2,761
2,776
2,794
HINDALCO
457
464
469
476
480
HINDUNILVR
2,675
2,690
2,701
2,716
2,726
ICICIBANK
920
926
930
936
940
INDUSINDBK
1,151
1,171
1,183
1,202
1,214
INFY
1,589
1,604
1,614
1,630
1,640
ITC
335
336
339
341
344
JSW STEEL 732 738
742
749
753
KOTAKBANK
1,865
1,881
1,893
1,909
1,921
LT
2,099
2,133
2,154
2,188
2,209
M&M
1,263
1,269
1,275
1,281
1,288
MARUTI 8,562 8,622
8,667
8,727
8,772
NESTLEIND 19,510 19,658
19,878
20,026
20,246
NTPC 168 169
171
172
173
ONGC
139
141
142 144 145
POWERGRID 214 216
219
221
224
RELIANCE
2,626
2,638
2,651
2,663
2,676
SBILIFE
1,232
1,250
1,259
1,276
1,286
SBIN
604
608
611
615
618
SUNPHARMA
948
964
991
1,007
1,034
TCS
3,316
3,333
3,357 3,374 3,398
TATACONSUM
791
797
803
809
814
TATAMOTORS 412 415
418 421
424
TATASTEEL
110
111
112
113
114
TECHM
1,063
1,069
1,076
1,081
1,088
TITAN 2,556 2,569
2,591
2,604
2,626
ULTRACEMCO
7,120
7,152
7,186
7,217
7,251
UPL
768
773
778
783
788
WIPRO
400
402
405
407 410

www.angelone.in
Technical & Derivatives Report
DEC 09, 2022
*
Technical and Derivatives Team:
Sameet Chavan Chief Analyst – Technical & Derivatives sameet.chavan@angelone.in
Sneha Seth Senior Analyst – Technical & Derivatives sneha.seth@angelone.in
Rajesh Bhosale Technical Analyst rajesh.bhosle@angelone.in
Osho Krishan Senior Analyst – Technical & Derivatives osho.krishan@angelone.in
Research Team Tel: 022 – 39357600 Website: www.angelone.in
For Technical Queries E-mail: technicalresearch-cso@angelone.in
For Derivatives Queries E-mail: derivatives.desk@angelone.in
DISCLAIMER
Angel One Limited (hereinafter referred to as “Angel”) is a registered Member of National Stock Exchange of India Limited, Bombay
Stock Exchange Limited and Metropolitan Stock Exchange Limited. It is also registered as a Depository Participant with CDSL and
Portfolio Manager and investment advisor with SEBI. It also has registration with AMFI as a Mutual Fund Distributor. Angel One
Limited is a registered entity with SEBI for Research Analyst in terms of SEBI (Research Analyst) Regulations, 2014 vide registration
number INH000000164. Angel or its associates has not been debarred/ suspended by SEBI or any other regulatory authority for
accessing /dealing in securities Market.
This document is solely for the personal information of the recipient, and must not be singularly used as the basis of any investment
decision. Nothing in this document should be construed as investment or financial advice. Each recipient of this document should
make such investigations as they deem necessary to arrive at an independent evaluation of an investment in the securities of the
companies referred to in this document (including the merits and risks involved), and should consult their own advisors to determine
the merits and risks of such an investment.
Angel or its associates or research analyst or his relative may have actual/beneficial ownership of 1% or more in the securities of
the subject company at the end of the month immediately preceding the date of publication of the research report. Neither Angel or
its associates nor Research Analysts or his relative has any material conflict of interest at the time of publication of research report.
Angel or its associates might have received any compensation from the companies mentioned in the report during the period
preceding twelve months from the date of this report for services in respect of managing or co-managing public offerings, corporate
finance, investment banking or merchant banking, brokerage services or other advisory service in a merger or specific transaction
in the normal course of business. Angel or its associates did not receive any compensation or other benefits from the companies
mentioned in the report or third party in connection with the research report. Neither Angel nor its research analyst entity has been
engaged in market making activity for the subject company.
Reports based on technical and derivative analysis center on studying charts of a stock's price movement, outstanding positions and
trading volume, as opposed to focusing on a company's fundamentals and, as such, may not match with a report on a company's
fundamentals. Investors are advised to refer the Fundamental and Technical Research Reports available on our website to evaluate
the contrary view, if any.
The information in this document has been printed on the basis of publicly available information, internal data and other reliable
sources believed to be true, but we do not represent that it is accurate or complete and it should not be relied on as such, as this
document is for general guidance only. Angel One Limited or any of its affiliates/ group companies shall not be in any way responsible
for any loss or damage that may arise to any person from any inadvertent error in the information contained in this report. Angel One
Limited has not independently verified all the information contained within this document. Accordingly, we cannot testify, nor make
any representation or warranty, express or implied, to the accuracy, contents or data contained within this document. While Angel
One Limited endeavors to update on a reasonable basis the information discussed in this material, there may be regulatory,
compliance, or other reasons that prevent us from doing so.
This document is being supplied to you solely for your information, and its contents, information or data may not be reproduced,
redistributed or passed on, directly or indirectly.
Neither Angel One Limited, nor its directors, employees or affiliates shall be liable for any loss or damage that may arise from or in
connection with the use of this information. Angel or its associates or Research Analyst or his relative might have financial interest
in the subject company. Research analyst has not served as an officer, director or employee of the subject company.
