SEPT 09, 2022
www.angelone.in
Technical & Derivatives Report
xOOOOOOOO
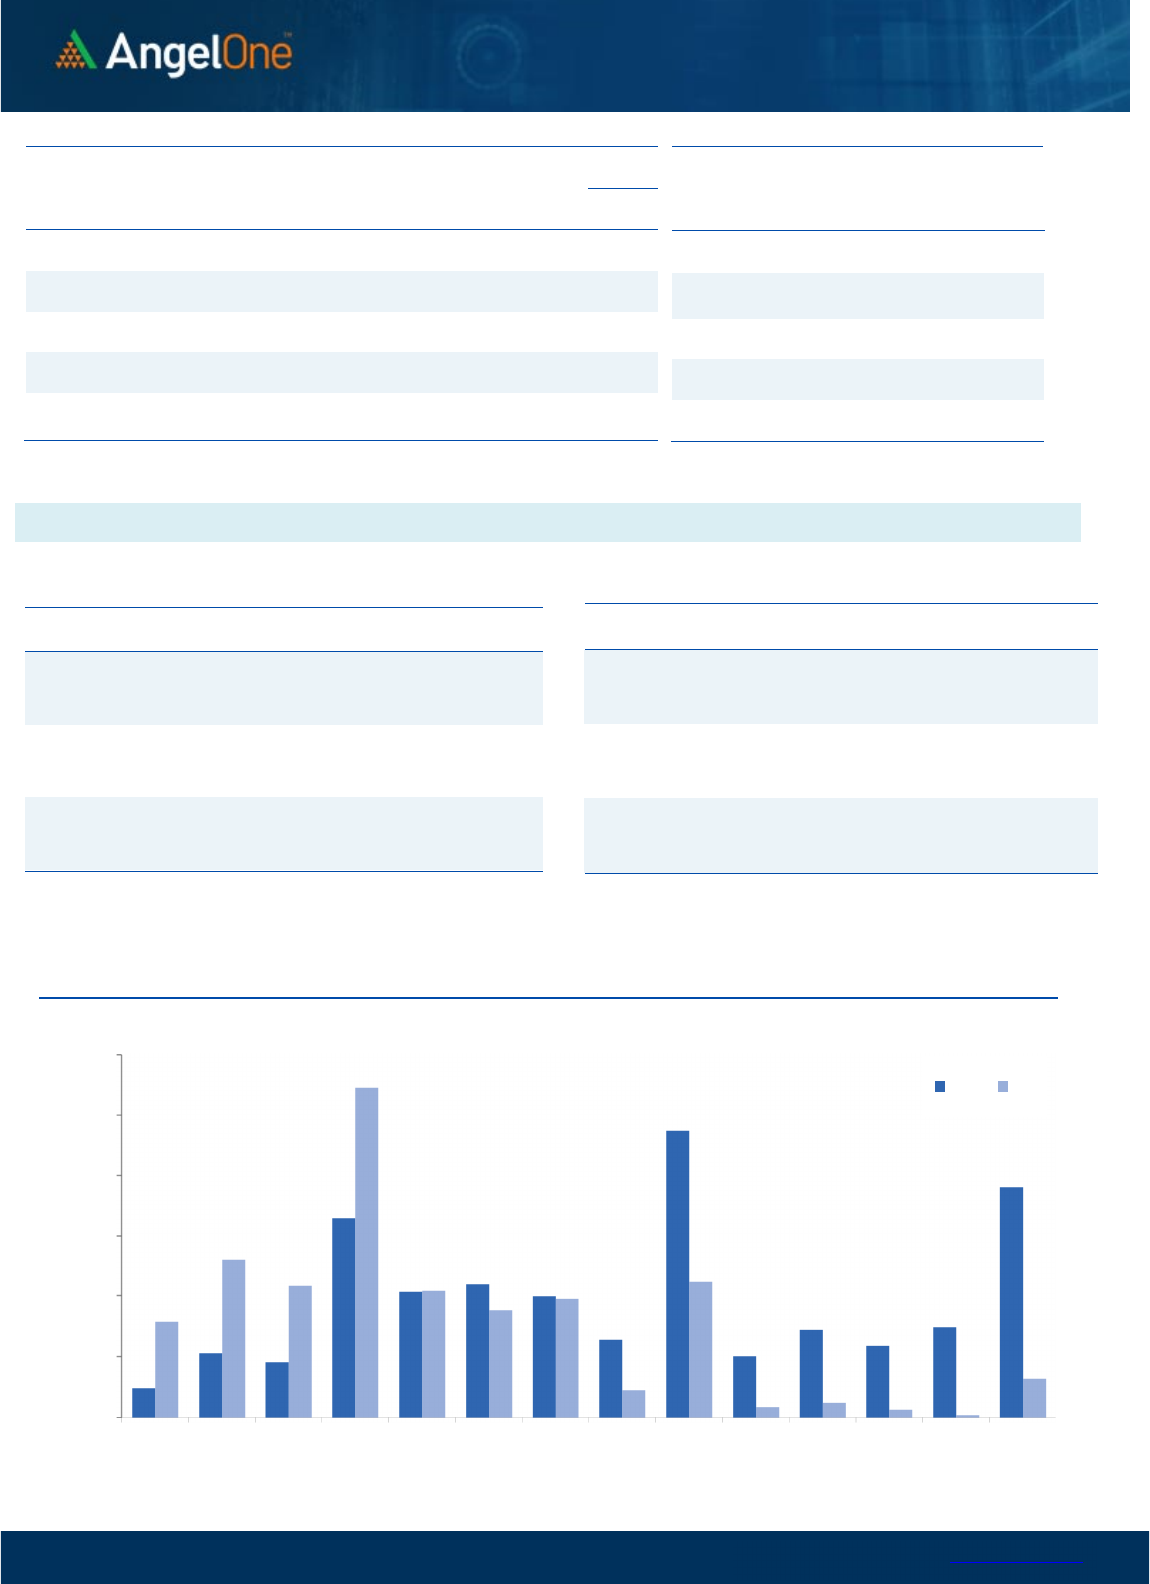
Nifty Bank Outlook (40209)
Bank Nifty as well started with a big gap up opening and despite there
was an intraday dip in the benchmark; the banking space remained
firm. Subsequently, as the day progressed, the bank index moved
higher to end with strong gains of 1.91% tad above 40200.
Despite some price correction on Wednesday, we remained buoyant
in this space and advised in our outlook to use any dips as a buying
opportunity. Now we are witnessing a strong closing with prices
trading at a fresh new high for the calendar year and we expect this
rally to continue. Traders are hence advised to continue using any
small dips as a buying opportunity. As far as levels are concerned,
40000 - 39900 is the immediate support whereas 40500 - 40650 is the
next immediate resistance.
Key Levels
Support 1 – 40000 Resistance 1 – 40500
Support 2 – 39900 Resistance 2 – 40650
Exhibit 1: Nifty
Daily
Chart
Exhibit 2: Nifty Bank
Daily
Chart
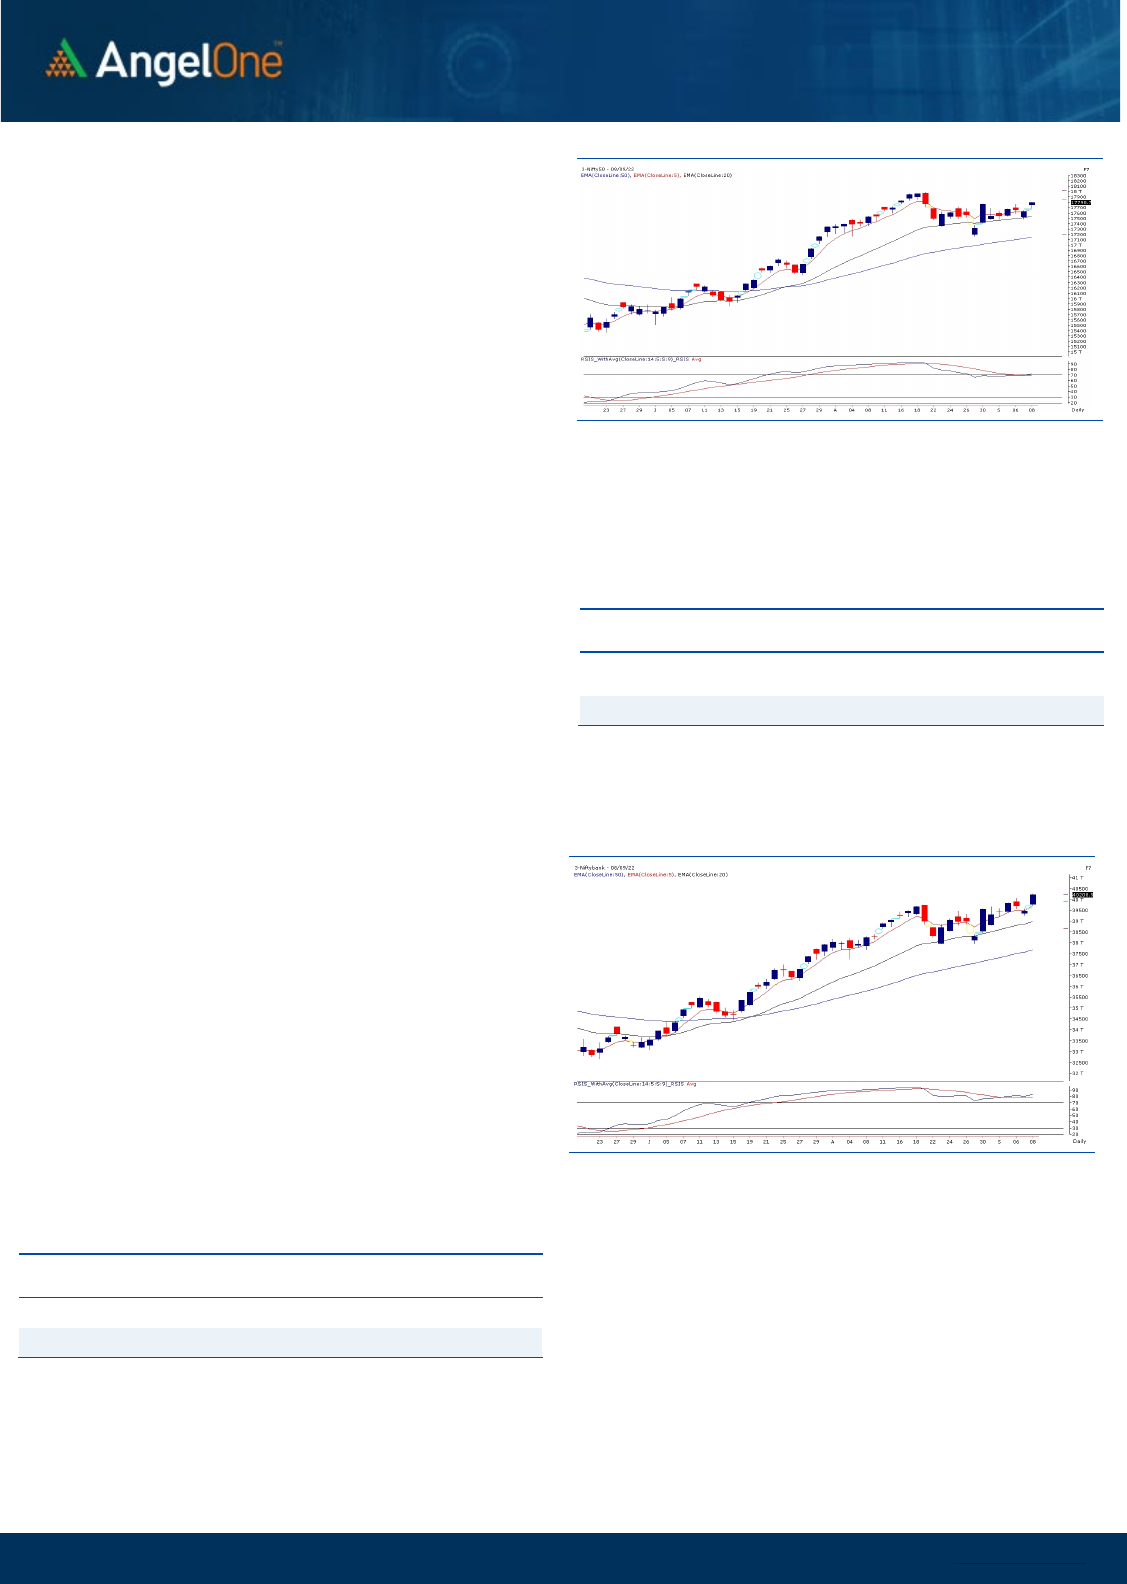
Sensex (59688) / Nifty (17799)
US markets have been on a declining mode since last couple of weeks
and Wednesday night, they rebounded sharply due to their overbought
condition. We being the outperforming market of late, was in search of
a small push sentimentally and sharp bounce back globally provided the
much needed impetus to start the session with a decent bump up. In
fact, a small bout of profit booking around the mid-session was
absorbed with an ease. Eventually, Nifty concluded the weekly expiry
around the 17800 mark by adding a percent to the bulls’ kitty.
This is exactly we had alluded to in our previous commentary that the
struggle around 17700 for Nifty will end if we get support from the
global peers. We finally managed to close at 3-week high, which was
the recent congestion phase. Importantly, this move is backed by the
banking space which has clocked highest level for the current calendar
year. This participation is certainly considered as a healthy sign for our
market. Going forward, we expect Nifty to continue this northward
move towards 17900 – 18000 and then beyond the 18000 mark. On the
flipside, if there is no aberration globally, 17700 – 17600 should now
act as immediate supports. Traders are advised to continue with an
optimistic approach and use declines to add fresh longs.
Apart from banking, the other heavyweight space, IT also
contributed in yesterday’s rally which has been a laggard for quite
sometime now. The cement too continued with its dream run as we
saw few smaller names giving a catch up move to the larger names.
One can continue to focus on such thematic movers and also, the
broader market remains the real flavor.
Key Levels
Support 1 – 17700 Resistance 1 – 17900
Support 2 – 17600 Resistance 2 – 18000

www.angelone.in
Technical & Derivatives Report
SEPT 09, 2022
View
The Indian equity market has witnessed a strong
session on the weekly expiry. The favorable global
bourses provided the much-needed impetus, and the
benchmark index Nifty rallied nearly a percent to
conclude the day a tad below the 17800 level.
FIIs were net buyers in the cash market segment to
the tune of Rs. 2913 crores. Simultaneously, in Index
futures, they bought worth Rs. 853 crores with an
increase in open interest, indicating long formation.
Looking at the overall F&O data, we have witnessed
long formation in both indices. On the options front,
piling up of position is seen at 17700-17800 put strikes,
indicating a gradual shift in the base. On the contrary,
a considerable OI concentration is seen at 17800-18000
call strikes, implying nearby resistance. Considering
the recent developments and price action, our market
is likely to remain bullish, wherein any intraday
correction could be utilized to add long positions.
Meanwhile, it is advisable to stay cautious as we
march towards the psychological mark of 18000 and to
keep a close tab on global developments.
Comments
The Nifty futures open interest has increased by
0.43%. and Bank Nifty futures open interest has
increased by 8.35% as the market closed at 17798.75.
The Nifty Sep future closed with a premium of 25.60
point against a premium of 26.65 point in the last
trading session. The Oct series closed at a premium
of 74.70 point.
The INDIA VIX decreased from 19.36 to 18.30. At the
same time, the PCR-OI of Nifty has increased from
1.07 to 1.26.
Few of the liquid counters where we have seen high
cost of carry are SHREECEM, BPCL, METROPOLIS,
TECHM and AXISBANK.
Historical Volatility
SCRIP HV
IDEA 82.43
RBLBANK 73.34
IBULHSGFIN 73.21
ZEEL 64.50
HINDCOPPER 63.49
Nifty Vs OI
17300
17400
17500
17600
17700
17800
17900
8,000
9,000
10,000
11,000
12,000
13,000
14,000
15,000
16,000
17,000
18,000
8/19 8/23 8/25 9/1 9/5 9/7
Openinterest Nifty
OI
Gainers
SCRIP OI
OI
CHG. (%)
PRICE
PRICE
CHG. (%)
ASTRAL 1098350 19.76 2471.40 0.55
SHREECEM 388525 10.72 24458.45 5.96
IOC 95774250 9.29 73.05 2.23
GNFC 6497400 8.89 755.95 2.39
PERSISTENT 777450 8.70 3279.15 -0.69
ICICIGI 4120800 8.24 1228.70 -1.81
PVR 2900689 7.77 1934.40 0.63
FEDERALBNK 87030000 7.56 118.05 -0.38
OI Losers
SCRIP OI
OI
CHG. (%)
PRICE
PRICE
CHG. (%)
CONCOR 7652000 -6.55 732.20 0.53
APOLLOTYRE 12400500 -6.39 277.80 1.03
COALINDIA 33679800 -5.99 236.45 -1.02
M&M 10584700 -4.86 1321.90 2.45
ABFRL 10992800 -4.82 322.45 0.15
CROMPTON 4464000 -4.09 413.40 -0.82
NTPC 91046100 -3.46 166.80 -0.33
TECHM 16765200 -3.30 1089.65 2.89
Put-Call Ratio
SCRIP PCR (OI) PCR (VOL)
NIFTY 1.26 1.04
BANKNIFTY 1.30 0.92
RELIANCE 0.54 0.43
ICICIBANK 0.68 0.38
INFY 0.39 0.31
www.angelone.in
Technical & Derivatives Report
SEPT 09, 2022
Note: Above mentioned Bullish or Bearish Spreads in Nifty (Sep Series) are given as an information and not as a recommendation.
Nifty Spot =
17,
798
.
75
FII Statistics for
September
0
8
, 2022
Detail Buy
Contracts
Open
Interest
Value
(in Cr.)
Sell
Net
CHANGE
INDEX
FUTURES
4077.49 3224.21 853.28
142223 13258.58 3.02
INDEX
OPTIONS
1768521.66 1772664.41 (4142.75) 902111 82718.77 (40.30)
STOCK
FUTURES
10035.22 11754.42 (1719.20) 2109373 149222.41 0.13
STOCK
OPTIONS
6641.95 6686.05 (44.10) 156180 11187.17 7.37
Total 1789276.32
1794329.09
(5052.77) 3309887
256386.93
(15.16)
Turnover on
September
0
8
, 2022
Instrument
No. of
Contracts
Turnover
( in Cr. )
Change
(%)
Index
Futures
376577 35492.50 14.15
Index
Options
268216536
25700196.41
116.78
Stock
Futures
779223 56331.28 -3.07
Stock
Options
2636628 201771.93 -6.37
Total
26,36,628 201771.93 113.77
Bull-Call Spreads
Action Strike Price Risk Reward BEP
Buy
17800 289.85
54.70
45.30
17854.70
Sell
17900 235.15
Buy
17800 289.85
100.40
99.60
17900.40
Sell
18000 189.45
Buy
17900 235.15
45.70 54.30 17945.70
Sell 18000 189.45
Bear
-
Put Spreads
Action Strike Price Risk Reward BEP
Buy 17800 268.15
41.85
58.15
17758.15
Sell
17700 226.30
Buy 17800 268.15
76.25
123.75
17723.75
Sell 17600 191.90
Buy
17700 226.30
34.40 65.60 17665.60
Sell 17600 191.90
Nifty Put
-
Call Analysis
,0
500,000
1000,000
1500,000
2000,000
2500,000
3000,000
17200 17300 17400 17500 17600 17700 17800 17900 18000 18100 18200 18300 18400 18500
Call Put

www.angelone.in
Technical & Derivatives Report
SEPT 09, 2022
`
Daily Pivot Levels for Nifty Constituents
Scrips
S2
S1
PIVOT
R1 R2
ADANIPORTS
859
872
880
893
902
APOLLOHOSP 4,323 4,369
4,407
4,453
4,491
ASIANPAINT
3,397
3,423
3,454
3,481
3,511
AXISBANK
748
764
773
789
798
BAJAJ-AUTO
3,816
3,831
3,856 3,871 3,895
BAJFINANCE
7,133
7,195
7,237
7,300 7,342
BAJAJFINSV
16,857
17,120
17,305
17,568
17,753
BPCL 326 333
337
344
348
BHARTIARTL
749
759
768
778
787
BRITANNIA
3,610
3,641
3,664
3,695
3,718
CIPLA
1,038
1,047
1,053
1,063
1,069
COALINDIA 232 234
237
240
243
DIVISLAB 3,536 3,552
3,581
3,597
3,626
DRREDDY 4,230 4,251
4,274 4,295
4,318
EICHERMOT
3,367
3,396
3,430 3,459 3,493
GRASIM
1,742
1,756
1,764
1,778
1,787
HCLTECH
920
926
933
939
946
HDFCBANK
1,475
1,487
1,493
1,504
1,511
HDFCLIFE
575
580
583
588
591
HDFC
2,418
2,434
2,444
2,460 2,470
HEROMOTOCO
2,831
2,844
2,859
2,872
2,886
HINDALCO
408
414
426
432
443
HINDUNILVR 2,546 2,561
2,579
2,594
2,612
ICICIBANK
880
889
895
905
910
INDUSINDBK
1,089
1,099
1,107
1,116
1,125
INFY
1,456
1,466
1,474
1,483
1,491
ITC 326 328
329
331
332
JSW STEEL 673 679
685
691
697
KOTAKBANK 1,901 1,915
1,927
1,941
1,953
LT
1,937
1,956
1,966
1,985
1,996
M&M
1,289
1,305
1,319 1,335
1,349
MARUTI
8,713
8,752
8,819
8,857
8,924
NESTLEIND
18,863
18,994
19,135
19,266
19,407
NTPC 164 165
167
169
171
ONGC 130 131
133
134 135
POWERGRID
221
223
225
226
228
RELIANCE 2,558 2,572
2,585
2,599
2,612
SBILIFE
1,285
1,302
1,321 1,337
1,357
SHREECEM 22,429 23,444
24,162
25,177
25,895
SBIN 531 538
542
549
553
SUNPHARMA
880
887
894
901
908
TCS
3,148
3,159
3,171 3,182
3,194
TATACONSUM
805
812
822
829
839
TATAMOTORS
432
437
445
450
457
TATASTEEL 103 105
107
108
110
TECHM
1,057
1,074
1,083
1,099
1,109
TITAN 2,590 2,609
2,634
2,652
2,678
ULTRACEMCO
6,721
6,820
6,880
6,979
7,039
UPL 726 732
740
745
753
WIPRO
408
410
412 415 417

www.angelone.in
Technical & Derivatives Report
SEPT 09, 2022
*
Technical and Derivatives Team:
Sameet Chavan Chief Analyst – Technical & Derivatives sameet.chavan@angelone.in
Sneha Seth Senior Analyst – Technical & Derivatives sneha.seth@angelone.in
Rajesh Bhosale Technical Analyst rajesh.bhosle@angelone.in
Osho Krishan Senior Analyst – Technical & Derivatives osho.krishan@angelone.in
Research Team Tel: 022 – 39357600 (Extn. 6844) Website: www.angelone.in
For Technical Queries E-mail: technicalresearch-cso@angelone.in
For Derivatives Queries E-mail: derivatives.desk@angelone.in
DISCLAIMER
Angel One Limited (hereinafter referred to as “Angel”) is a registered Member of National Stock Exchange of India Limited, Bombay
Stock Exchange Limited and Metropolitan Stock Exchange Limited. It is also registered as a Depository Participant with CDSL and
Portfolio Manager and investment advisor with SEBI. It also has registration with AMFI as a Mutual Fund Distributor. Angel One
Limited is a registered entity with SEBI for Research Analyst in terms of SEBI (Research Analyst) Regulations, 2014 vide registration
number INH000000164. Angel or its associates has not been debarred/ suspended by SEBI or any other regulatory authority for
accessing /dealing in securities Market.
This document is solely for the personal information of the recipient, and must not be singularly used as the basis of any investment
decision. Nothing in this document should be construed as investment or financial advice. Each recipient of this document should
make such investigations as they deem necessary to arrive at an independent evaluation of an investment in the securities of the
companies referred to in this document (including the merits and risks involved), and should consult their own advisors to determine
the merits and risks of such an investment.
Angel or its associates or research analyst or his relative may have actual/beneficial ownership of 1% or more in the securities of
the subject company at the end of the month immediately preceding the date of publication of the research report. Neither Angel or
its associates nor Research Analysts or his relative has any material conflict of interest at the time of publication of research report.
Angel or its associates might have received any compensation from the companies mentioned in the report during the period
preceding twelve months from the date of this report for services in respect of managing or co-managing public offerings, corporate
finance, investment banking or merchant banking, brokerage services or other advisory service in a merger or specific transaction
in the normal course of business. Angel or its associates did not receive any compensation or other benefits from the companies
mentioned in the report or third party in connection with the research report. Neither Angel nor its research analyst entity has been
engaged in market making activity for the subject company.
Reports based on technical and derivative analysis center on studying charts of a stock's price movement, outstanding positions and
trading volume, as opposed to focusing on a company's fundamentals and, as such, may not match with a report on a company's
fundamentals. Investors are advised to refer the Fundamental and Technical Research Reports available on our website to evaluate
the contrary view, if any.
The information in this document has been printed on the basis of publicly available information, internal data and other reliable
sources believed to be true, but we do not represent that it is accurate or complete and it should not be relied on as such, as this
document is for general guidance only. Angel One Limited or any of its affiliates/ group companies shall not be in any way responsible
for any loss or damage that may arise to any person from any inadvertent error in the information contained in this report. Angel One
Limited has not independently verified all the information contained within this document. Accordingly, we cannot testify, nor make
any representation or warranty, express or implied, to the accuracy, contents or data contained within this document. While Angel
One Limited endeavors to update on a reasonable basis the information discussed in this material, there may be regulatory,
compliance, or other reasons that prevent us from doing so.
This document is being supplied to you solely for your information, and its contents, information or data may not be reproduced,
redistributed or passed on, directly or indirectly.
Neither Angel One Limited, nor its directors, employees or affiliates shall be liable for any loss or damage that may arise from or in
connection with the use of this information. Angel or its associates or Research Analyst or his relative might have financial interest
in the subject company. Research analyst has not served as an officer, director or employee of the subject company.
