March 09, 2023
www.angelone.in
Technical & Derivatives Report
Nifty Bank
Outlook (
41
577
)
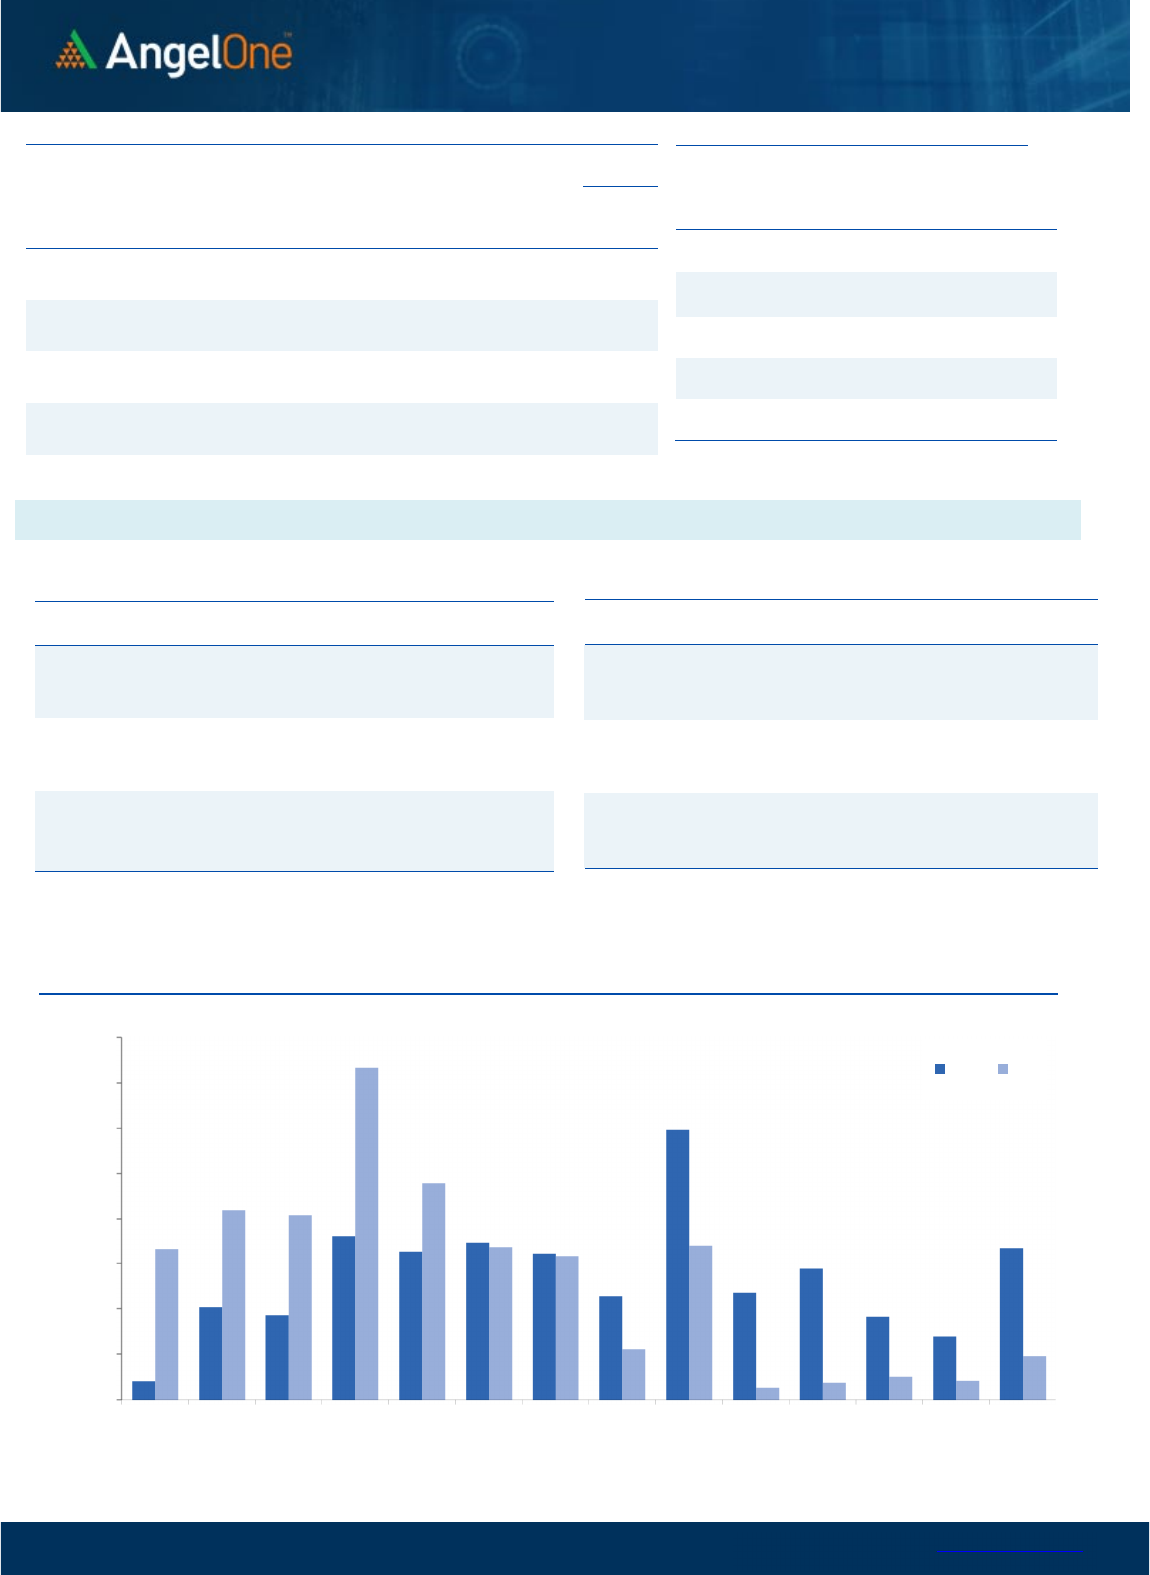
Post initial hiccups, the banking index stabilised and traded in a
range in the vicinity of 41200 for initial couple of hours. As we
progressed, fresh buying emerged around the mid-session to inch
higher towards 41600. The BankNifty outperformed the
benchmark index and concluded the day tad above 41500 with
gains of over half a percent.
The kind of recovery we witnessed was indeed remarkable
especially considering Monday’s profit booking and yesterday’s
weak start. Technically speaking, the banking index rebounded
precisely from the falling trendline support on the daily chart and
has also managed to close above the 89 EMA with authority. Going
ahead, 42000 remains the next important level to watch out for
and any sustainable move beyond same will certainly improve the
short to medium term chart structure. On the flip side, 41000-
41200 should now act as a strong demand zone for BankNifty.
Considering the above data points, we remain upbeat in this space
and would advocate ‘buy on dips’ strategy for same.
Key Levels
Support 1 – 41200 Resistance 1 – 41900
Support 2 – 41000 Resistance 2 – 42000
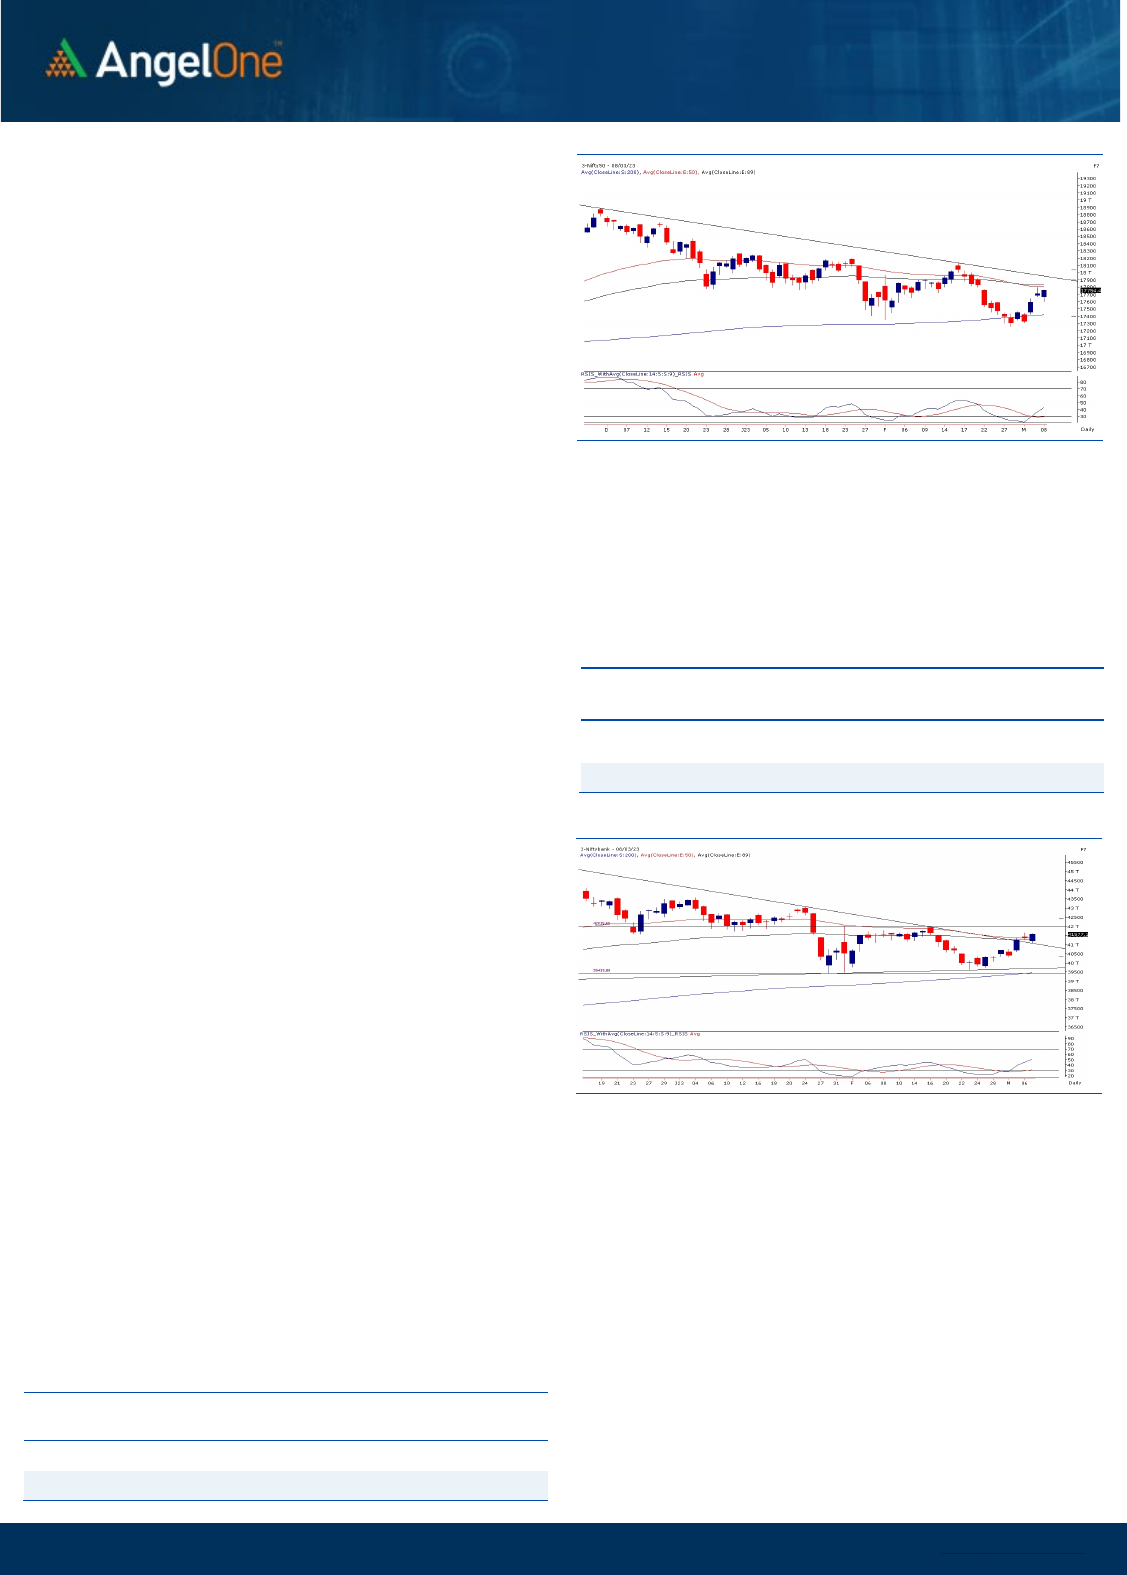
Exhibit 1: Nifty Daily Chart
Exhibit 2: Nifty Bank Daily Chart
Sensex (
60
348
) / Nifty (
1
7
7
54
)
The US markets reacted negatively to the remark of the FED
Chairperson on the rate hikes and taking cues from there the SGX
Nifty indicated a weak opening. In line with this, our markets had a
gap-down opening however post the initial hiccup there was a
gradual bounce back to recover the lost ground. During the fag end
there was a strong positive traction that eventually resulted in Nifty
ending with gains of 0.24 tad above 17750.
Our markets outperformed as compared to the peers and the initial
dip getting bought into augurs well for the bulls. As highlighted in
our previous outlook, 17800 – 17850 is a key zone to watch out for
as it coincides with a 61.8% retracement level and 89EMA. However,
considering the broad-based buying and fag end surge we expect
the benchmark to surpass this level and head towards 18000 in the
coming sessions. On the flip side, even though the bullish gap left
on Monday got filled, it did its job of acting as a support, and going
ahead as well we continue to see 17600 – 17570 as strong support.
On the weekly expiry day, any dip toward this key level can be
considered a buying opportunity.
Even though there was no major change on the Index front, there
was a lot of action in the midcap counters. If we observe the Nifty
Midcap 100 index, it has broken above its recent swing high and
can be considered a technical bullish breakout. Going ahead, we
expect the midcap space to continue to outperform, and hence
traders are advised to focus on identifying apt themes that can
give mesmerizing moves in the near term.
Key Levels
Support 1 – 17600 Resistance 1 – 17850
Support 2 – 17570 Resistance 2 – 17930

www.angelone.in
Technical & Derivatives Report
March 09, 2023
View
Our market started the day on a bleak note which
augured well for the bulls and the benchmark index
made a modest recovery to not only trim down the
losses but eventually settled in green. Nifty
reclaimed the 17750 level, procuring 0.24 percent.
FIIs were net buyers in the cash market segment to
the tune of Rs. 3672 crores. Simultaneously, in Index
futures, they sold worth Rs. 577 crores with an
increase in open interest, indicating short addition.
Looking at the F&O data, there is no significant
change in the key indices ahead of the weekly expiry
session. On the options front, a considerable piling
up of position is seen at the 17600 put strike,
indicating strong support for Nifty. On the higher
end, the 17800-17900 call strikes have the maximum
OI concentration, indicating the immediate hurdles.
Meanwhile, the ‘Long Short Ratio’ has contracted a
bit to 25% from 26%. Considering the recent price
action, the undertone remains upbeat, wherein any
intraday dip could be utilized to add long in the index.
Comments
The Nifty futures open interest has increased by 4.21%
and Bank Nifty futures open interest has increased by
1.88% as the market closed at 17754.40.
The Nifty March future closed with a premium of 40.15
point against a premium of 63.50 point in the last
trading session. The April series closed at a premium of
139.85 point.
The INDIA VIX increased from 12.26 to 12.45. At the
same time, the PCR-OI of Nifty has increased from 1.12
to 1.26.
Few of the liquid counters where we have seen high
cost of carry are BALRAMCHIN, HAL, INDUSINDBK, PFC,
AND BOSCHLTD.
Historical Volatility
SCRIP HV
ADANIENT 94.60
IDEA 70.87
IBULHSGFIN 67.23
RBLBANK 63.63
ADANIPORTS 60.14
Nifty Vs OI
17200
17300
17400
17500
17600
17700
17800
17900
18000
18100
18200
4,000
6,000
8,000
10,000
12,000
14,000
16,000
2/14 2/16 2/20 2/23 2/27 3/1 3/3 3/8
Openinterest Nifty
OI Gainers
SCRIP OI
OI
CHG. (%)
PRICE
PRICE
CHG. (%)
BALRAMCHIN 9339200 64.10 400.35 6.85
HAL 3383100 11.64 2863.25 5.41
LT 8654100 8.89 2170.80 1.28
SUNPHARMA 17498600 8.85 957.50 -0.97
RECLTD 52104000 7.78 124.65 2.37
ICICIGI 3696225 7.65 1093.40 0.12
BOSCHLTD 157450 7.44 18724.40 3.24
RAMCOCEM 2869600 7.21 742.35 1.90
OI Losers
SCRIP OI
OI
CHG. (%)
PRICE
PRICE
CHG. (%)
OFSS 299800 -4.70 3235.95 -0.02
ULTRACEMCO 1904800 -4.51 7267.25 0.66
FSL 14986400 -4.28 114.65 -0.95
HONAUT 23685 -4.07 35783.60 0.76
VOLTAS 5450400 -3.94 909.70 -0.17
NAVINFLUOR 414450 -3.90 4230.05 0.23
MGL 3043200 -3.53 987.25 -0.04
COFORGE 882000 -3.50 4279.65 -1.30
Put-Call Ratio
SCRIP PCR (OI) PCR (VOL)
NIFTY 1.26 0.99
BANKNIFTY 1.27 0.88
RELIANCE 0.65 0.56
ICICIBANK 0.72 0.52
INFY 0.48 0.43
www.angelone.in
Technical & Derivatives Report
March 09, 2023
Note: Above mentioned Bullish or Bearish Spreads in Nifty (March Series) are given as an information and not as a recommendation.
Nifty Spot =
1
7
7
54
.
4
0
0900
Lot Size = 75
FII Statistics for
March 0
8
, 202
3
Detail Buy
Contracts
Open
Interest
Value
(in Cr.)
Sell
Net
CHANGE
INDEX
FUTURES
5207.90 5784.48 (576.58) 156800 14598.16 3.72
INDEX
OPTIONS
1332485.34 1327936.91 4548.43
2814683 263661.45 24.84
STOCK
FUTURES
8452.31 8334.20 118.11
2151475 144422.77 0.76
STOCK
OPTIONS
9310.45 9220.28 90.17
139591 9448.87 8.29
Total 1355456.00
1351275.87
4180.13
5262549
432131.25
12.69
Turnover
on
March
0
8
, 202
3
Instrument
No. of
Contracts
Turnover
( in Cr. )
Change
(%)
Index Futures
332940 32195.29
11.51
Index Options
189352781 46309.98
-7.43
Stock Futures
682752 45333.99
-10.93
Stock Options
2781216 3686.96 -30.98
Total
27,81,216 3686.96 -5.63
Bull-Call Spreads
Action Strike Price Risk Reward BEP
Buy
17800 181.05
49.30
50.70
17849.30
Sell
17900 131.75
Buy
17800 181.05
88.90
111.10
17888.90
Sell
18000 92.15
Buy
17900 131.75
39.60 60.40 17939.60
Sell
18000 92.15
Bear-Put Spreads
Action Strike Price Risk Reward BEP
Buy
17800 188.80
40.70
59.30
17759.30
Sell 17700 148.10
Buy 17800 188.80
72.10
127.90
17727.90
Sell
17600 116.70
Buy
17700 148.10
31.40 68.60 17668.60
Sell 17600 116.70
Nifty Put-Call Analysis
,0
500,000
1000,000
1500,000
2000,000
2500,000
3000,000
3500,000
4000,000
17200 17300 17400 17500 17600 17700 17800 17900 18000 18100 18200 18300 18400 18500
Call Put

www.angelone.in
Technical & Derivatives Report
March 09, 2023
`
Daily
Pivot Levels for Nifty Constituents
Scrips
S2
S1
PIVOT
R1
R2
ADANIENT
1,876
1,958
2,023
2,105
2,170
ADANIPORTS 670 691
703
724
736
APOLLOHOSP
4,311
4,344
4,392
4,425
4,474
ASIANPAINT
2,809
2,834
2,852
2,877
2,895
AXISBANK 849 855
859
865
868
BAJAJ-AUTO
3,673
3,742
3,780
3,849
3,887
BAJFINANCE
5,893
5,945
6,037
6,089
6,181
BAJAJFINSV
1,348
1,365
1,374
1,390
1,400
BPCL 321 323
325
328
330
BHARTIARTL 757 762
766
771
775
BRITANNIA
4,274
4,307
4,338
4,371
4,403
CIPLA 865 871
877
884
890
COALINDIA 222 223
224
226
227
DIVISLAB
2,800
2,817
2,839
2,856
2,877
DRREDDY
4,381
4,404
4,424
4,446
4,467
EICHERMOT
3,127
3,166
3,189
3,227
3,250
GRASIM
1,587
1,594
1,602
1,608
1,616
HCLTECH
1,101
1,111
1,117
1,127
1,134
HDFCBANK
1,611
1,621
1,630
1,640
1,650
HDFCLIFE
485
490
493
498
502
HDFC
2,646
2,663
2,680
2,697
2,714
HEROMOTOCO
2,426
2,452
2,467
2,493
2,507
HINDALCO 391 399
405
413
418
HINDUNILVR
2,450
2,468
2,485
2,502
2,519
ICICIBANK 857 865
869
877
881
INDUSINDBK
1,079
1,127
1,153
1,200
1,226
INFY
1,475
1,484
1,490
1,499
1,505
ITC 382 387
390
395
398
JSW STEEL 659 667
672
680
685
KOTAKBANK
1,720
1,730
1,737
1,747
1,755
LT
2,118
2,144
2,167
2,193
2,216
M&M
1,246
1,268
1,280
1,302
1,314
MARUTI
8,570
8,632
8,672
8,734
8,774
NESTLEIND
18,320
18,419
18,497
18,596
18,673
NTPC 174 176
178
180
182
ONGC 155 157
158
159
160
POWERGRID 225 226
227
229
230
RELIANCE
2,373
2,395
2,407
2,429
2,441
SBILIFE
1,096
1,113
1,127
1,143
1,158
SBIN 553 559
562
568
571
SUNPHARMA 939 948
957
966
975
TCS
3,307
3,349
3,372
3,414
3,438
TATACONSUM
706 713
718
726
731
TATAMOTORS 434 437
439
442
444
TATASTEEL 103 105
106
108
109
TECHM
1,060
1,069
1,079
1,088
1,098
TITAN
2,361
2,379
2,390
2,408
2,419
ULTRACEMCO
7,150
7,209
7,246
7,305
7,342
UPL 697 707
712
722
728
WIPRO 387 390
391
394
396

www.angelone.in
Technical & Derivatives Report
March 09, 2023
*
Technical and Derivatives Team:
Sameet Chavan Chief Analyst – Technical & Derivatives sameet.chavan@angelone.in
Sneha Seth Senior Analyst – Technical & Derivatives sneha.seth@angelone.in
Rajesh Bhosale Technical Analyst rajesh.bhosle@angelone.in
Osho Krishan Senior Analyst – Technical & Derivatives osho.krishan@angelone.in
Research Team Tel: 022 – 39357600 Website: www.angelone.in
For Technical Queries E-mail: technicalresearch-cso@angelone.in
For Derivatives Queries E-mail: derivatives.desk@angelone.in
DISCLAIMER
Angel One Limited (hereinafter referred to as “Angel”) is a registered Member of National Stock Exchange of India Limited, Bombay Stock Exchange
Limited and Metropolitan Stock Exchange Limited. It is also registered as a Depository Participant with CDSL and Portfolio Manager and investment
advisor with SEBI. It also has registration with AMFI as a Mutual Fund Distributor. Angel One Limited is a registered entity with SEBI for Research
Analyst in terms of SEBI (Research Analyst) Regulations, 2014 vide registration number INH000000164. Angel or its associates has not been
debarred/ suspended by SEBI or any other regulatory authority for accessing /dealing in securities Market.
This document is solely for the personal information of the recipient, and must not be singularly used as the basis of any investment decision.
Nothing in this document should be construed as investment or financial advice. Each recipient of this document should make such investigations
as they deem necessary to arrive at an independent evaluation of an investment in the securities of the companies referred to in this document
(including the merits and risks involved), and should consult their own advisors to determine the merits and risks of such an investment.
Angel or its associates or research analyst or his relative may have actual/beneficial ownership of 1% or more in the securities of the subject
company at the end of the month immediately preceding the date of publication of the research report. Neither Angel or its associates nor
Research Analysts or his relative has any material conflict of interest at the time of publication of research report.
Angel or its associates might have received any compensation from the companies mentioned in the report during the period preceding twelve
months from the date of this report for services in respect of managing or co-managing public offerings, corporate finance, investment banking or
merchant banking, brokerage services or other advisory service in a merger or specific transaction in the normal course of business. Angel or its
associates did not receive any compensation or other benefits from the companies mentioned in the report or third party in connection with the
research report. Neither Angel nor its research analyst entity has been engaged in market making activity for the subject company.
Reports based on technical and derivative analysis center on studying charts of a stock's price movement, outstanding positions and trading
volume, as opposed to focusing on a company's fundamentals and, as such, may not match with a report on a company's fundamentals. Investors
are advised to refer the Fundamental and Technical Research Reports available on our website to evaluate the contrary view, if any.
The information in this document has been printed on the basis of publicly available information, internal data and other reliable sources believed
to be true, but we do not represent that it is accurate or complete and it should not be relied on as such, as this document is for general guidance
only. Angel One Limited or any of its affiliates/ group companies shall not be in any way responsible for any loss or damage that may arise to any
person from any inadvertent error in the information contained in this report. Angel One Limited has not independently verified all the information
contained within this document. Accordingly, we cannot testify, nor make any representation or warranty, express or implied, to the accuracy,
contents or data contained within this document. While Angel One Limited endeavors to update on a reasonable basis the information discussed
in this material, there may be regulatory, compliance, or other reasons that prevent us from doing so.
This document is being supplied to you solely for your information, and its contents, information or data may not be reproduced, redistributed or
passed on, directly or indirectly.
Neither Angel One Limited, nor its directors, employees or affiliates shall be liable for any loss or damage that may arise from or in connection
with the use of this information. Angel or its associates or Research Analyst or his relative might have financial interest in the subject company.
Research analyst has not served as an officer, director or employee of the subject company.
