DEC 08, 2022
www.angelone.in
Technical & Derivatives Report
xOOOOOOOO
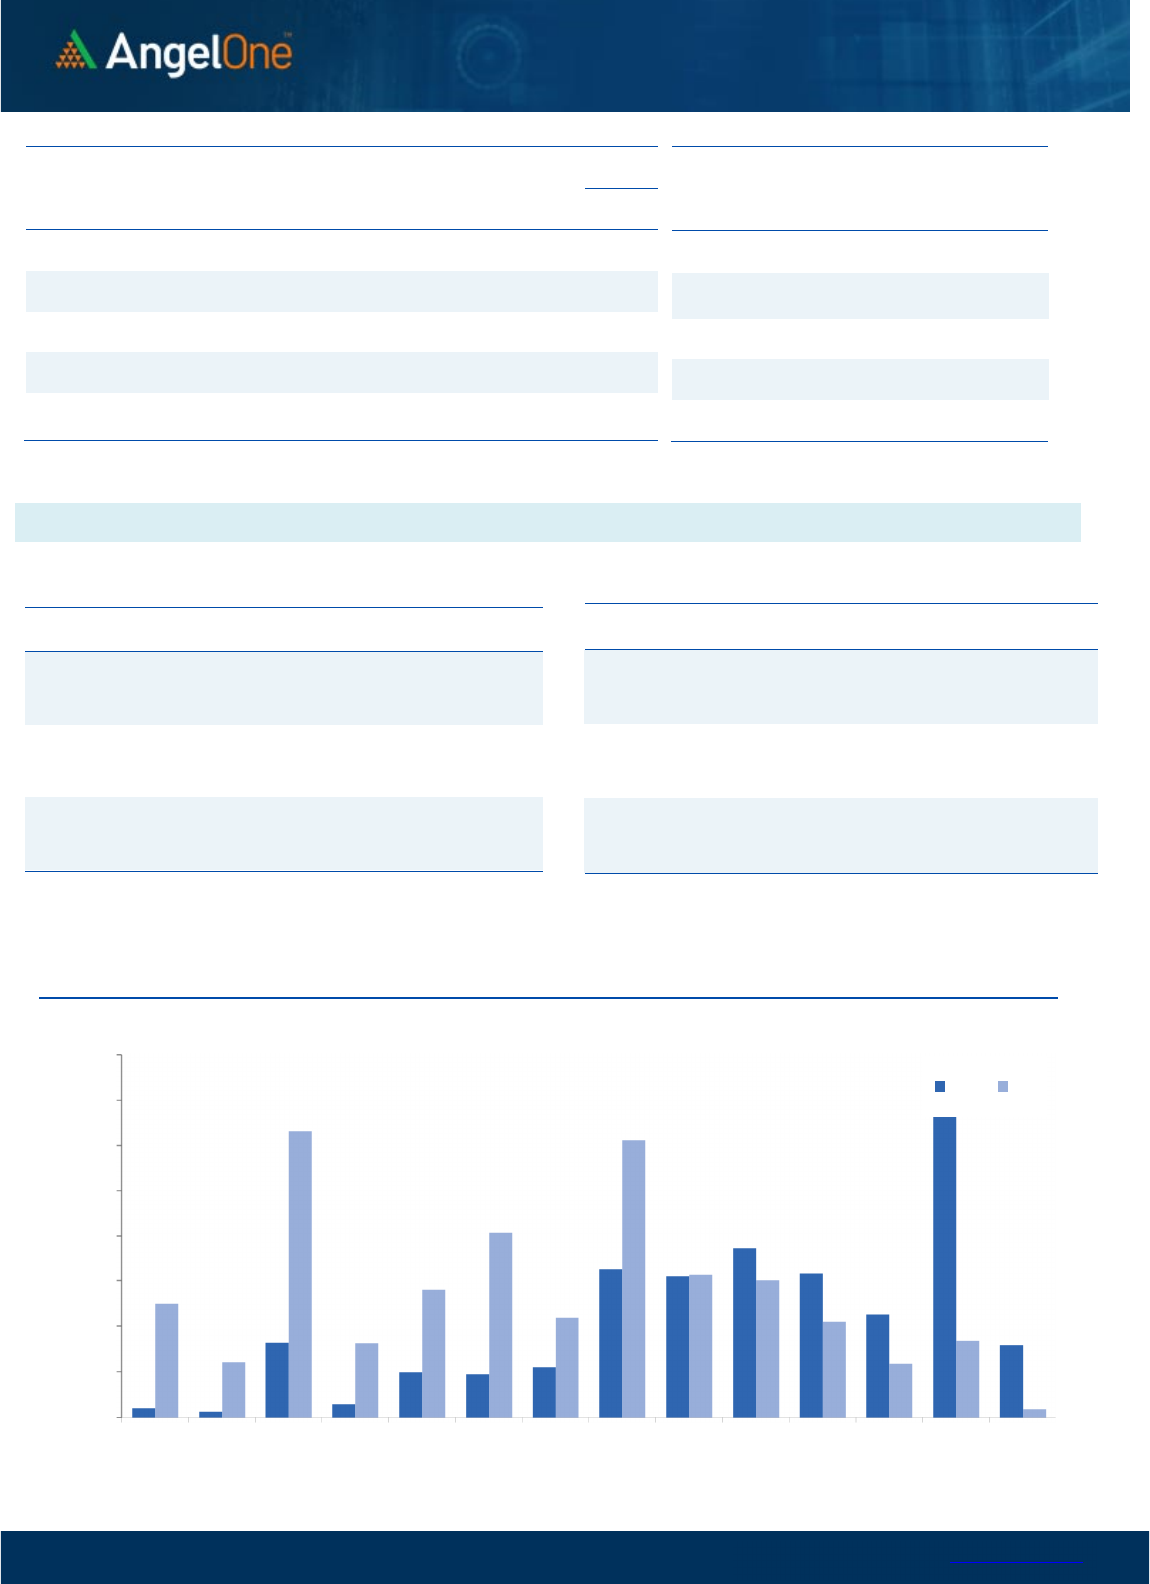
Nifty Bank
Outlook (
43
099
)
On the RBI policy day, Bank Nifty started on a flat and during the
first half an hour witnessed positive traction. This move however
was short-lived as after the policy announcement we witnessed
profit booking to eventually slip below the 43000 levels.
Subsequently, in the second half, there was no major traction and
after trading sideways the bank nifty ended flat tad below 43100
levels.
Despite being a key monetary policy day, there's no major change
in the price structure and prices continue to consolidate in a range.
On the intraday hourly chart, the range is getting squeezed and
very soon one can expect a momentum move after the recent
consolidation phase. Till then traders should continue with stock-
specific action as there is no lack of momentum on that front and
considering the primary trend as positive one should continue with
the bullish bets with a strict stop loss. On the weekly expiry day,
key levels to watch out for would be around 42940 and 42740 as
support whereas on the upside 43240 and 43400 is immediate
resistance.
Key Levels
Support 1 – 42940 Resistance 1 – 43240
Support 2 – 42740 Resistance 2 – 43400
Exhibit 1: Nifty
Daily
Chart
Exhibit 2: Nifty Bank
Daily
Chart
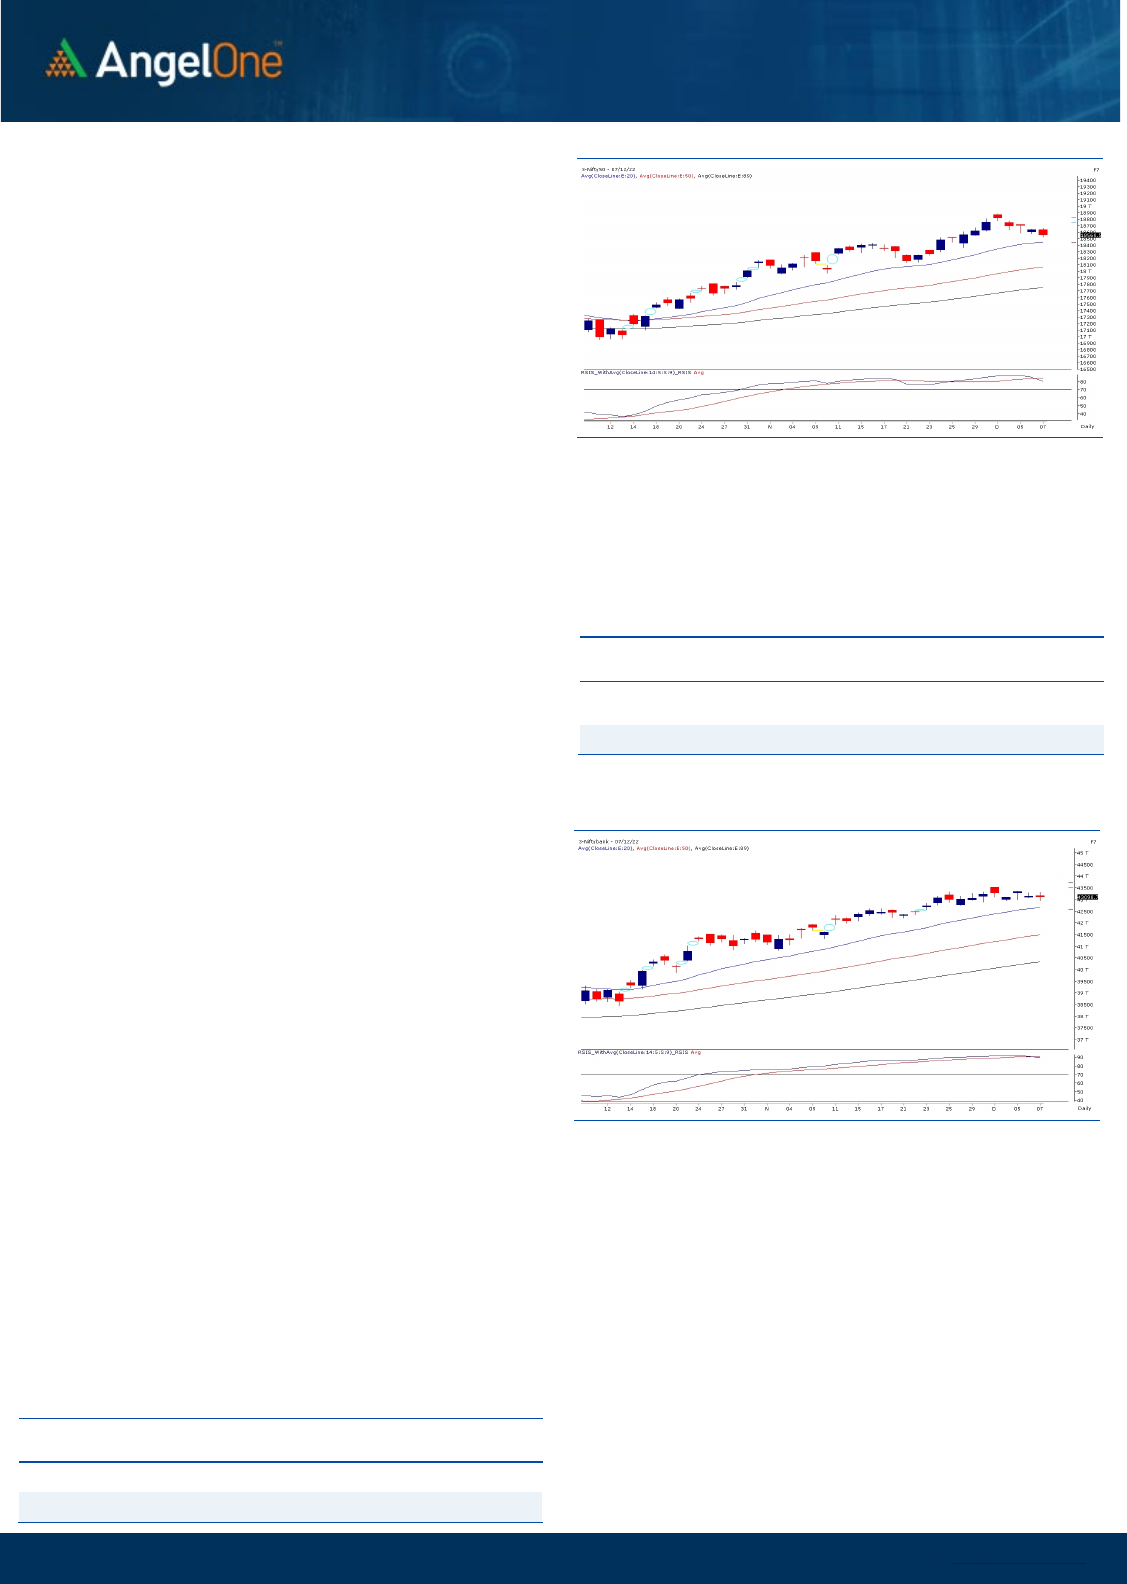
Sensex (62411) / Nifty (18561)
Our domestic market plunged post the announcement of the rate
hike by the RBI Governor, which was majorly in line with the market
expectations. The benchmark index Nifty50 descended towards the
18560 odd levels in intraday trade and struggled throughout the
trading session. By the penultimate hour, a sell-off triggered that
dragged the index lower towards the sacrosanct support of 18500.
Post all hustles, Nifty concluded the day in red with a cut of 0.44
percent and settled a tad above the 18550 level.
Technically speaking, a sign of timidness is evident as there is no cue
of follow-up buying in the index to levitate the sentiments. The
recent developments construe a motion of tentativeness among the
market participants as Nifty plunged to test the critical support
zone. However, till the sacrosanct of 18500 is withheld, the view of
buy on dip and sell on rise remains unscathed. The lack of firm
buying is the only worrisome, signifying the indecisiveness among
the bulls to retract the market. On the higher end, a decisive closure
above 18700 could only bring some cheer back into the market, and
then we may expect the northward journey to continue.
Meanwhile, any breach below 18500 could dampen the sentiments
further and Nifty could plunge towards the next support of 18400.
Going forward, the market is likely to remain in a slender range.
We reiterate to keep a close tab on the mentioned levels. Also,
one should continue with the stock-specific approach, as even
though the indices may not be doing much, the individual stocks
are not at all short of action. Also, one should stay abreast with
global developments.
Key Levels
Support 1 – 18500 Resistance 1 – 18700
Support 2 – 18400 Resistance 2 – 18740

www.angelone.in
Technical & Derivatives Report
DEC 08, 2022
View
Nifty opened almost fall and saw some profit booking
at higher levels dragging index below 18600. Though,
we saw couple of attempts of recovery but every time
it got sold into.
FIIs were net sellers in the cash market segment to
the tune of Rs. 1242 crores. Simultaneously, in Index
futures, they sold worth Rs. 1218 crores with a
marginal rise in open interest, indicating blend of short
formation and long unwinding.
Yesterday, we could hardly see any relevant build-up
in key indices. Stronger hands added fresh shorts in
index and stock futures segment. As a result, their
index futures Long short ratio has plunged to 58% now.
In options front, put writers of 18600 strike ran for
shelter and fresh build-up was seen in 18350-18500
strike. Meanwhile, 18600 and 18800 call strikes added
massive positions, clearly suggest 18600 to act as
hurdle for today’s weekly expiry session. Interestingly,
we have concluded the session at a crucial support
zone and PCR-OI of 0.76 is hinting market is now in the
oversold trajectory. Hence, it would be interesting if
Nifty holds the 18500 on the closing basis. Looking at
the overall data, we still believe dips should be bought
and traders should keep focusing on stock-specific
trade.
Comments
The Nifty futures open interest has increased by
0.70% and Bank Nifty futures open interest has
decreased by 0.70% as the market closed at 18560.50.
The Nifty December future closed with a premium of
128.60 point against a premium of 128.60 point in the
last trading session. The January series closed at a
premium of 235.10 point.
The INDIA VIX increased from 14.04 to 14.08. At the
same time, the PCR-OI of Nifty has decreased to 0.76
from 0.96.
Few of the liquid counters where we have seen high
cost of carry are IDEA, COROMANDEL, FSL,
AMARAJABAT and GMRINFRA.
Historical Volatility
SCRIP HV
SIEMENS 33.29
HDFCAMC 35.72
HINDPETRO 41.32
PFC 34.11
COLPAL 24.71
Nifty Vs OI
17800
18000
18200
18400
18600
18800
19000
8,000
9,000
10,000
11,000
12,000
13,000
14,000
15,000
16,000
11/17 11/22 11/24 11/28 11/30 12/2 12/6
Openinterest Nifty
OI Gainers
SCRIP OI
OI
CHG. (%)
PRICE
PRICE
CHG. (%)
CROMPTON 4527000 15.46 355.45 -2.31
HDFCAMC 1602600 14.07 2273.80 3.67
SIEMENS 2239325 10.03 2905.35 5.23
DELTACORP 17927100 9.21 227.60 -3.18
ALKEM 238600 8.95 3082.40 -0.93
PFC 50133200 8.62 142.00 2.95
JUBLFOOD 14540000 7.77 538.70 -2.99
TATAMOTORS 68478375 6.49 420.10 -1.87
OI Losers
SCRIP OI
OI
CHG. (%)
PRICE
PRICE
CHG. (%)
ESCORTS 1112650 -7.44 2287.20 -0.99
RAMCOCEM 3785900 -7.05 706.35 0.83
PNB 245936000 -5.53 55.45 -0.27
APOLLOTYRE 15340500 -5.05 314.65 -1.35
WHIRLPOOL 783300 -4.73 1512.55 -0.68
HINDPETRO 22680000 -4.68 232.55 3.81
POLYCAB 1016400 -4.56 2706.65 -0.19
INDIGO 3126300 -3.74 1973.15 1.85
Put-Call Ratio
SCRIP PCR (OI) PCR (VOL)
NIFTY 0.76 0.87
BANKNIFTY 0.77 0.91
RELIANCE 0.50 0.43
ICICIBANK 0.48 0.59
INFY 0.42 0.60
www.angelone.in
Technical & Derivatives Report
DEC 08, 2022
Note: Above mentioned Bullish or Bearish Spreads in Nifty (Dec Series) are given as an information and not as a recommendation.
Nifty Spot =
1
8
560.50
FII Statistics for
December
0
7
, 2022
Detail Buy
Contracts
Open
Interest
Value
(in Cr.)
Sell
Net
CHANGE
INDEX
FUTURES
1814.76 3033.17 (1218.41) 179172 17565.79 0.80
INDEX
OPTIONS
1044803.95 1045840.53 (1036.58) 2080025 203927.11 6.35
STOCK
FUTURES
7710.56 8628.89 (918.33) 1930416 135045.79 (0.11)
STOCK
OPTIONS
7468.41 7616.94 (148.53) 137711 9834.26 1.52
Total 1061797.68
1065119.53
(3321.85) 4327324
366372.95
2.99
Turnover on
December
0
7
, 2022
Instrument
No. of
Contracts
Turnover
( in Cr. )
Change
(%)
Index
Futures
247024 24687.81 8.41
Index
Options
146757736 38850.53 20.74
Stock
Futures
653361 46347.88 -3.10
Stock
Options
2585009 3197.44 -8.61
Total
2,585,009 3197.44 6.40
Bull-Call Spreads
Action Strike Price Risk Reward BEP
Buy
18600 264.20
54.40
45.60
18654.40
Sell
18700 209.80
Buy
18600 264.20
102.85
97.15
18702.85
Sell
18800 161.35
Buy
18700 209.80
48.45 51.55 18748.45
Sell 18800 161.35
Bear
-
Put Spreads
Action Strike Price Risk Reward BEP
Buy 18600 191.05
36.55
63.45
18563.45
Sell
18500 154.50
Buy 18600 191.05
68.15
131.85
18531.85
Sell 18400 122.90
Buy
18500 154.50
31.60 68.40 18468.40
Sell 18400 122.90
Nifty Put
-
Call Analysis
,0
500,000
1000,000
1500,000
2000,000
2500,000
3000,000
3500,000
4000,000
17800 17900 18000 18100 18200 18300 18400 18500 18600 18700 18800 18900 19000 19100
Call Put

www.angelone.in
Technical & Derivatives Report
DEC 08, 2022
`
Daily Pivot Levels for Nifty Constituents
Scrips
S2
S1
PIVOT
R1 R2
ADANIENT
3,941
3,970
4,014
4,043
4,087
ADANIPORTS
874
880
891 898
909
APOLLOHOSP 4,647 4,687
4,751
4,791
4,855
ASIANPAINT
3,154
3,190
3,213
3,249
3,271
AXISBANK
893
904
911
922
929
BAJAJ-AUTO
3,579
3,607
3,658 3,686
3,737
BAJFINANCE
6,526
6,576
6,650 6,700
6,774
BAJAJFINSV
1,565
1,586
1,614
1,635
1,663
BPCL 327 331
334
337
340
BHARTIARTL
826
830
836
840
845
BRITANNIA 4,352 4,373
4,404
4,425
4,456
CIPLA 1,091 1,098
1,110
1,118
1,130
COALINDIA 227 228
230
232
234
DIVISLAB 3,311 3,325
3,342 3,355
3,373
DRREDDY 4,292 4,327
4,355 4,390
4,418
EICHERMOT 3,209 3,234
3,280 3,305 3,350
GRASIM
1,776
1,792
1,816
1,832
1,855
HCLTECH
1,094
1,100
1,108
1,114
1,123
HDFCBANK
1,597
1,604
1,611
1,618
1,625
HDFCLIFE
573
578
584
588
595
HDFC
2,631
2,646
2,664
2,679
2,697
HEROMOTOCO
2,720
2,740
2,771
2,791 2,822
HINDALCO
458
461
467
470
476
HINDUNILVR
2,631
2,669
2,694
2,733
2,758
ICICIBANK
913
917
925
930
938
INDUSINDBK 1,144 1,154
1,172 1,182
1,199
INFY
1,582
1,594
1,609
1,621
1,636
ITC
335
337
339
342
344
JSW STEEL 727 733
742
747
757
KOTAKBANK
1,889
1,900
1,916 1,927
1,943
LT 2,074 2,099
2,121 2,147
2,169
M&M
1,246
1,256
1,263
1,273
1,279
MARUTI 8,576 8,617
8,683 8,724 8,790
NESTLEIND
19,689
19,800
19,939
20,051
20,190
NTPC
169
170
173
174
176
ONGC
139
140
141
142 142
POWERGRID 218 220
222
223
226
RELIANCE
2,610
2,630
2,663
2,683
2,715
SBILIFE
1,235
1,249
1,273
1,286
1,310
SBIN
600
603
608
612
617
SUNPHARMA
1,002
1,010
1,023
1,031
1,045
TCS
3,336
3,359
3,376
3,398
3,416
TATACONSUM
792 795
801 805 810
TATAMOTORS 414 417
422
426 431
TATASTEEL
109
110
112
113
115
TECHM
1,067
1,072
1,080
1,086
1,093
TITAN 2,565 2,581
2,602
2,618
2,639
ULTRACEMCO 7,052 7,107
7,201
7,256
7,350
UPL 766 772
782
788
798
WIPRO
403
405
407
409
411

www.angelone.in
Technical & Derivatives Report
DEC 08, 2022
*
Technical and Derivatives Team:
Sameet Chavan Chief Analyst – Technical & Derivatives sameet.chavan@angelone.in
Sneha Seth Senior Analyst – Technical & Derivatives sneha.seth@angelone.in
Rajesh Bhosale Technical Analyst rajesh.bhosle@angelone.in
Osho Krishan Senior Analyst – Technical & Derivatives osho.krishan@angelone.in
Research Team Tel: 022 – 39357600 Website: www.angelone.in
For Technical Queries E-mail: technicalresearch-cso@angelone.in
For Derivatives Queries E-mail: derivatives.desk@angelone.in
DISCLAIMER
Angel One Limited (hereinafter referred to as “Angel”) is a registered Member of National Stock Exchange of India Limited, Bombay
Stock Exchange Limited and Metropolitan Stock Exchange Limited. It is also registered as a Depository Participant with CDSL and
Portfolio Manager and investment advisor with SEBI. It also has registration with AMFI as a Mutual Fund Distributor. Angel One
Limited is a registered entity with SEBI for Research Analyst in terms of SEBI (Research Analyst) Regulations, 2014 vide registration
number INH000000164. Angel or its associates has not been debarred/ suspended by SEBI or any other regulatory authority for
accessing /dealing in securities Market.
This document is solely for the personal information of the recipient, and must not be singularly used as the basis of any investment
decision. Nothing in this document should be construed as investment or financial advice. Each recipient of this document should
make such investigations as they deem necessary to arrive at an independent evaluation of an investment in the securities of the
companies referred to in this document (including the merits and risks involved), and should consult their own advisors to determine
the merits and risks of such an investment.
Angel or its associates or research analyst or his relative may have actual/beneficial ownership of 1% or more in the securities of
the subject company at the end of the month immediately preceding the date of publication of the research report. Neither Angel or
its associates nor Research Analysts or his relative has any material conflict of interest at the time of publication of research report.
Angel or its associates might have received any compensation from the companies mentioned in the report during the period
preceding twelve months from the date of this report for services in respect of managing or co-managing public offerings, corporate
finance, investment banking or merchant banking, brokerage services or other advisory service in a merger or specific transaction
in the normal course of business. Angel or its associates did not receive any compensation or other benefits from the companies
mentioned in the report or third party in connection with the research report. Neither Angel nor its research analyst entity has been
engaged in market making activity for the subject company.
Reports based on technical and derivative analysis center on studying charts of a stock's price movement, outstanding positions and
trading volume, as opposed to focusing on a company's fundamentals and, as such, may not match with a report on a company's
fundamentals. Investors are advised to refer the Fundamental and Technical Research Reports available on our website to evaluate
the contrary view, if any.
The information in this document has been printed on the basis of publicly available information, internal data and other reliable
sources believed to be true, but we do not represent that it is accurate or complete and it should not be relied on as such, as this
document is for general guidance only. Angel One Limited or any of its affiliates/ group companies shall not be in any way responsible
for any loss or damage that may arise to any person from any inadvertent error in the information contained in this report. Angel One
Limited has not independently verified all the information contained within this document. Accordingly, we cannot testify, nor make
any representation or warranty, express or implied, to the accuracy, contents or data contained within this document. While Angel
One Limited endeavors to update on a reasonable basis the information discussed in this material, there may be regulatory,
compliance, or other reasons that prevent us from doing so.
This document is being supplied to you solely for your information, and its contents, information or data may not be reproduced,
redistributed or passed on, directly or indirectly.
Neither Angel One Limited, nor its directors, employees or affiliates shall be liable for any loss or damage that may arise from or in
connection with the use of this information. Angel or its associates or Research Analyst or his relative might have financial interest
in the subject company. Research analyst has not served as an officer, director or employee of the subject company.
