Aug 08, 2022
www.angelone.in
Technical & Derivatives Report
OOOOOOOO
Nifty Bank Outlook (37921)
The BankNifty index has witnessed a lackluster move throughout the
week but managed to continue its positive closure consecutively for
the third week. The index moved in tandem with the benchmark index
and has helped to boost the overall market sentiments. The index
gained nearly 1.14 percent in the entire week and settled a tad above
37900 level.
On the technical aspect, the banking index has maintained its positive
stature as it hovers well above all its major exponential moving
averages on the daily chart. Though post the slender range bound
consolidation, one should not rule out the scope of profit booking
from the higher levels. However, the undertone is likely to favor the
bulls, wherein any minor correction could be seen as healthy and also
as an opportunity to add fresh longs. As far as levels are concerned,
37200-37000 is likely to provide a cushion for the index. While on the
flip side, 38200-38250 is expected to act as the immediate hurdle,
followed by the previous swing high of 38750 odd level in the near
period.
Key Levels
Support 1 – 37200 Resistance 1 – 38250
Support 2 – 37000 Resistance 2 – 38750
Exhibit 1: Nifty Daily Chart
Exhibit 2: Nifty Bank
Daily
Chart
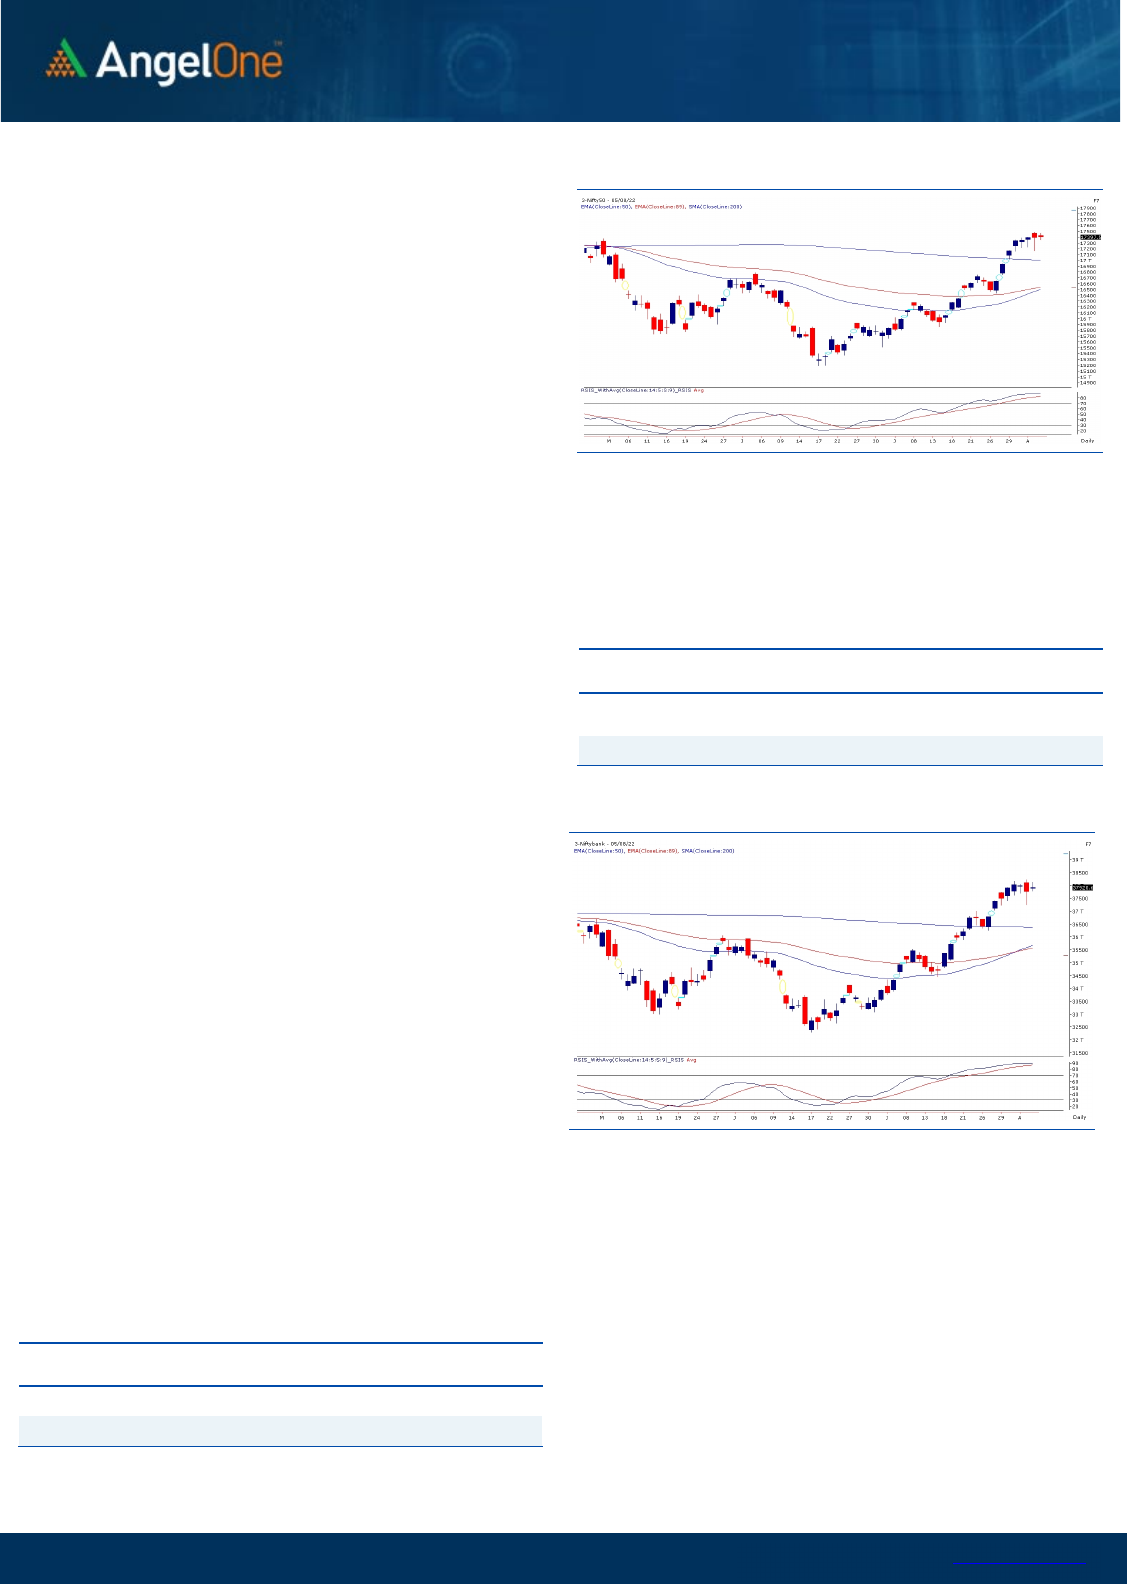
Sensex (58388) / Nifty (17397)
On Friday, Nifty started on a flat note and throughout the session, there
was no major traction. The key RBI policy turned out to be a non-event
as markets ended flat tad below 17400.
It was certainly not an easy-going week for market participants. Barring
the strong up move on Monday, we witnessed nervousness at higher
levels throughout the remaining part of the week. In fact, on the weekly
expiry session, we witnessed a massive profit booking from the
morning highs of 17490. Within a blink of any eye, we not only slid
below 17400 and 17300 but also went on to test the sub-17200 terrain.
This intimidating sell off was as good as a reality check for bulls and
hence, we have been reiterating not to become complacent at any
point this week. Fortunately, the undertone is extremely bullish and
hence, all these intraday declines were successfully getting absorbed in
the market. For this week, 17500 – 17650 remains a sturdy wall and till
the time, we do not surpass it convincingly, we would continue to see
some tentativeness at higher levels. On the flipside, 17300 followed by
17150 has now become a sacrosanct support. Considering the overall
development, we expect some consolidation to continue in this week
as well.
Traders are advised not to carry aggressive bets overnight for a while
and ideally, the strategy would be to follow one step at a time and
respect levels on either side. At the start of the last week, the stock
specific movements were a bit vibrant, but it seems to have cooled
off a bit towards the end. Hence, we need to see what all themes
emerge as we step into the new week.
Key Levels
Support 1 – 17300 Resistance 1 – 17500
Support 2 – 17150 Resistance 2 – 17650

www.angelone.in
Technical & Derivatives Report
Aug 08, 2022
View
We had a positive start for the week and the
optimism extended throughout the week to reclaim
17500. However, we did observed some profit
booking at higher levels.
FIIs were net buyers in the cash market segment to
the tune of Rs. 1606 crores. Simultaneously, in Index
futures, they bought worth Rs. 902 crores with an
increase in open interest, indicating long formation.
As far as derivatives segment is concerned, we
observed good amount of open interest addition in both
the indices; we believe majority of them were on long
side. Stronger hands continued to pour liquidity in
index equity market but added few shorts in index
futures segment. Their ‘Long Short Ratio’ declined to
55% from 60% WOW. In options front, we observed
massive writing in 17500-17600 call options.
Considering the above data points, we believe 17500-
17600 may act as a hurdle for the forthcoming week,
whereas 17100-17200 remains the strong demand
zone. Hence, until we are trading in above mentioned
range, traders are advised to prefer stock specific
approach.
Comments
The Nifty futures open interest has increased by
2.00%. and BANK Nifty futures open interest has
decreased by 3.84% as the market closed at 17397.5.
The Nifty Aug future closed with a premium of 18.65
point against a premium of 7.85 point in the last
trading session. The Sep series closed at a premium
of 87.95 point.
The INDIA VIX decreased from 19.25 to 18.91. At the
same time, the PCR-OI of Nifty has increased from
1.03 to 1.05.
Few of the liquid counters where we have seen high
cost of carry are L&TFH, ABFRL, IDEA, PIIND and
METROPOLIS.
Historical Volatility
SCRIP HV
ZYDUSLIFE 35.16
IPCALAB 34.52
GUJGASLTD 46.56
LUPIN 37.92
CIPLA 31.77
Nifty Vs OI
15600
15800
16000
16200
16400
16600
16800
17000
17200
17400
17600
8,000
9,000
10,000
11,000
12,000
13,000
14,000
15,000
16,000
7/19 7/21 7/25 7/27 8/29 7/2 7/5
Openinterest Nifty
OI Gainers
SCRIP OI
OI
CHG. (%)
PRICE
PRICE
CHG. (%)
GAIL 45865900 43.99 140.10 -5.38
BALRAMCHIN 10673600 31.14 364.50 -3.92
CROMPTON 3784500 28.99 388.85 -2.82
BALKRISIND 1855500 25.69 2319.95 -6.88
ICICIPRULI 8062500 20.71 560.15 2.76
DELTACORP 20219300 16.47 194.90 -0.46
JKCEMENT 463000 13.76 2536.65 3.27
PEL 4791600 8.18 1731.85 0.07
OI Losers
SCRIP OI
OI
CHG. (%)
PRICE
PRICE
CHG. (%)
BEL 26421400 -10.34 284.15 -3.00
NAM-INDIA 2505600 -8.26 299.55 0.27
ASTRAL 658900 -7.13 1963.30 1.31
MUTHOOTFIN 4564125 -7.02 1101.30 3.69
ALKEM 424000 -6.03 3151.75 0.32
IOC 77814750 -4.86 71.20 2.61
LAURUSLABS 5882400 -4.79 543.85 0.53
JUBLFOOD 10321250 -4.77 569.30 1.27
Put-Call Ratio
SCRIP PCR (OI) PCR (VOL)
NIFTY 1.05 0.88
BANKNIFTY 0.91 0.91
RELIANCE 0.51 0.41
ICICIBANK 0.89 0.45
INFY 0.83 0.58
www.angelone.in
Technical & Derivatives Report
Aug 08, 2022
Note: Above mentioned Bullish or Bearish Spreads in Nifty (Aug Series) are given as an information and not as a recommendation.
Nifty Spot =
17,
3
97.50
FII Statistics for
August
0
5
, 2022
Detail Buy
Contracts
Open
Interest
Value
(in Cr.)
Sell
Net
CHANGE
INDEX
FUTURES
3643.03 2741.09 901.94
145724 13091.28 6.05
INDEX
OPTIONS
583811.67 586113.29 (2301.62) 1054583 93739.41 24.76
STOCK
FUTURES
12299.14 11448.46 850.68
2145589 146525.96 (0.11)
STOCK
OPTIONS
7186.46 7253.78 (67.32) 114743 7966.45 8.86
Total 606940.30
607556.62
(616.32) 3460639
261323.10
6.94
Turnover on
August
0
5
, 2022
Instrument
No. of
Contracts
Turnov
er
( in Cr.
)
Change
(%)
Index Futures
370336 33586.23 -33.32
Index Options
77870713 7119982.61 -76.95
Stock Futures
877204 60415.78 -7.18
Stock Options
3136521 229009.97 -1.22
Total
3,136,521 229009.97 -76.17
Bull-Call Spreads
Action Strike Price Risk Reward BEP
Buy
17400 272.70
55.55
44.45
17455.55
Sell
17500 217.15
Buy
17400 272.70
102.70
97.30
17502.70
Sell
17600 170.00
Buy
17500 217.15
47.15 52.85 17547.15
Sell
17600 170.00
Bear
-
Put Spreads
Action Strike Price Risk Reward BEP
Buy 17400 256.85
39.90
60.10
17360.10
Sell
17300 216.95
Buy 17400 256.85
74.05
125.95
17325.95
Sell 17200 182.80
Buy
17300 216.95
34.15 65.85 17265.85
Sell
17200 182.80
Nifty Put
-
Call Analysis
,0
500,000
1000,000
1500,000
2000,000
2500,000
16700 16800 16900 17000 17100 17200 17300 17400 17500 17600 17700 17800 17900 18000
Call Put

www.angelone.in
Technical & Derivatives Report
Aug 08, 2022
`
Daily Pivot Levels for Nifty Constituents
Scrips
S2
S1
PIVOT
R1 R2
ADANIPORTS
798
804
811
817
825
APOLLOHOSP 4,290 4,332
4,377
4,419
4,464
ASIANPAINT 3,432 3,453
3,472 3,493
3,513
AXISBANK
717
723
727
733
737
BAJAJ-AUTO
3,970
3,991
4,015
4,037
4,060
BAJFINANCE 7,224 7,265
7,316
7,356
7,408
BAJAJFINSV
14,892
14,989
15,120
15,217
15,348
BPCL
330
333
335
338
340
BHARTIARTL
690
697
703
710
717
BRITANNIA
3,577
3,633
3,734
3,790
3,891
CIPLA
1,023
1,029
1,037
1,043
1,051
COALINDIA
204
206
208
211
213
DIVISLAB
3,871
3,892
3,921
3,941
3,970
DRREDDY 4,115 4,136
4,165
4,186
4,215
EICHERMOT 2,998 3,044
3,112
3,158
3,226
GRASIM
1,565
1,582
1,599
1,615
1,633
HCLTECH
949
954
959
963
969
HDFCBANK 1,413 1,420
1,428
1,436
1,444
HDFCLIFE 531 535
540
544
549
HDFC 2,324 2,340
2,352
2,367
2,380
HEROMOTOCO
2,732
2,751
2,781
2,800 2,829
HINDALCO
398
404
415 422
433
HINDUNILVR
2,613
2,629
2,644
2,660
2,674
ICICIBANK 816 827
834
845
852
INDUSINDBK 1,018 1,027
1,043
1,052
1,067
INFY 1,591 1,604
1,615 1,627
1,638
ITC
308
309
311
312
313
JSW STEEL
660
663
669
672
678
KOTAKBANK
1,808
1,821
1,836
1,848
1,863
LT
1,758
1,773
1,790
1,805
1,822
M&M 1,201 1,219
1,249
1,266
1,296
MARUTI 8,704 8,772
8,879 8,948
9,054
NESTLEIND
19,599
19,760
19,890
20,051
20,181
NTPC
151
153
155 158
159
ONGC
131
134
136
139
141
POWERGRID
217
220
222
226
228
RELIANCE 2,495 2,514
2,547
2,566
2,598
SBILIFE
1,245
1,256
1,272
1,283
1,299
SHREECEM 20,495 20,866
21,072
21,443
21,648
SBIN
520
526
534
540
548
SUNPHARMA
902
909
919
926
936
TCS 3,344 3,354
3,366
3,376
3,388
TATACONSUM
775 780
787
791
798
TATAMOTORS
458
462
467
471
476
TATASTEEL
106
107
108
109
110
TECHM 1,041 1,050
1,059
1,067
1,076
TITAN 2,386 2,409
2,441
2,464 2,496
ULTRACEMCO
6,510
6,643
6,721
6,853
6,932
UPL 722 733
741 752
760
WIPRO
434
437
439
443
445
www.angelone.in
Technical & Derivatives Report
Aug 08, 2022
*
Technical and Derivatives Team:
Sameet Chavan Chief Analyst – Technical & Derivatives sameet.chavan@angelone.in
Sneha Seth Senior Analyst – Technical & Derivatives sneha.seth@angelone.in
Rajesh Bhosale Technical Analyst rajesh.bhosle@angelone.in
Osho Krishan Senior Analyst – Technical & Derivatives osho.krishan@angelone.in
Research Team Tel: 022 – 39357600 (Extn. 6844) Website: www.angelone.in
For Technical Queries E-mail: technicalresearch-cso@angelone.in
For Derivatives Queries E-mail: derivatives.desk@angelone.in
DISCLAIMER
Angel One Limited (hereinafter referred to as “Angel”) is a registered Member of National Stock Exchange of India Limited, Bombay
Stock Exchange Limited and Metropolitan Stock Exchange Limited. It is also registered as a Depository Participant with CDSL and
Portfolio Manager and investment advisor with SEBI. It also has registration with AMFI as a Mutual Fund Distributor. Angel One
Limited is a registered entity with SEBI for Research Analyst in terms of SEBI (Research Analyst) Regulations, 2014 vide registration
number INH000000164. Angel or its associates has not been debarred/ suspended by SEBI or any other regulatory authority for
accessing /dealing in securities Market.
This document is solely for the personal information of the recipient, and must not be singularly used as the basis of any investment
decision. Nothing in this document should be construed as investment or financial advice. Each recipient of this document should
make such investigations as they deem necessary to arrive at an independent evaluation of an investment in the securities of the
companies referred to in this document (including the merits and risks involved), and should consult their own advisors to determine
the merits and risks of such an investment.
Angel or its associates or research analyst or his relative may have actual/beneficial ownership of 1% or more in the securities of
the subject company at the end of the month immediately preceding the date of publication of the research report. Neither Angel or
its associates nor Research Analysts or his relative has any material conflict of interest at the time of publication of research report.
Angel or its associates might have received any compensation from the companies mentioned in the report during the period
preceding twelve months from the date of this report for services in respect of managing or co-managing public offerings, corporate
finance, investment banking or merchant banking, brokerage services or other advisory service in a merger or specific transaction
in the normal course of business. Angel or its associates did not receive any compensation or other benefits from the companies
mentioned in the report or third party in connection with the research report. Neither Angel nor its research analyst entity has been
engaged in market making activity for the subject company.
Reports based on technical and derivative analysis center on studying charts of a stock's price movement, outstanding positions and
trading volume, as opposed to focusing on a company's fundamentals and, as such, may not match with a report on a company's
fundamentals. Investors are advised to refer the Fundamental and Technical Research Reports available on our website to evaluate
the contrary view, if any.
The information in this document has been printed on the basis of publicly available information, internal data and other reliable
sources believed to be true, but we do not represent that it is accurate or complete and it should not be relied on as such, as this
document is for general guidance only. Angel One Limited or any of its affiliates/ group companies shall not be in any way responsible
for any loss or damage that may arise to any person from any inadvertent error in the information contained in this report. Angel One
Limited has not independently verified all the information contained within this document. Accordingly, we cannot testify, nor make
any representation or warranty, express or implied, to the accuracy, contents or data contained within this document. While Angel
One Limited endeavors to update on a reasonable basis the information discussed in this material, there may be regulatory,
compliance, or other reasons that prevent us from doing so.
This document is being supplied to you solely for your information, and its contents, information or data may not be reproduced,
redistributed or passed on, directly or indirectly.
Neither Angel One Limited, nor its directors, employees or affiliates shall be liable for any loss or damage that may arise from or in
connection with the use of this information. Angel or its associates or Research Analyst or his relative might have financial interest
in the subject company. Research analyst has not served as an officer, director or employee of the subject company.
