February 08, 2022
www.angelone.in
Technical & Derivatives Report
Nifty
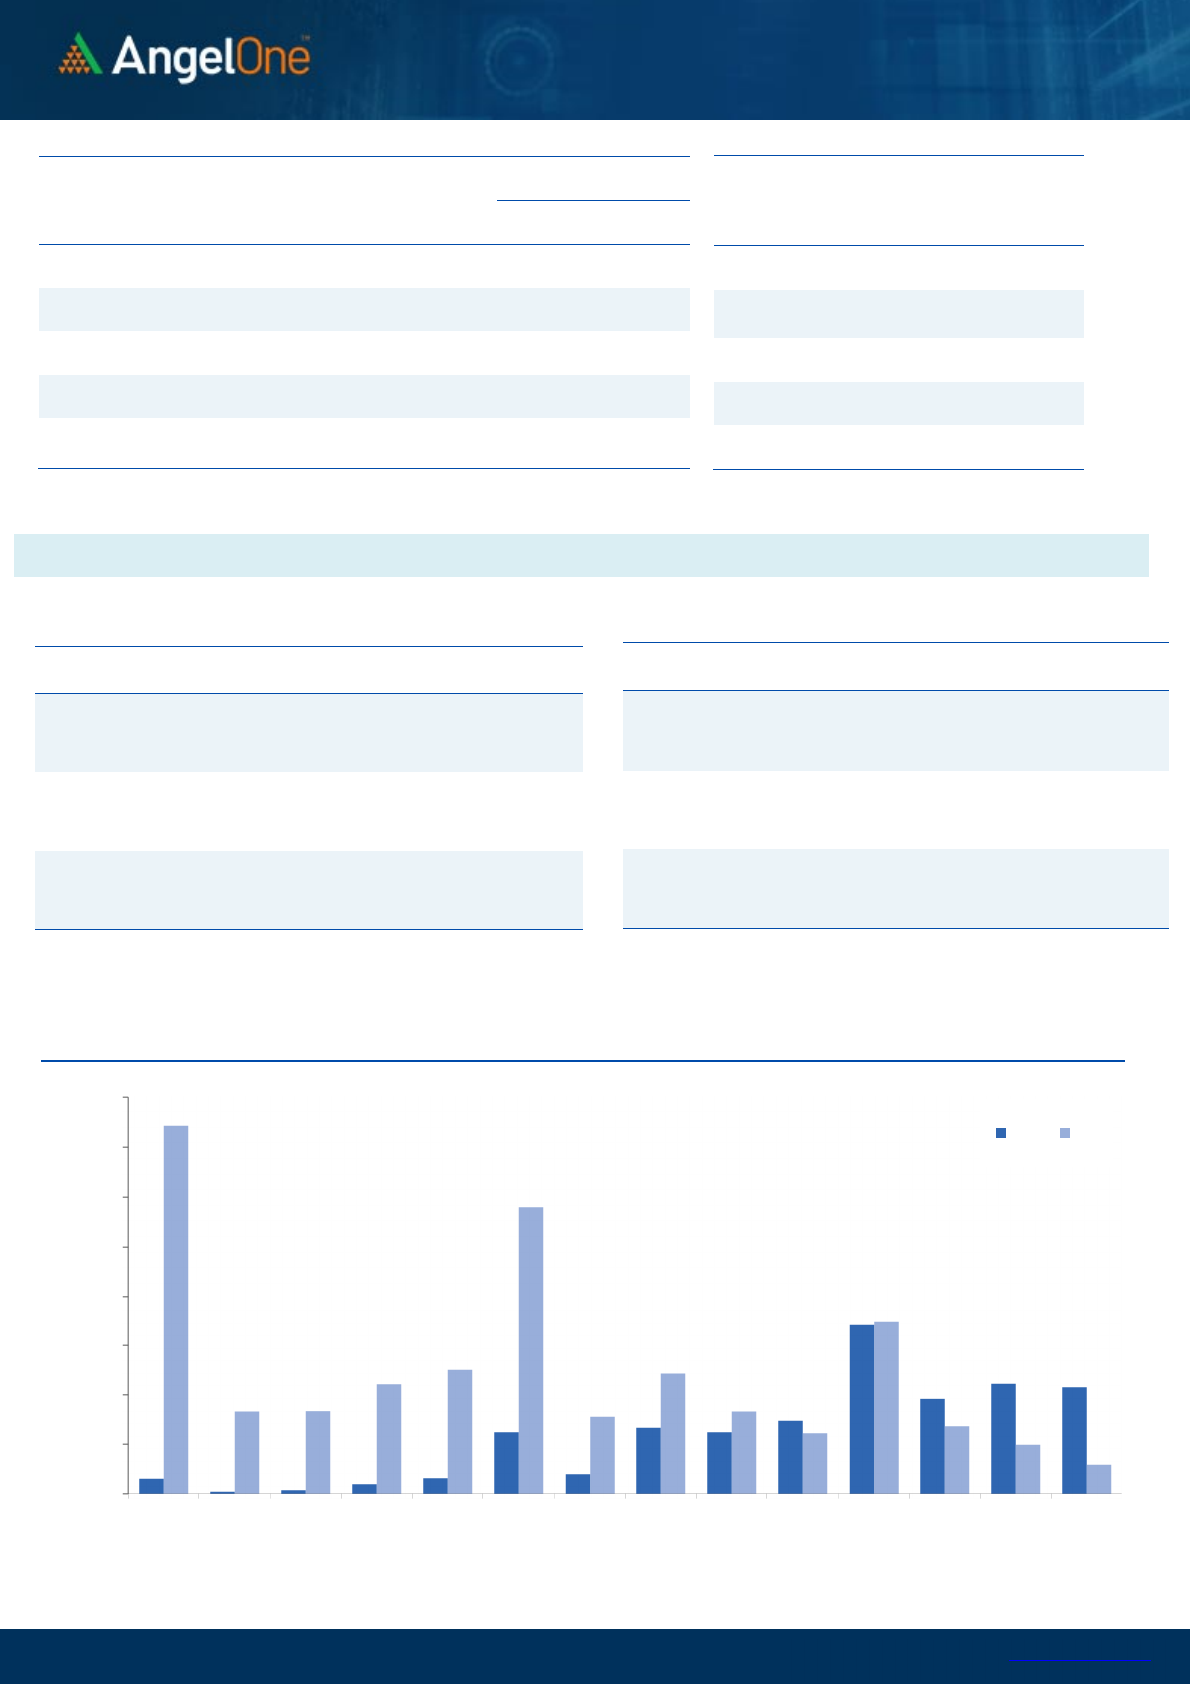
Bank Outlook
-
(37995)
The Bank Nifty index has corrected over 2.05 percent and has
underperformed the benchmark index in the last trading
session. The turmoil in the index has dampened the overall
sentiments as the three days consecutive sell-off led by
financials and private sector banks have raised the concerning
factor in the market.
On the technical aspect, the index has plunged below the mean
of the Bollinger band and is a tad above the 21 DEMA on the daily
time frame, suggesting a cautious sign. The immediate and
crucial support is placed at the 37500 mark, sustenance above
which could trigger some traction in the index else, a dent could
be seen in the coming days. In contrast, a closure above 38700-
38800 zone in a decisive manner could only trigger the bulls to
take control of the index.
Going forward, the PSU banks index has added some traction in
the last couple of trading sessions and a watch over the counter
would be suggested ahead of the MPC meet outcome, due this
week. Also, looking at the volatility outburst, it is advisable to
stay selective and look out for stock-specific actions rather than
any thematic movement.
.Key Levels
Support 1 – 37500 Resistance 1 – 38700
Support 2 – 37000 Resistance 2 – 38800
Exhibit 1: Nifty Daily Chart
Exhibit 2: Nifty Bank D
aily Chart
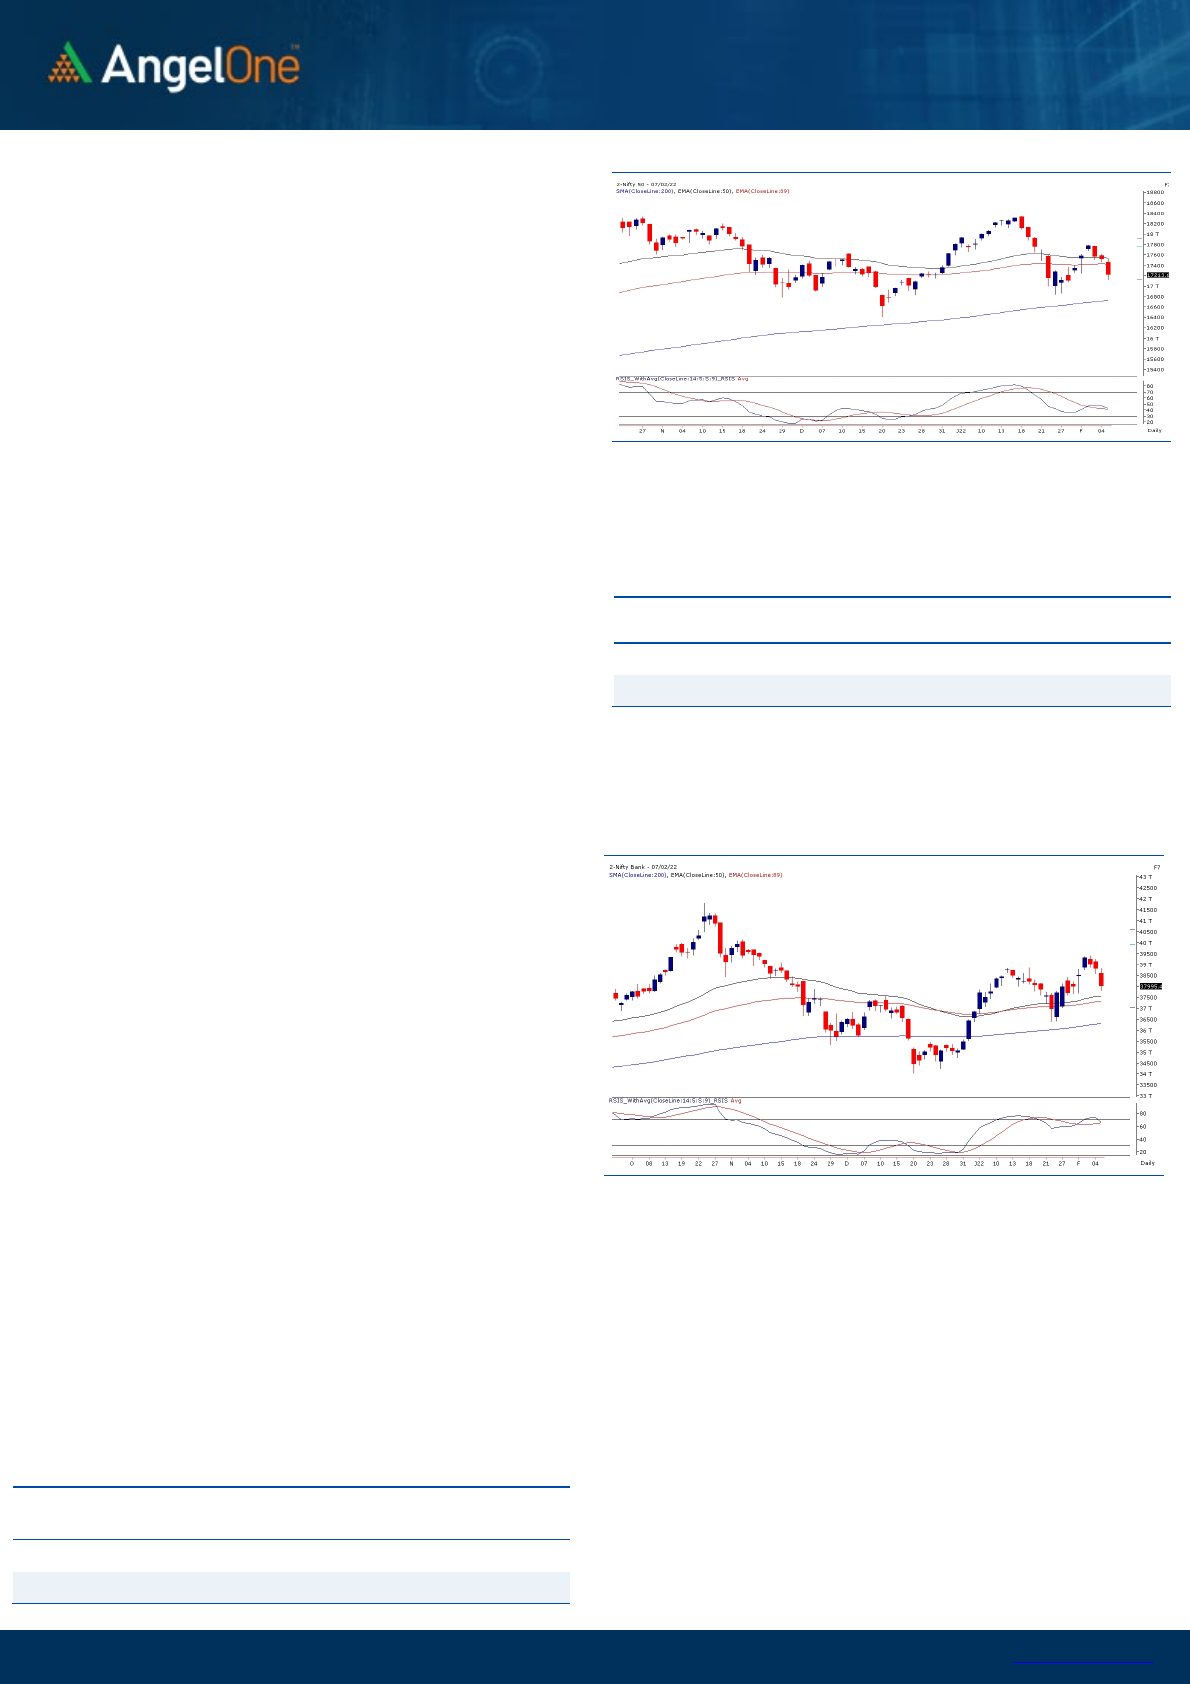
Sensex (57621) / Nifty (17214)
Our domestic market started the day on a weak note amid the
mixed Asian bourses, and the sell-off further aggravated with no
sign of respite in the benchmark index. A strong sell-off among
the market participants further dampened the sentiments.
Eventually, Nifty ended the session on a negative note with a loss
of around 1.73 percent for the third consecutive session to settle
at 17214 levels.
The benchmark index slipped below the low of the Budget day
ahead of the outcome of the RBI monetary policy due in the week,
suggesting a sign of cautiousness in the market. A significant
correction was seen among the selective blue chips wherein the
bears easily shrugged off all the technical supports. As far as
levels are concerned, the 17000 mark is the crucial support for
the benchmark index followed by the swing low of 16836, while
any breach below this could trigger a major concern for the
investors. On the higher end, the 50 percent Fibonacci is
expected to act as the immediate resistance zone placed around
17380 levels, followed by 17500 in the near future.
.
Looking at the eventful week of MPC outcome, the global
bourses, the FIIs activities, and the burst in the volatility index,
it is advisable to stay light and selective while taking positions
in the market.
Key Levels
Support 1 – 17000 Resistance 1 – 17380
Support 2 – 16836 Resistance 2 – 17500

www.angelone.in
Technical & Derivatives Report
February 08, 2022
View
The week started on a negative note and as the day
progressed the sell-off got extended throughout the
session. Eventually, post some modest recovery in the
fag end Nifty ended with a loss of 1.73% at 17213.60.
FIIs were net sellers in the cash market segment to
the tune of Rs. 1157 crores. In index futures, they sold
worth Rs. 1067 crores with rise in open interest
indicating short formations in yesterday’s session.
As our markets slipped lower fresh short formation was
seen in both the key indices. Strong hands were sellers
in cash as well as in the Index futures segment. As far
as option chain analysis is concerned, PUT writers ran
to cover their positions, and now the highest build up is
seen at the 17000 PUT and this is also a key
psychological level. On the flip side, 17500 CALL has the
highest build up indicating resistance level. The PCR-OI
has now slipped to 0.70 and even though the bears have
the upper hand we sense the market is approaching
oversold zone hence one should avoid aggressive short
bets and rather should focus on stock specific approach
that may show signs of a strong bounce back.
Comments
The Nifty futures open interest has increased by 7.21%.
and BANK Nifty futures open interest has increased by
0.64% as market closed at 17213.60 levels.
The Nifty February future closed with a premium of 4.7
point against a premium of 13.31 point in last trading
session. The March series closed at a premium of 66.05
point.
The INDIA VIX increased from 18.89 to 20.44. At the
same time, the PCR-OI of Nifty has decreased from 0.90
to 0.70.
Few of the liquid counters where we have seen high
cost of carry are PNB, VEDL, IDFC, IDEA, AND
CANFINHOME.
Historical Volatility
SCRIP HV
TORNTPOWER
40.87
GNFC
57.26
LUPIN
39.39
INDIGO
48.75
HDFCBANK
30.41
Nifty Vs OI
16400
16600
16800
17000
17200
17400
17600
17800
18000
18200
18400
18600
,0
2,000
4,000
6,000
8,000
10,000
12,000
14,000
1-14 1-18 1-20 1-24 1-27 1-31 2-2 2-4
(`000)
Openinterest Nifty
OI Gainers
SCRIP OI
OI
CHG. (%)
PRICE
PRICE
CHG. (%)
AARTIIND
3181550 29.88 999.85 -1.86
LUPIN
10140500 25.00 804.70 -7.67
TORNTPOWER
4501500 18.57 524.15 -10.21
GNFC
3057600 18.01 515.50 12.81
HONAUT
9690 15.56 44991.60 1.05
HINDCOPPER
16972100 15.24 141.45 2.79
MFSL
1756950 15.07 869.30 -1.89
ESCORTS
7054300 8.66 1823.85 -0.66
OI Losers
SCRIP OI
OI
CHG. (%)
PRICE
PRICE
CHG. (%)
FEDERALBNK
86340000 -11.52 99.50 0.50
MARICO
8263000 -7.46 511.40 0.09
GUJGASLTD
2093750 -6.58 690.35 1.14
ABFRL
15412800 -6.14 290.75 -1.69
JKCEMENT
288225 -5.62 3329.75 -0.37
SIEMENS
1586475 -5.53 2415.75 -0.63
PERSISTENT
395850 -5.04 4232.75 -1.87
RECLTD
32046000 -4.85 137.20 -2.80
Put-Call Ratio
SCRIP PCR (OI) PCR (VOL)
NIFTY
0.70 0.80
BANKNIFTY
0.58 1.01
RELIANCE
0.42 0.35
ICICIBANK
0.44 0.56
INFY
0.42 0.41
www.angelone.in
Technical & Derivatives Report
February 08, 2022
Note: Above mentioned Bullish or Bearish Spreads in Nifty (February Series) are given as an information and not as a recommendation.
Nifty Spot = 17213.60
FII Statistics for
February
07
, 2021
Detail Buy
Net Contracts
Open Interest
Sell
Value
(in Cr.)
Change
INDEX
FUTURES
4461.91 5529.39 (1067.48) 155476 13719.97 7.52
INDEX
OPTIONS
655347.95 653969.61 1378.34
1505693 133986.19 12.58
STOCK
FUTURES
15825.89 15660.87 165.02
1876515 129708.42 1.34
STOCK
OPTIONS
15767.72 16123.41 (355.69) 275824 20340.39 7.22
Total
691403.47
691283.28
120.19
3813508
297754.97
6.19
Turnover
on
February
07
, 2021
Instrument
No. of
Contracts
Turnover
( in Cr. )
Change
(%)
Index Futures
415866 37700.84 1.58
Index Options
74471496 6868959.43
29.34
Stock Futures
866317 63199.71 4.66
Stock Options
2957409 226570.64 13.27
Total
7,87,11,088
7196430.62
28.32
Bull
-
Call Spreads
Action Strike Price Risk Reward BEP
Buy
17200 294.00
51.10 48.90 17251.10
Sell
17300 242.90
Buy
17200 294.00
94.80 105.20 17294.80
Sell
17400 199.20
Buy
17300 242.90
43.70 56.30 17343.70
Sell
17400 199.20
Bear
-
Put Spreads
Action Strike Price Risk Reward BEP
Buy
17200 276.40
43.45 56.55 17156.55
Sell
17100 232.95
Buy
17200 276.40
80.80 119.20 17119.20
Sell
17000 195.60
Buy
17100 232.95
37.35 62.65 17062.65
Sell
17000 195.60
Nifty Put
-
Call Analysis
,0
500,000
1000,000
1500,000
2000,000
2500,000
3000,000
3500,000
4000,000
16500 16600 16700 16800 16900 17000 17100 17200 17300 17400 17500 17600 17700 17800
Call Put

www.angelone.in
Technical & Derivatives Report
February 08, 2022
`
Daily Pivot Levels for Nifty Constituents
Scrips
S2
S1
PIVOT
R1
R2
ADANIPORTS 703 709
719 726 736
ASIANPAINT 3,082 3,128
3,190 3,236 3,298
AXISBANK 773 781
792 801 812
BAJAJ-AUTO 3,403 3,439
3,505 3,541 3,607
BAJFINANCE 6,708 6,819
6,992 7,103 7,276
BAJAJFINSV 15,194 15,453
15,908 16,167 16,623
BPCL 365 369
374 377 382
BHARTIARTL 688 697
709 718 729
BRITANNIA 3,350 3,399
3,489 3,539 3,629
CIPLA 916 925
936 945 956
COALINDIA 158 159
161 163 165
DIVISLAB 4,074 4,138
4,242 4,305 4,409
DRREDDY 4,203 4,256
4,303 4,356 4,403
EICHERMOT 2,519 2,560
2,603 2,644 2,687
GRASIM 1,671 1,692
1,721 1,741 1,770
HCLTECH 1,133 1,145
1,158 1,170 1,184
HDFCBANK 1,423 1,446
1,482 1,505 1,541
HDFCLIFE 585 594
609 618 633
HDFC 2,361 2,395
2,453 2,487 2,546
HEROMOTOCO 2,560 2,604
2,669 2,713 2,778
HINDALCO 511 517
525 531 539
HINDUNILVR 2,191 2,224
2,270 2,304 2,350
ICICIBANK 767 777
791 800 815
IOC 121 122
123 124 125
INDUSINDBK 909 921
940 952 971
INFY 1,678 1,696
1,714 1,733 1,751
ITC 225 228
231 234 237
JSW STEEL 633 642
654 663 676
KOTAKBANK 1,776 1,802
1,846 1,872 1,916
LT 1,829 1,857
1,902 1,930 1,975
M&M 810 820
832 842 855
MARUTI 8,294 8,403
8,509 8,618 8,724
NESTLEIND 17,626 17,849
18,135 18,358 18,644
NTPC 133 134
135 136 137
ONGC 167 170
172 174 176
POWERGRID 208 211
213 215 217
RELIANCE 2,275 2,296
2,326 2,348 2,378
SBILIFE 1,109 1,127
1,149 1,167 1,189
SHREECEM 23,939 24,402
24,764 25,227 25,589
SBIN 512 523
536 546 560
SUNPHARMA 868 877
889 899 911
TCS 3,713 3,746
3,789 3,822 3,865
TATACONSUM
680 692
715 727 749
TATAMOTORS 485 490
497 502 509
TATASTEEL 1,133 1,158
1,186 1,211 1,240
TECHM 1,416 1,430
1,448 1,462 1,480
TITAN 2,322 2,365
2,432 2,476 2,542
ULTRACEMCO 7,294 7,382
7,450 7,538 7,607
UPL 736 746
761 771 785
WIPRO 544 550
562 569 580

www.angelone.in
Technical & Derivatives Report
February 08, 2022
*
Technical and Derivatives Team:
Sameet Chavan
Chief Analyst
–
Technical & Deriv
atives
sameet.chavan@angelone.in
Sneha Seth Derivatives Analyst sneha.seth@angelone.in
Rajesh Bhosale Technical Analyst rajesh.bhosle@angelone.in
Osho Krishan Senior Analyst – Technical & Derivatives osho.krishan@angelone.in
Research Team Tel: 022 – 39357600 (Extn. 6844) Website: www.angelone.in
For Technical Queries E-mail: technicalresearch-cso@angelone.in
For Derivatives Queries E-mail: derivatives.desk@angelone.in
DISCLAIMER
Angel One Limited (hereinafter referred to as “Angel”) is a registered Member of National Stock Exchange of India Limited, Bombay
Stock Exchange Limited and Metropolitan Stock Exchange Limited. It is also registered as a Depository Participant with CDSL and
Portfolio Manager and investment advisor with SEBI. It also has registration with AMFI as a Mutual Fund Distributor. Angel One
Limited is a registered entity with SEBI for Research Analyst in terms of SEBI (Research Analyst) Regulations, 2014 vide registration
number INH000000164. Angel or its associates has not been debarred/ suspended by SEBI or any other regulatory authority for
accessing /dealing in securities Market.
This document is solely for the personal information of the recipient, and must not be singularly used as the basis of any investment
decision. Nothing in this document should be construed as investment or financial advice. Each recipient of this document should
make such investigations as they deem necessary to arrive at an independent evaluation of an investment in the securities of the
companies referred to in this document (including the merits and risks involved), and should consult their own advisors to determine
the merits and risks of such an investment.
Angel or its associates or research analyst or his relative may have actual/beneficial ownership of 1% or more in the securities of
the subject company at the end of the month immediately preceding the date of publication of the research report. Neither Angel or
its associates nor Research Analysts or his relative has any material conflict of interest at the time of publication of research report.
Angel or its associates might have received any compensation from the companies mentioned in the report during the period
preceding twelve months from the date of this report for services in respect of managing or co-managing public offerings, corporate
finance, investment banking or merchant banking, brokerage services or other advisory service in a merger or specific transaction
in the normal course of business. Angel or its associates did not receive any compensation or other benefits from the companies
mentioned in the report or third party in connection with the research report. Neither Angel nor its research analyst entity has been
engaged in market making activity for the subject company.
Reports based on technical and derivative analysis center on studying charts of a stock's price movement, outstanding positions and
trading volume, as opposed to focusing on a company's fundamentals and, as such, may not match with a report on a company's
fundamentals. Investors are advised to refer the Fundamental and Technical Research Reports available on our website to evaluate
the contrary view, if any.
The information in this document has been printed on the basis of publicly available information, internal data and other reliable
sources believed to be true, but we do not represent that it is accurate or complete and it should not be relied on as such, as this
document is for general guidance only. Angel One Limited or any of its affiliates/ group companies shall not be in any way responsible
for any loss or damage that may arise to any person from any inadvertent error in the information contained in this report. Angel One
Limited has not independently verified all the information contained within this document. Accordingly, we cannot testify, nor make
any representation or warranty, express or implied, to the accuracy, contents or data contained within this document. While Angel
One Limited endeavors to update on a reasonable basis the information discussed in this material, there may be regulatory,
compliance, or other reasons that prevent us from doing so.
This document is being supplied to you solely for your information, and its contents, information or data may not be reproduced,
redistributed or passed on, directly or indirectly.
Neither Angel One Limited, nor its directors, employees or affiliates shall be liable for any loss or damage that may arise from or in
connection with the use of this information. Angel or its associates or Research Analyst or his relative might have financial interest
in the subject company. Research analyst has not served as an officer, director or employee of the subject company.
