DEC 07, 2022
www.angelone.in
Technical & Derivatives Report
xOOOOOOOO
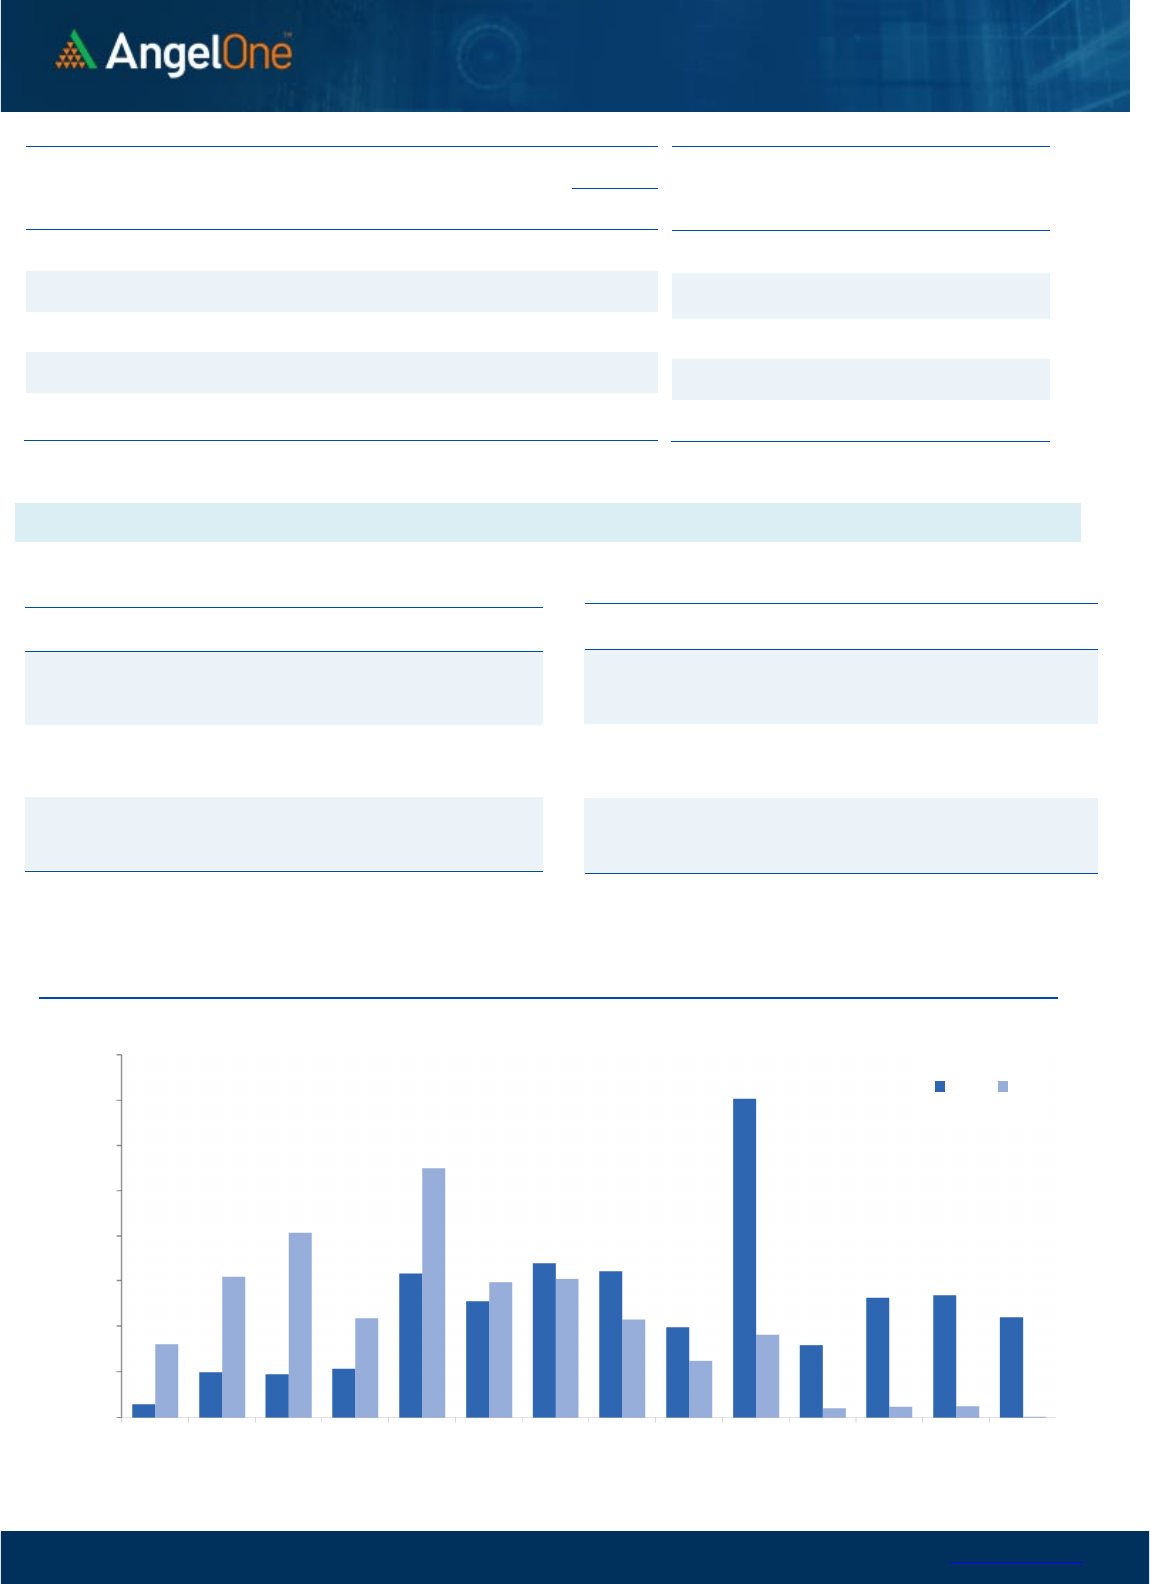
Nifty Bank
Outlook (
43
1
3
9
)
The BANKNIFTY too had a muted start for the session in line with
benchmark index. As the day progressed, we witnessed a gradual
decline in banking counters. In absence of any recovery, the
banking index ended the session with more than four tenths of a
percent cut.
On Monday, banking space was the lone saviour and yesterday it
became the major culprit. However structurally we do not see any
major damage in the index. As far as levels are concerned, 43000 -
42800 remains to be a key support zone; whereas on the flipside,
43300 - 43500 has now become a strong cluster of hurdles. Traders
are advised to remain positive as long as the important support
base remains defended. Even though there was lack of traction in
Bank Nifty, real action was seen in individual stocks and the PSU
banking stocks continued with their recent outperformance. Going
ahead as well, traders should focus on stock specific trades on the
key RBI policy day.
Key Levels
Support 1 – 43000 Resistance 1 – 43300
Support 2 – 42800 Resistance 2 – 43500
Exhibit 1: Nifty
Daily
Chart
Exhibit 2: Nifty Bank
Daily
Chart
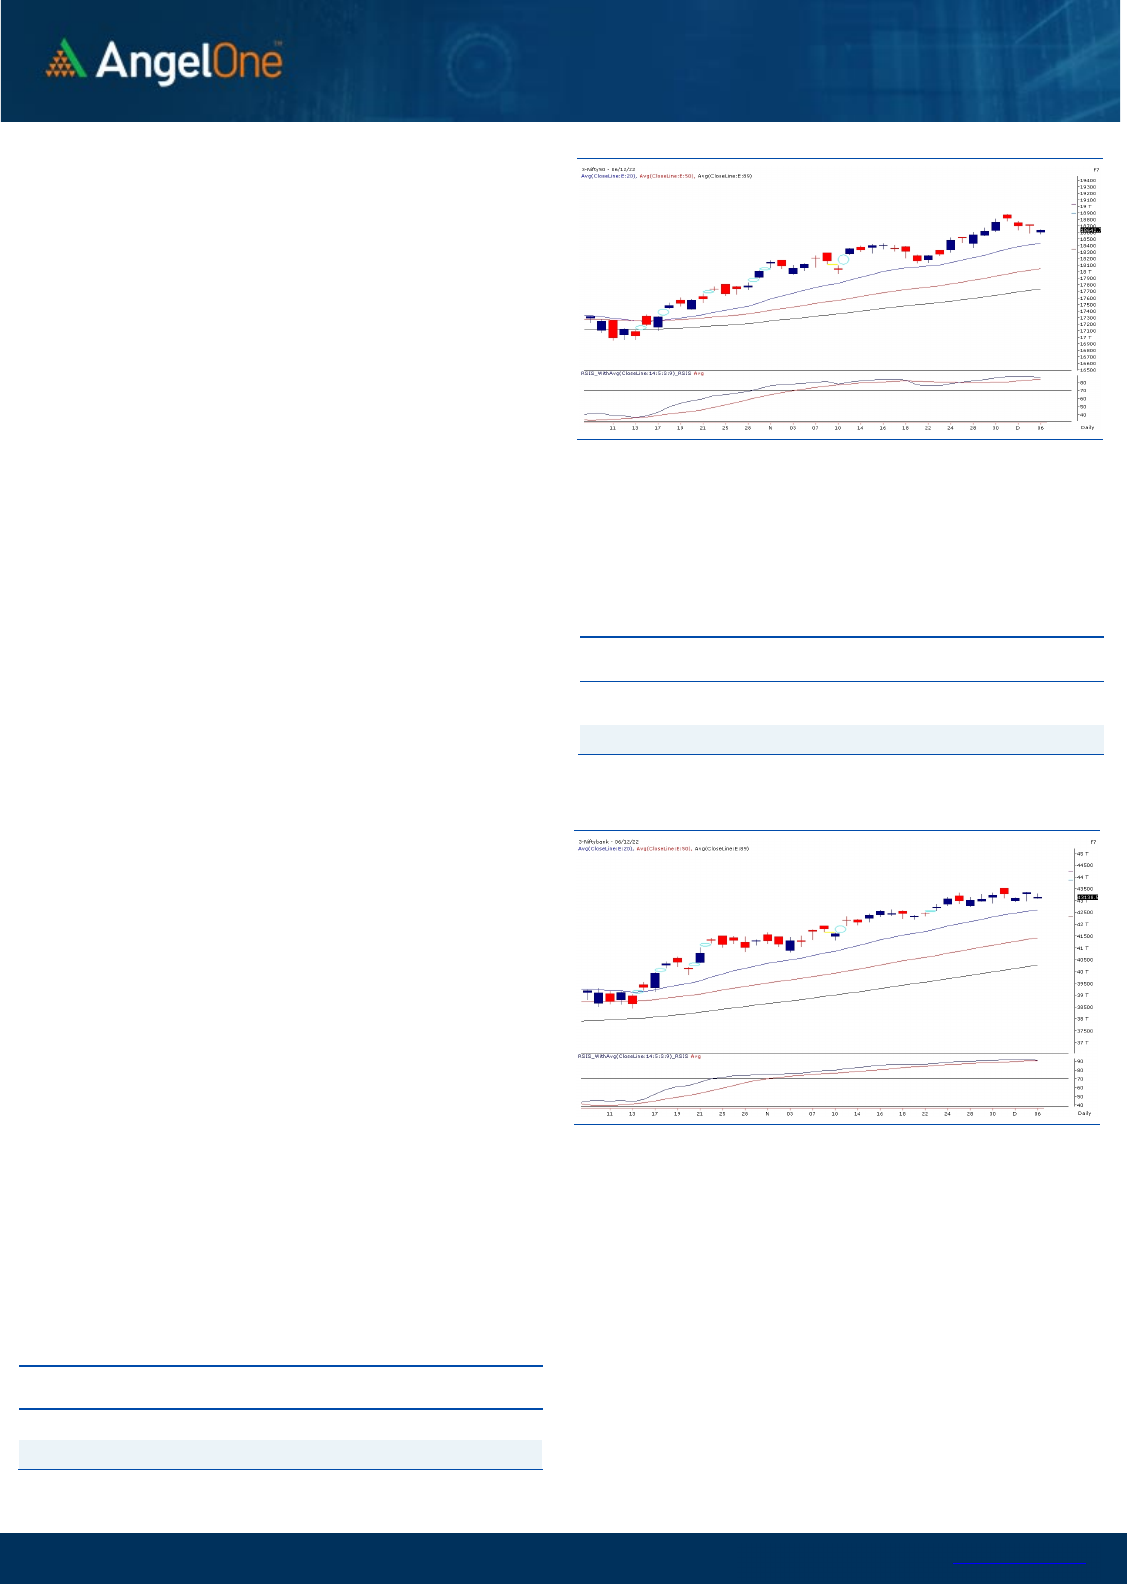
Sensex (62626) / Nifty (18643)
The weakness among the global peers led to a timid opening in our
equity market. The benchmark index Nifty50 started the day with a
small gap down and hustled in a narrow range at the lower end
throughout the session. Amidst the lackluster session, the bulls
showed their comeback in the penultimate hour and made a
modest recovery to pare down some of the initial losses. The Nifty
concluded near the day’s high, shedding nearly 0.30 percent, and
settled a tad below the 18650 level.
On the technical front, the support of 18600 once again proved its
mettle as bulls firmly retaliated to safeguard the same. We allude to
our previous commentary to have the buy on dip and sell on rise
approach, which seems perfectly aligned with the current market
conditions. As far as levels are concerned, till the time the
sacrosanct support of 18600-18500 is firmly withheld, there is no
sign of worry for the participants. While on the higher end, a series
of resistances could be seen starting from 18700-18750 to 18800-
18850 in the comparable period.
Going forward, the index is likely to hover within the mentioned
range and meanwhile, one should keep focusing on the stock-
specific front for trading opportunities. Simultaneously, all eyes
would be on the upcoming RBI policy outcome that might dictate
the near-term trend for the market. Hence, we advocate to stay
abreast with domestic as well as global developments.
Key Levels
Support 1 – 18600 Resistance 1 – 18750
Support 2 – 18500 Resistance 2 – 18850

www.angelone.in
Technical & Derivatives Report
DEC 07, 2022
View
We had a gap down start on Tuesday, which was
followed by consolidation around the vicinity of 18600
for major part of the day. Final hour, some recovery
was seen to trim initial losses and conclude the day
with a cut of 0.31%.
FIIs were net sellers in the cash market segment to
the tune of Rs. 635 crores. Simultaneously, in Index
futures, they sold worth Rs. 1533 crores with a rise in
open interest, indicating formation of bearish bets.
Yesterday, we could hardly see any fresh build-up in
key indices. Stronger hands added fresh shorts in
index and stock futures segment. In options front, we
witnessed huge pile up of positions in 18600 and 18550
put strikes, which is an encouraging sign. Meanwhile,
18600 and 18800 call strikes also added some
positions. It was a second straight session wherein
market rebounded from the vicinity of 18600, which is
certainly making 18550-18600 zone a strong demand
zone. On the higher side, 18900 followed buy 19000
shall be seen as immediate hurdles. We would
maintain our bullish stance on market and would
advocate utilizing dips to add fresh longs.
Comments
The Nifty futures open interest has decreased by
2.21% and Bank Nifty futures open interest has
decreased by 7.06% as the market closed at 18642.75.
The Nifty December future closed with a premium of
128.60 point against a premium of 116.45 point in the
last trading session. The January series closed at a
premium of 235.10 point.
The INDIA VIX increased from 13.73 to 14.04. At the
same time, the PCR-OI of Nifty has increased to 0.91
from 0.90.
Few of the liquid counters where we have seen high
cost of carry are BHEL, ASTRAL, OFSS, EICHERMOT
and ABCAPITAL.
Historical Volatility
SCRIP HV
BPCL 34.32
DRREDDY 28.99
HONAUT 36.97
HINDPETRO 41.12
PERSISTENT 46.75
Nifty Vs OI
17800
18000
18200
18400
18600
18800
19000
8,000
9,000
10,000
11,000
12,000
13,000
14,000
15,000
16,000
11/17 11/22 11/24 11/28 11/30 12/2 12/6
Openinterest Nifty
OI Gainers
SCRIP OI
OI
CHG. (%)
PRICE
PRICE
CHG. (%)
PNB 260336000 20.62 55.45 0.90
IRCTC 18151875 20.53 716.45 -2.68
COLPAL 2478000 15.07 1586.50 -0.72
SBILIFE 5705250 8.66 1285.10 0.24
DRREDDY 1927500 7.10 4374.20 -2.07
PEL 6471300 6.10 901.05 0.15
TATACHEM 8093000 6.03 1043.20 -1.23
CROMPTON 3921000 5.83 362.15 -1.88
OI Losers
SCRIP OI
OI
CHG. (%)
PRICE
PRICE
CHG. (%)
BOSCHLTD 126000 -7.49 17286.10 0.68
HINDALCO 19919025 -6.69 470.00 -2.31
HCLTECH 10073000 -6.30 1120.95 -0.92
IGL 8496125 -6.27 439.75 0.86
FEDERALBNK 73975000 -5.76 134.80 -1.53
TORNTPOWER 2830500 -5.46 543.35 -0.84
TATASTEEL 202778000 -5.12 112.95 -2.45
COALINDIA 28648200 -4.55 231.65 0.15
Put-Call Ratio
SCRIP PCR (OI) PCR (VOL)
NIFTY 0.91 0.90
BANKNIFTY 0.84 0.99
RELIANCE 0.56 0.43
ICICIBANK 0.48 0.51
INFY 0.44 0.60
www.angelone.in
Technical & Derivatives Report
DEC 07, 2022
Note: Above mentioned Bullish or Bearish Spreads in Nifty (Dec Series) are given as an information and not as a recommendation.
Nifty Spot =
1
8
642.75
FII Statistics for
December
0
6
, 2022
Detail Buy
Contracts
Open
Interest
Value
(in Cr.)
Sell
Net
CHANGE
INDEX
FUTURES
1864.89 3398.31 (1533.42) 177757 17478.05 2.45
INDEX
OPTIONS
783512.91 781576.10 1936.81
1955817 191934.13 3.50
STOCK
FUTURES
7417.48 9233.71 (1816.23) 1932627 135862.36 0.46
STOCK
OPTIONS
6829.39 6955.69 (126.30) 135643 9780.82 4.19
Total 799624.67
801163.81
(1539.14) 4201844
355055.36
2.06
Turnover on
December
0
6
, 2022
Instrument
No. of
Contracts
Turnover
( in Cr. )
Change
(%)
Index
Futures
229443 22771.81 -7.53
Index
Options
146117964 32178.05 -8.02
Stock
Futures
658090 47830.45 -1.84
Stock
Options
2530006 3498.56 -4.80
Total
2,530,006 3498.56 -5.12
Bull-Call Spreads
Action Strike Price Risk Reward BEP
Buy
18700 269.70
57.80
42.20
18757.80
Sell
18800 211.90
Buy
18700 269.70
106.20
93.80
18806.20
Sell
18900 163.50
Buy
18800 211.90
48.40 51.60 18848.40
Sell 18900 163.50
Bear
-
Put Spreads
Action Strike Price Risk Reward BEP
Buy 18600 158.65
31.60
68.40
18568.40
Sell
18500 127.05
Buy 18600 158.65
56.05
143.95
18543.95
Sell 18400 102.60
Buy
18500 127.05
24.45 75.55 18475.55
Sell 18400 102.60
Nifty Put
-
Call Analysis
,0
500,000
1000,000
1500,000
2000,000
2500,000
3000,000
3500,000
4000,000
18100 18200 18300 18400 18500 18600 18700 18800 18900 19000 19100 19200 19300 19400
Call Put

www.angelone.in
Technical & Derivatives Report
DEC 07, 2022
`
Daily Pivot Levels for Nifty Constituents
Scrips
S2
S1
PIVOT
R1 R2
ADANIENT
3,851
3,942
3,999
4,090
4,147
ADANIPORTS
879
888
895
904
911
APOLLOHOSP 4,683 4,735
4,768 4,820
4,853
ASIANPAINT
3,108
3,135
3,152
3,179
3,196
AXISBANK 891 898
902
909 914
BAJAJ-AUTO
3,621
3,658
3,679
3,716
3,737
BAJFINANCE 6,586 6,642
6,689
6,745
6,792
BAJAJFINSV 1,618 1,627
1,637
1,645
1,656
BPCL
320
324
333
337
346
BHARTIARTL 821 827
836
842 851
BRITANNIA 4,350 4,387
4,419
4,457
4,489
CIPLA
1,096
1,103
1,110
1,117
1,125
COALINDIA
228
230
231
233
234
DIVISLAB 3,338 3,347
3,358
3,367
3,378
DRREDDY 4,287 4,331
4,403
4,446
4,518
EICHERMOT 3,246 3,273
3,305
3,332
3,365
GRASIM
1,789
1,807
1,819
1,837
1,849
HCLTECH 1,100 1,110
1,118
1,128
1,136
HDFCBANK
1,595
1,603
1,608
1,617
1,622
HDFCLIFE 579 583
589
593
599
HDFC 2,634 2,659
2,676
2,701
2,718
HEROMOTOCO 2,754 2,776
2,801
2,823
2,848
HINDALCO 461 466
472
476
482
HINDUNILVR 2,583 2,619
2,639
2,675
2,696
ICICIBANK
915
919
924
928
934
INDUSINDBK
1,161
1,173
1,190 1,202
1,219
INFY
1,597
1,605
1,615 1,623
1,634
ITC
332
335
337
339 341
JSW STEEL 732 739
748
755
763
KOTAKBANK 1,910 1,923
1,933
1,945
1,956
LT 2,054 2,074
2,087 2,107
2,120
M&M
1,242
1,253
1,259
1,270
1,276
MARUTI 8,632 8,675
8,737
8,780
8,842
NESTLEIND 19,410 19,661
19,825
20,076
20,240
NTPC
173
174
175
176
177
ONGC 140 141
142 143
144
POWERGRID 218 221
222
225
227
RELIANCE
2,647
2,668
2,683 2,704
2,719
SBILIFE 1,261 1,273
1,293
1,305
1,325
SBIN
600
605
612
617
624
SUNPHARMA 1,016 1,025
1,032
1,041
1,049
TCS 3,347 3,366
3,387 3,406 3,427
TATACONSUM
791
794
797
801
804
TATAMOTORS
422
425
428
431
434
TATASTEEL
110
112
114
115
117
TECHM
1,072
1,081
1,088
1,097
1,104
TITAN 2,578 2,598
2,611 2,630 2,643
ULTRACEMCO 7,085 7,163
7,219
7,297
7,352
UPL
771
779
791
800 812
WIPRO
406
409
411
413 415

www.angelone.in
Technical & Derivatives Report
DEC 07, 2022
*
Technical and Derivatives Team:
Sameet Chavan Chief Analyst – Technical & Derivatives sameet.chavan@angelone.in
Sneha Seth Senior Analyst – Technical & Derivatives sneha.seth@angelone.in
Rajesh Bhosale Technical Analyst rajesh.bhosle@angelone.in
Osho Krishan Senior Analyst – Technical & Derivatives osho.krishan@angelone.in
Research Team Tel: 022 – 39357600 Website: www.angelone.in
For Technical Queries E-mail: technicalresearch-cso@angelone.in
For Derivatives Queries E-mail: derivatives.desk@angelone.in
DISCLAIMER
Angel One Limited (hereinafter referred to as “Angel”) is a registered Member of National Stock Exchange of India Limited, Bombay
Stock Exchange Limited and Metropolitan Stock Exchange Limited. It is also registered as a Depository Participant with CDSL and
Portfolio Manager and investment advisor with SEBI. It also has registration with AMFI as a Mutual Fund Distributor. Angel One
Limited is a registered entity with SEBI for Research Analyst in terms of SEBI (Research Analyst) Regulations, 2014 vide registration
number INH000000164. Angel or its associates has not been debarred/ suspended by SEBI or any other regulatory authority for
accessing /dealing in securities Market.
This document is solely for the personal information of the recipient, and must not be singularly used as the basis of any investment
decision. Nothing in this document should be construed as investment or financial advice. Each recipient of this document should
make such investigations as they deem necessary to arrive at an independent evaluation of an investment in the securities of the
companies referred to in this document (including the merits and risks involved), and should consult their own advisors to determine
the merits and risks of such an investment.
Angel or its associates or research analyst or his relative may have actual/beneficial ownership of 1% or more in the securities of
the subject company at the end of the month immediately preceding the date of publication of the research report. Neither Angel or
its associates nor Research Analysts or his relative has any material conflict of interest at the time of publication of research report.
Angel or its associates might have received any compensation from the companies mentioned in the report during the period
preceding twelve months from the date of this report for services in respect of managing or co-managing public offerings, corporate
finance, investment banking or merchant banking, brokerage services or other advisory service in a merger or specific transaction
in the normal course of business. Angel or its associates did not receive any compensation or other benefits from the companies
mentioned in the report or third party in connection with the research report. Neither Angel nor its research analyst entity has been
engaged in market making activity for the subject company.
Reports based on technical and derivative analysis center on studying charts of a stock's price movement, outstanding positions and
trading volume, as opposed to focusing on a company's fundamentals and, as such, may not match with a report on a company's
fundamentals. Investors are advised to refer the Fundamental and Technical Research Reports available on our website to evaluate
the contrary view, if any.
The information in this document has been printed on the basis of publicly available information, internal data and other reliable
sources believed to be true, but we do not represent that it is accurate or complete and it should not be relied on as such, as this
document is for general guidance only. Angel One Limited or any of its affiliates/ group companies shall not be in any way responsible
for any loss or damage that may arise to any person from any inadvertent error in the information contained in this report. Angel One
Limited has not independently verified all the information contained within this document. Accordingly, we cannot testify, nor make
any representation or warranty, express or implied, to the accuracy, contents or data contained within this document. While Angel
One Limited endeavors to update on a reasonable basis the information discussed in this material, there may be regulatory,
compliance, or other reasons that prevent us from doing so.
This document is being supplied to you solely for your information, and its contents, information or data may not be reproduced,
redistributed or passed on, directly or indirectly.
Neither Angel One Limited, nor its directors, employees or affiliates shall be liable for any loss or damage that may arise from or in
connection with the use of this information. Angel or its associates or Research Analyst or his relative might have financial interest
in the subject company. Research analyst has not served as an officer, director or employee of the subject company.
