Classified as Public
November
0
7
, 2023
www.angelone.in
Technical & Derivatives Report
8
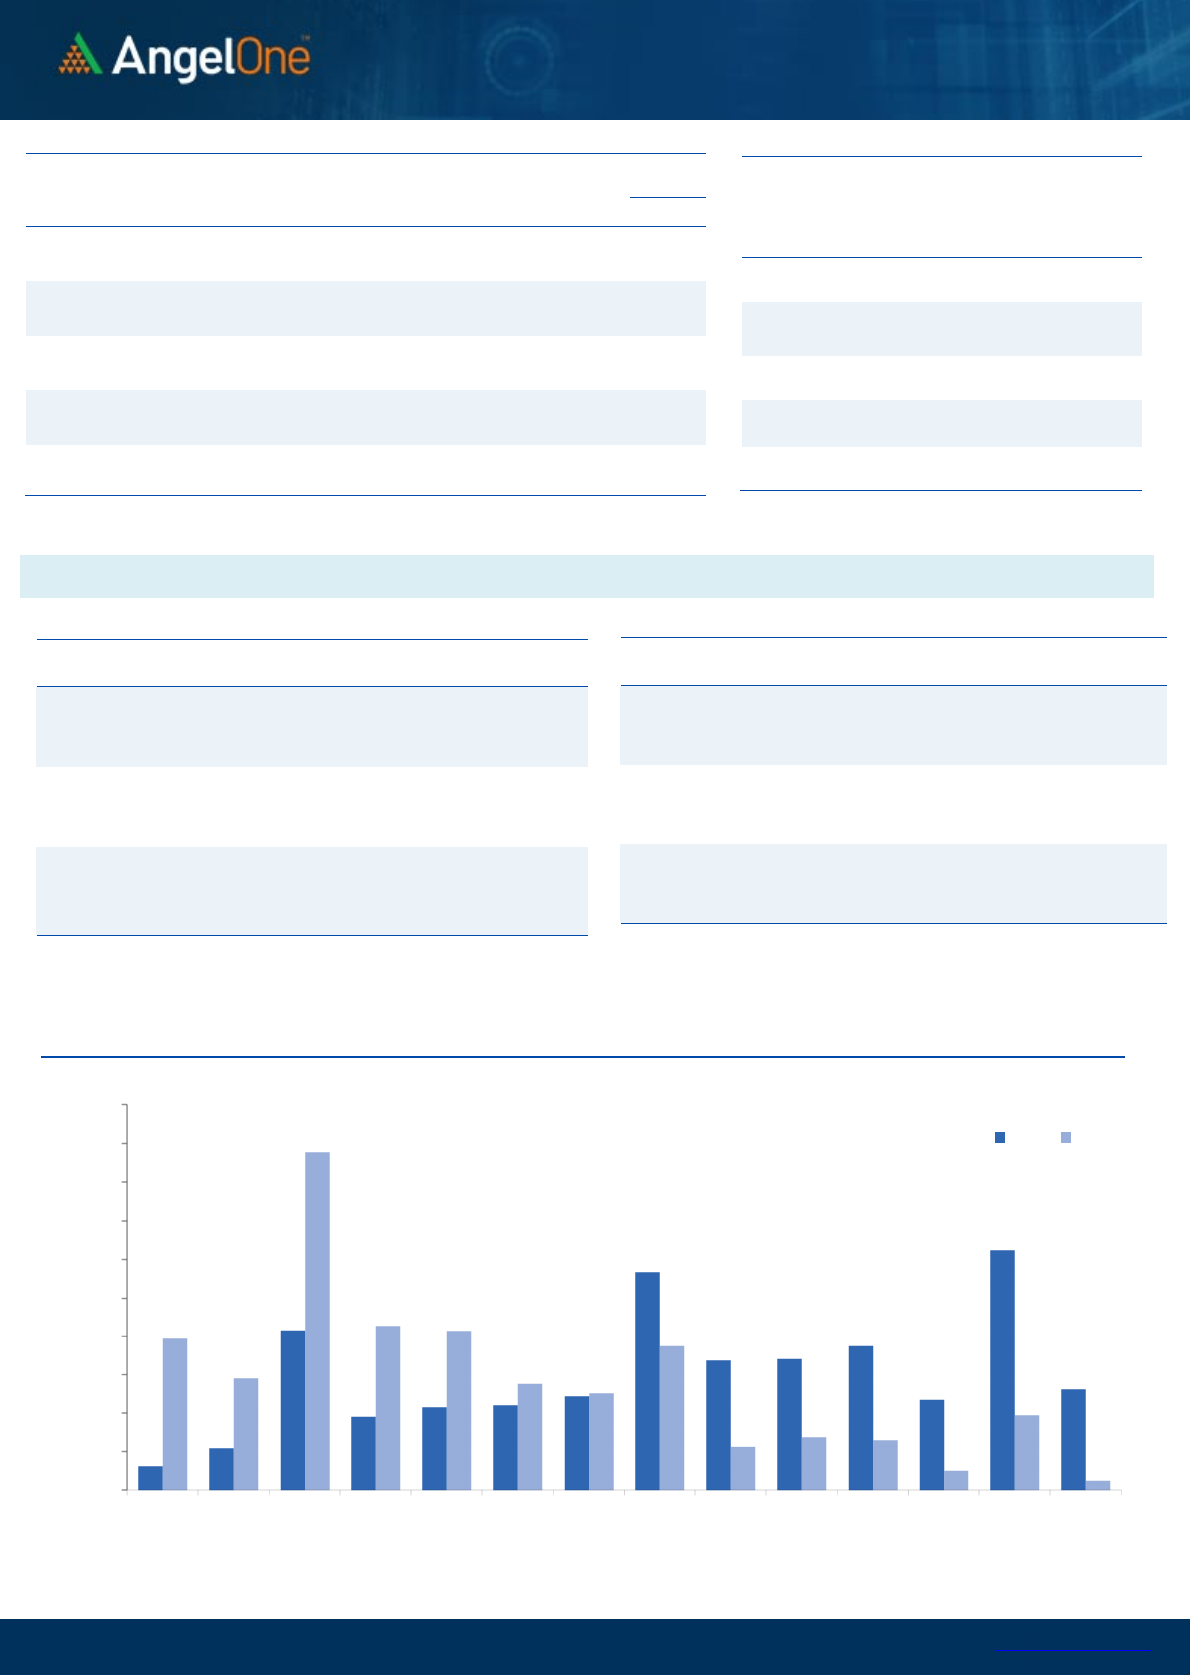
Nifty Bank Outlook (
4
3
619
)
The festive week commenced with an upward gap, consistent for the
previous three trading sessions. However, the index witnessed some
profit taking in the initial trade. The BANKNIFTY managed to stabilize
around key supports and resumed upward trajectory thereafter,
almost recouping the entire morning's losses. With smart buying
interest in the final hour of trade, the index settled a tad above 43600,
marking a gain of seven-tenths of a percent. The banking index has
formed a Doji candle for the fourth consecutive session now. In recent
times, the momentum has been somewhat lacking, as the index has
been trading within a tight range. Interestingly, yesterday we saw a
surge in momentum during the final hour of trading, leading to a close
near the day's high. Thus, it will be interesting to monitor whether we
observe a subsequent move beyond the 43800-44000 in the upcoming
sessions, which is a strong resistance zone.
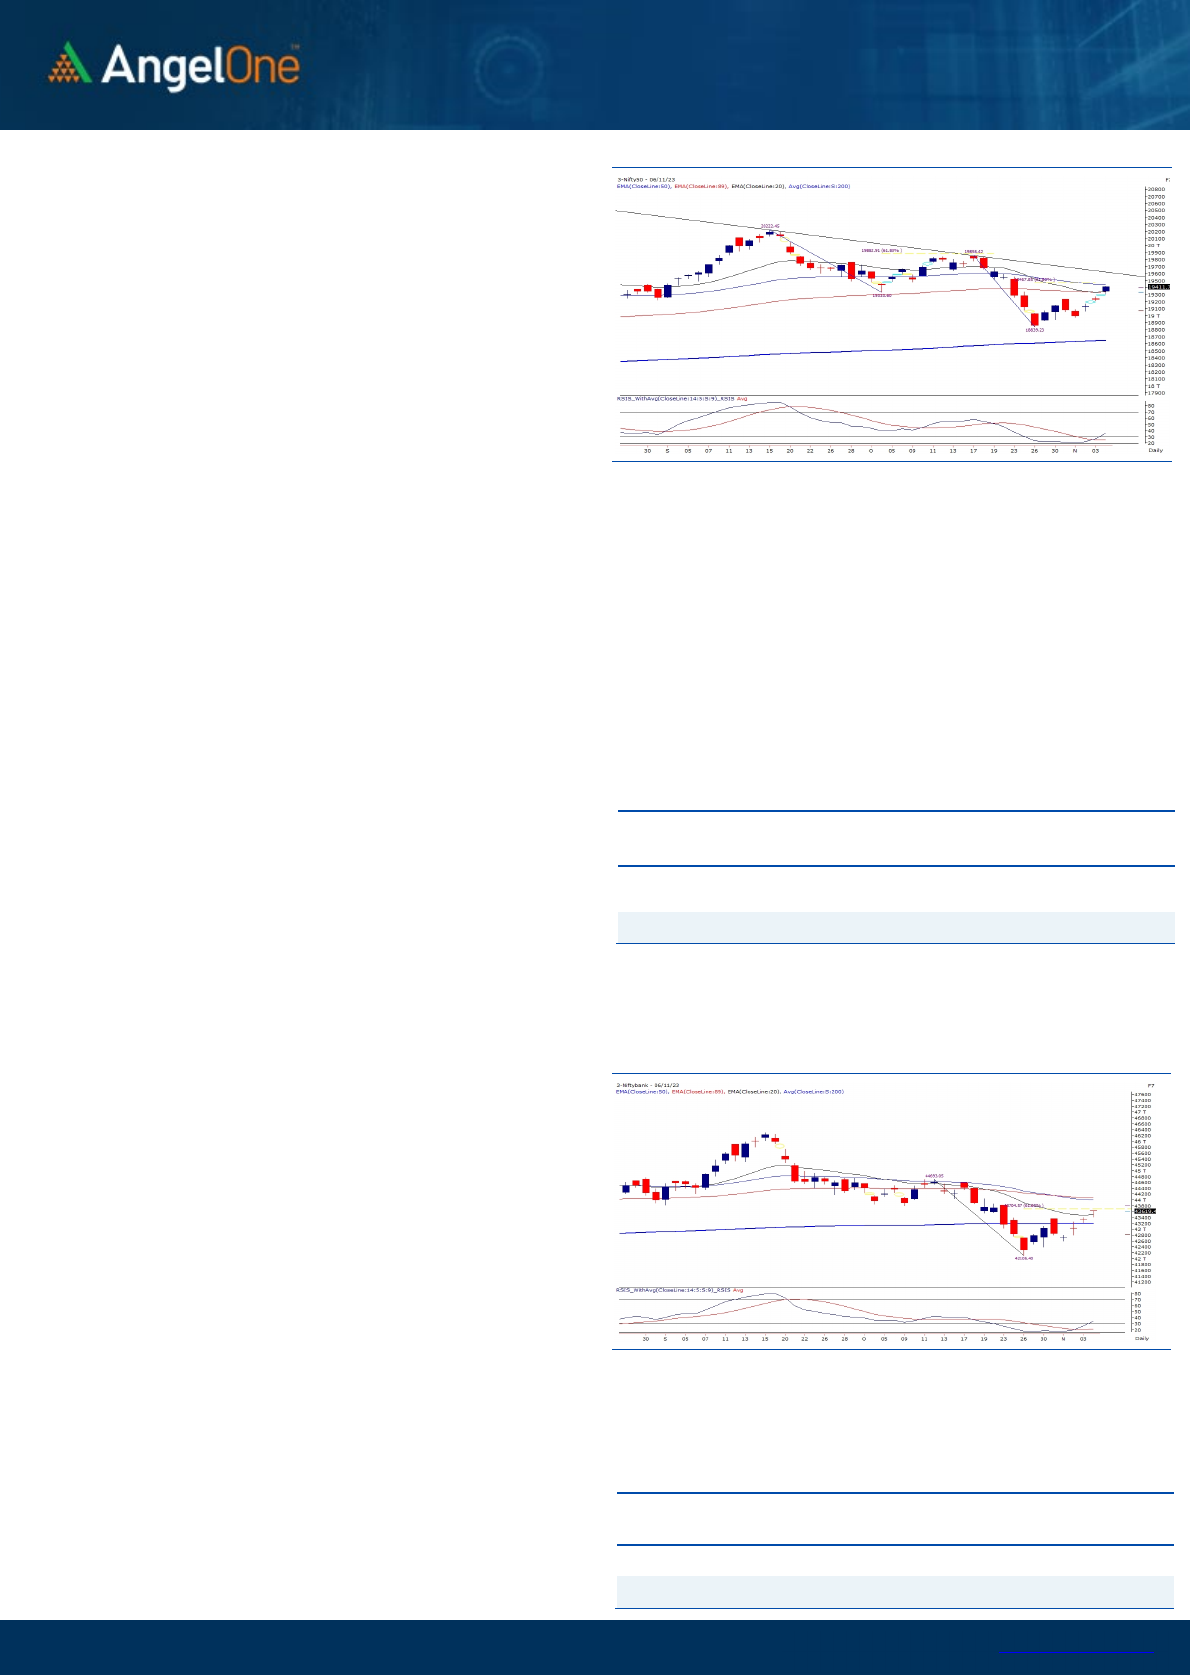
Exhibit 1: Nifty Daily Chart
Exhibit 2: Nifty Bank Daily Chart
Sensex (
6
4
959
) / Nifty (
1
9
412
)
Over the weekend, there was a notable improvement in the global
markets, and our local markets took their cues from this, resulting in a
strong gap-up opening. Throughout most of the session, there was
limited price movement as prices fluctuated within a specific range.
However, during the final hour, a fresh round of strong buying
emerged, pushing prices to a close with a gain of 0.94%, ending a tad
above the 19400 mark.
November has been favorable for the bull's camp so far, with prices
experiencing a second consecutive bullish gap. The primary reason for
this optimism can be attributed to the positive global cues, which have
displayed a significant upward trend in recent sessions. Our markets
have also made a remarkable move by breaking through intermediate
key resistance levels and now position themselves comfortably above
major moving averages. Additionally, the positive crossover of the RSI
smoothened indicator around the oversold zone bodes well for the
bullish sentiment. However, we must remain vigilant as global
uncertainties persist, and any negative developments could lead to
sharper declines compared to the recent gradual upswings. During the
previous rebound observed last month, prices encountered strong
resistance around the 61.8% retracement level. The current upmove
also faces a significant resistance zone between 19460 and 19500,
corresponding to the 61.8% retracement level of the recent fall. This
zone serves as a pivotal point for the next phase of the upward
movement. A breakthrough beyond this range could trigger an
extension of the upward momentum, potentially reaching the
Descending Trendline resistance around 19600 and subsequently
targeting the previous high of 19850.
However, from a technical perspective, prices are still following a
pattern of lower highs and lower lows. As long as this pattern
persists, we should exercise caution and be selective in our approach
to long positions, taking one step at a time during these price
rebounds. On the flip side, the bullish gap left yesterday around
19300 is likely to act as immediate support. As the Diwali festival
approaches, many traders and investors often show renewed
interest in individual stocks, particularly midcap and smallcap stocks,
which can experience significant price movements. Traders may
consider focusing on such opportunities, but it's essential to remain
cautious and avoid complacency.
Key Levels
Support 1 – 19300 Resistance 1 – 19480
Support 2 – 19270 Resistance 2 – 19530
On the downside, 43200-43000 should provide immediate support
in case of a decline. Considering the recent price action, we continue
to maintain a cautious stance on the market and it's better not to
get carried away by the ongoing move.
Key Levels
Support 1 – 43200 Resistance 1 – 43800
Support 2 – 43000 Resistance 2 – 44000

Classified as Public
www.angelone.in
Technical & Derivatives Report
November
0
7
, 2023
View
The Indian Equity market witnessed a strong day of
trade, wherein the benchmark index Nifty50 surged
nearly a percent to settle a tad above 19400 zone.
FIIs were net sellers in the cash market segment to
the tune of Rs. 549 cr. Simultaneously, they bought
worth Rs. 1258 cr in Index futures with a decrease in
open interest, indicating short covering.
On the derivatives front, a mixed bag of trades was
seen in key indices. On the options front, a strong
piling of OI is seen at 19300-19400 put strikes,
suggesting an immediate in the support zone. On the
higher end, the 19500-call strike has the highest OI
concentration, indicating intermediate resistance.
FIIs further curtailed bearish bets in index futures
segments, resulting in a slight advancement of the
Long Short Ratio to 20% from 18%. Considering the
recent developments, our market seems to be
gaining traction, though one needs to maintain
caution and track global developments.
Comments
The Nifty futures open interest has decreased by 1.13%
and Bank Nifty futures open interest has increased by
2.75% as the market closed at 19411.75.
The Nifty November future closed with a premium of
74.75 points against a premium of 73 points in the last
trading session. The December series closed at a
premium of 177.80 points.
The INDIA VIX has increased from 10.88 to 11.11. At the
same time, the PCR-OI of Nifty has increased from 0.96
to 1.14.
A few of the liquid counters where we have seen high
cost of carry are AARTIIND, JKCEMENT, METROPOLIS,
DEEPAKNTR and EXIDEIND.
Historical Volatility
SCRIP HV
ADANIENT 73.26
IDEA 66.42
IBULHSGFIN 62.64
DELTACORP 60.93
RBLBANK 54.93
Nifty Vs OI
18400
18600
18800
19000
19200
19400
19600
19800
20000
20200
8,000
9,000
10,000
11,000
12,000
13,000
14,000
15,000
10-20 10-25 10-27 10-31 11-2 11-6
Openinterest Nifty
OI Gainers
SCRIP OI
OI
CHG. (%)
PRICE
PRICE
CHG. (%)
JKCEMENT 869500 29.97 3403.00 8.43
BATAINDIA 1770000 24.37 1561.00 -1.34
BANKBARODA 136255275 14.77 195.60 -4.04
RAMCOCEM 3077850 14.66 1005.65 2.08
ONGC 35643300 12.26 193.30 1.77
PIDILITIND 2631750 8.36 2433.70 -0.90
BHARATFORG 9448500 8.15 1075.70 4.38
DEEPAKNTR 2540100 7.96 2138.40 6.07
OI Losers
SCRIP OI
OI
CHG. (%)
PRICE
PRICE
CHG. (%)
MUTHOOTFIN 17600 -6.62 1331.90 0.09
LALPATHLAB 914700 -6.44 2646.80 1.84
BAJFINANCE 4611375 -5.32 7561.95 1.91
MFSL 7372800 -4.68 905.25 1.37
CROMPTON 13689000 -4.63 283.15 -1.65
POLYCAB 3005300 -4.60 5138.90 1.65
MRF 53015 -4.56 107391.70 0.03
IGL 16110875 -4.55 401.15 0.31
Put-Call Ratio
SCRIP PCR (OI) PCR (VOL)
NIFTY 1.14 0.87
BANKNIFTY 1.10 0.93
RELIANCE 0.60 0.59
ICICIBANK 0.75 0.51
INFY 0.49 0.49
Classified as Public
www.angelone.in
Technical & Derivatives Report
November
0
7
, 2023
Note: Above mentioned Bullish or Bearish Spreads in Nifty (Nov Series) are given as an information and not as a recommendation.
Nifty Spot =
1
9
411
.
75
FII Statistics for
November
0
6
, 2023
Detail Buy
Contracts
OI Value
(in Cr.)
Sell Net
CHANGE
INDEX
FUTURES
3107.06 1849.42 1257.64
244572 20088.16 (2.84)
INDEX
OPTIONS
936454.63 959174.50 (22719.87) 4171036 338741.40 12.22
STOCK
FUTURES
12436.86 11743.99 692.87
2547624 178550.90 (0.05)
STOCK
OPTIONS
14103.94 14057.71 46.23
195058 13802.83 4.73
Total
966102.49
986825.62
(20723.13) 7158290
551183.29
6.78
Turnover on
November
0
6
, 2023
Instrument
No. of
Contracts
Turnover
(in Cr.)
Change
(%)
Index Futures
226969 18401.78
-0.26
Index Options
255854984
37199.20
17.16
Stock Futures
855462 60182.29
-6.37
Stock Options
3697056 3976.88 -10.17
Total
36,97,056 3976.88 0.72
Bull-Call Spreads
Action Strike Price Risk Reward BEP
Buy
19300
299.70 65.95
34.05
19365.95
Sell
19400
233.75
Buy
19300 299.70 121.65
78.35
19421.65
Sell
19500 178.05
Buy
19400
233.75 55.70 44.30 19455.70
Sell
19500 178.05
Bear-Put Spreads
Action Strike Price Risk Reward BEP
Buy
19500 189.80
44.25
55.75
19455.75
Sell 19400 145.55
Buy 19500 189.80
78.55
121.45
19421.45
Sell
19300 111.25
Buy
19400 145.55
34.30 65.70 19365.70
Sell 19300 111.25
Nifty Put
-
Call Analysis
,0
500,000
1000,000
1500,000
2000,000
2500,000
3000,000
3500,000
4000,000
4500,000
5000,000
18800 18900 19000 19100 19200 19300 19400 19500 19600 19700 19800 19900 20000 20100
Call Put

Classified as Public
www.angelone.in
Technical & Derivatives Report
November
0
7
, 2023
`
Daily Pivot Levels for Nifty Constituents
Scrips S2 S1 PIVOT R1 R2
ADANIENT 2,219 2,233 2,246 2,260 2,273
ADANIPORTS 796 799 803 806 810
APOLLOHOSP 5,073 5,119 5,173 5,219 5,274
ASIANPAINT 2,966 2,997 3,016 3,048 3,066
AXISBANK 983 996 1,006 1,019 1,029
BAJAJ-AUTO 5,353 5,380 5,404 5,431 5,454
BAJFINANCE 7,396 7,479 7,526 7,608 7,655
BAJAJFINSV 1,531 1,548 1,557 1,574 1,583
BPCL 358 362 366 370 373
BHARTIARTL 926 933 937 943 947
BRITANNIA 4,517 4,570 4,599 4,652 4,681
CIPLA 1,186 1,195 1,206 1,215 1,226
COALINDIA 310 313 316 320 323
DIVISLAB 3,209 3,358 3,444 3,593 3,680
DRREDDY 5,252 5,295 5,326 5,369 5,400
EICHERMOT 3,391 3,451 3,497 3,557 3,603
GRASIM 1,877 1,898 1,917 1,938 1,958
HCLTECH 1,257 1,263 1,271 1,278 1,286
HDFCBANK 1,477 1,486 1,492 1,501 1,507
HDFCLIFE 616 619 623 626 629
HEROMOTOCO 3,066 3,117 3,146 3,196 3,226
HINDALCO 475 479 482 485 488
HINDUNILVR 2,475 2,486 2,502 2,513 2,529
ICICIBANK 933 939 944 950 954
INDUSINDBK 1,450 1,460 1,466 1,476 1,482
INFY 1,384 1,394 1,400 1,410 1,417
ITC 431 433 435 437 439
JSW STEEL 740 747 752 759 763
KOTAKBANK 1,725 1,732 1,740 1,747 1,755
LT 2,909 2,942 2,961 2,994 3,012
LTIMINDTREE 5,084 5,117 5,148 5,180 5,211
M&M 1,466 1,477 1,485 1,496 1,503
MARUTI 10,205 10,245 10,292 10,332 10,379
NESTLEIND 23,914 24,102 24,246 24,434 24,578
NTPC 233 235 236 237 239
ONGC 188 191 192 195 197
POWERGRID 203 206 207 210 211
RELIANCE 2,320 2,330 2,335 2,344 2,349
SBILIFE 1,315 1,323 1,332 1,341 1,349
SBIN 567 571 577 580 586
SUNPHARMA 1,136 1,143 1,147 1,154 1,158
TCS 3,344 3,362 3,377 3,395 3,410
TATACONSUM
912 915 919 923 927
TATAMOTORS 638 642 647 652 657
TATASTEEL 117 118 119 120 121
TECHM 1,130 1,136 1,140 1,147 1,151
TITAN 3,209 3,238 3,274 3,303 3,339
ULTRACEMCO 8,475 8,558 8,604 8,687 8,733
UPL 546 550 553 557 560
WIPRO 381 383 385 386 388

Classified as Public
www.angelone.in
Technical & Derivatives Report
November
0
7
, 2023
Technical and Derivatives Team:
Sameet Chavan Head Research – Technical & Derivatives sameet.chavan@angelone.in
Sneha Seth Senior Analyst – Technical & Derivatives sneha.seth@angelone.in
Rajesh Bhosale Analyst - Technical rajesh.bhosle@angelone.in
Osho Krishan Senior Analyst – Technical & Derivatives osho.krishan@angelone.in
Hitesh Rathi Analyst – Technical & Derivatives hitesh.rathi@angelone.in
Research Team Tel: 022 – 39357600 Website: www.angelone.in
For Technical Queries E-mail: technicalresearch-cso@angelone.in
For Derivatives Queries E-mail: derivatives.desk@angelone.in
DISCLAIMER
We, Angel One Limited (hereinafter referred to as “Angel”) a company duly incorporated under the provisions of the Companies Act, 1956 with
its registered office at 601, 6th Floor, Ackruti Star, Central Road, MIDC, Andheri East, Mumbai – 400093, CIN: (L67120MH1996PLC101709) and
duly registered as a member of National Stock Exchange of India Limited, Bombay Stock Exchange Limited, Metropolitan Stock Exchange Limited,
Multi Commodity Exchange of India Ltd and National Commodity & Derivatives Exchange Ltd. Angel One limited is a company engaged in
diversified financial services business including securities broking, DP services, distribution of Mutual Fund products. It is also registered as a
Depository Participant with CDSL and Portfolio Manager and Investment Adviser with SEBI. It also has registration with AMFI as a Mutual Fund
Distributor. Angel One Limited is a registered entity with SEBI for Research Analyst in terms of SEBI (Research Analyst) Regulations, 2014 vide
registration number INH000000164 and also registered with PFRDA as PoP ,Registration No.19092018. Angel Group does not have any joint
ventures or associates. Angel One Limited is the ultimate parent company of the Group. Angel or its associates has not been debarred/ suspended
by SEBI or any other regulatory authority for accessing /dealing in securities Market.
AOL was merged with Angel Global Capital Private Limited and subsequently name of Angel Global Capital Private Limited was changed to Angel
Broking Private Limited (AOL) pursuant to scheme of Amalgamation sanctioned by the Hon'ble High Court of Judicature at Bombay by Orders
passed in Company Petition No 710 of 2011 and the approval granted by the Registrar of Companies. Further, name of Angel Broking Private
Limited again got changed to Angel Broking Limited (AOL) pursuant to fresh certificate of incorporation issued by Registrar of Companies (ROC)
dated June 28, 2018. Further name of Angel Broking name changed to Angel One Ltd pursuant to fresh certificate of incorporation issued by
Registrar of Companies (ROC) dated 23-09-21.
In case of any grievances please write to: support@angelone.in, Compliance Officer Details: Name : Hiren Thakkar, Tel No. –08657864228, Email
id - compliance@angelone.in
Registration granted by SEBI and certification from NISM in no way guarantee performance of the intermediary or provide any assurance of returns
to investors.
This document is solely for the personal information of the recipient, and must not be singularly used as the basis of any investment decision.
Nothing in this document should be construed as investment or financial advice. Each recipient of this document should make such investigations
as they deem necessary to arrive at an independent evaluation of an investment in the securities of the companies referred to in this document
(including the merits and risks involved), and should consult their own advisors to determine the merits and risks of such an investment.
Angel or its associates or research analyst or his relative may have actual/beneficial ownership of 1% or more in the securities of the subject
company at the end of the month immediately preceding the date of publication of the research report. Neither Angel or its associates nor
Research Analysts or his relative has any material conflict of interest at the time of publication of research report.
Angel or its associates might have received any compensation from the companies mentioned in the report during the period preceding twelve
months from the date of this report for services in respect of managing or co-managing public offerings, corporate finance, investment banking or
merchant banking, brokerage services or other advisory service in a merger or specific transaction in the normal course of business. Angel or its
associates did not receive any compensation or other benefits from the companies mentioned in the report or third party in connection with the
research report. Neither research entity nor research analyst has been engaged in market making activity for the subject company.

Classified as Public
www.angelone.in
Technical & Derivatives Report
November
0
7
, 2023
*
Reports based on technical and derivative analysis center on studying charts of a stock's price movement, outstanding positions and trading
volume, as opposed to focusing on a company's fundamentals and, as such, may not match with a report on a company's fundamentals. Investors
are advised to refer the Fundamental and Technical Research Reports available on our website to evaluate the contrary view, if any.
The information in this document has been printed on the basis of publicly available information, internal data and other reliable sources believed
to be true, but we do not represent that it is accurate or complete and it should not be relied on as such, as this document is for general guidance
only. Angel One Limited or any of its affiliates/ group companies shall not be in any way responsible for any loss or damage that may arise to any
person from any inadvertent error in the information contained in this report. Angel One Limited does not warrant the accuracy, adequacy or
completeness of the service, information and materials and expressly disclaims liability for errors or omissions in the service, information and
materials. While Angel One Limited endeavours to update on a reasonable basis the information discussed in this material, there may be
regulatory, compliance, or other reasons that prevent us from doing so.
This document is being supplied to you solely for your information, and its contents, information or data may not be reproduced, redistributed or
passed on, directly or indirectly.
Neither Angel One Limited, nor its directors, employees or affiliates shall be liable for any loss or damage that may arise from or in connection
with the use of this information. Angel or its associates or Research Analyst or his relative might have financial interest in the subject company.
Research analyst has not served as an officer, director or employee of the subject company.
Investment in securities market are subject to market risks. Read all the related documents carefully before investing.
Any communication sent to clients on phone numbers or e-mail ids registered with the Trading Member is meant for client consumption and such
material should not be redistributed. Brokerage will not exceed SEBI prescribed limit. Any Information provided by us through any medium based
on our research or that of our affiliates or third parties or other external sources is subject to domestic and international market conditions and
we do not guarantee the availability or otherwise of any securities or other instruments and such Information is merely an estimation of certain
investments, and we have not and shall not be deemed to have assumed any responsibility for any such Information. You should seek independent
professional advice and/or tax advice regarding the suitability of any investment decision whether based on any Information provided by us
through the Site from inhouse research or third party reports or otherwise.
The report and information contained herein is strictly confidential and meant solely for the selected recipient and may not be altered in any way,
transmitted to, copied or distributed, in part or in whole, to any other person or to the media or reproduced in any form, without prior written
consent.
