DEC 06, 2022
www.angelone.in
Technical & Derivatives Report
xOOOOOOOO
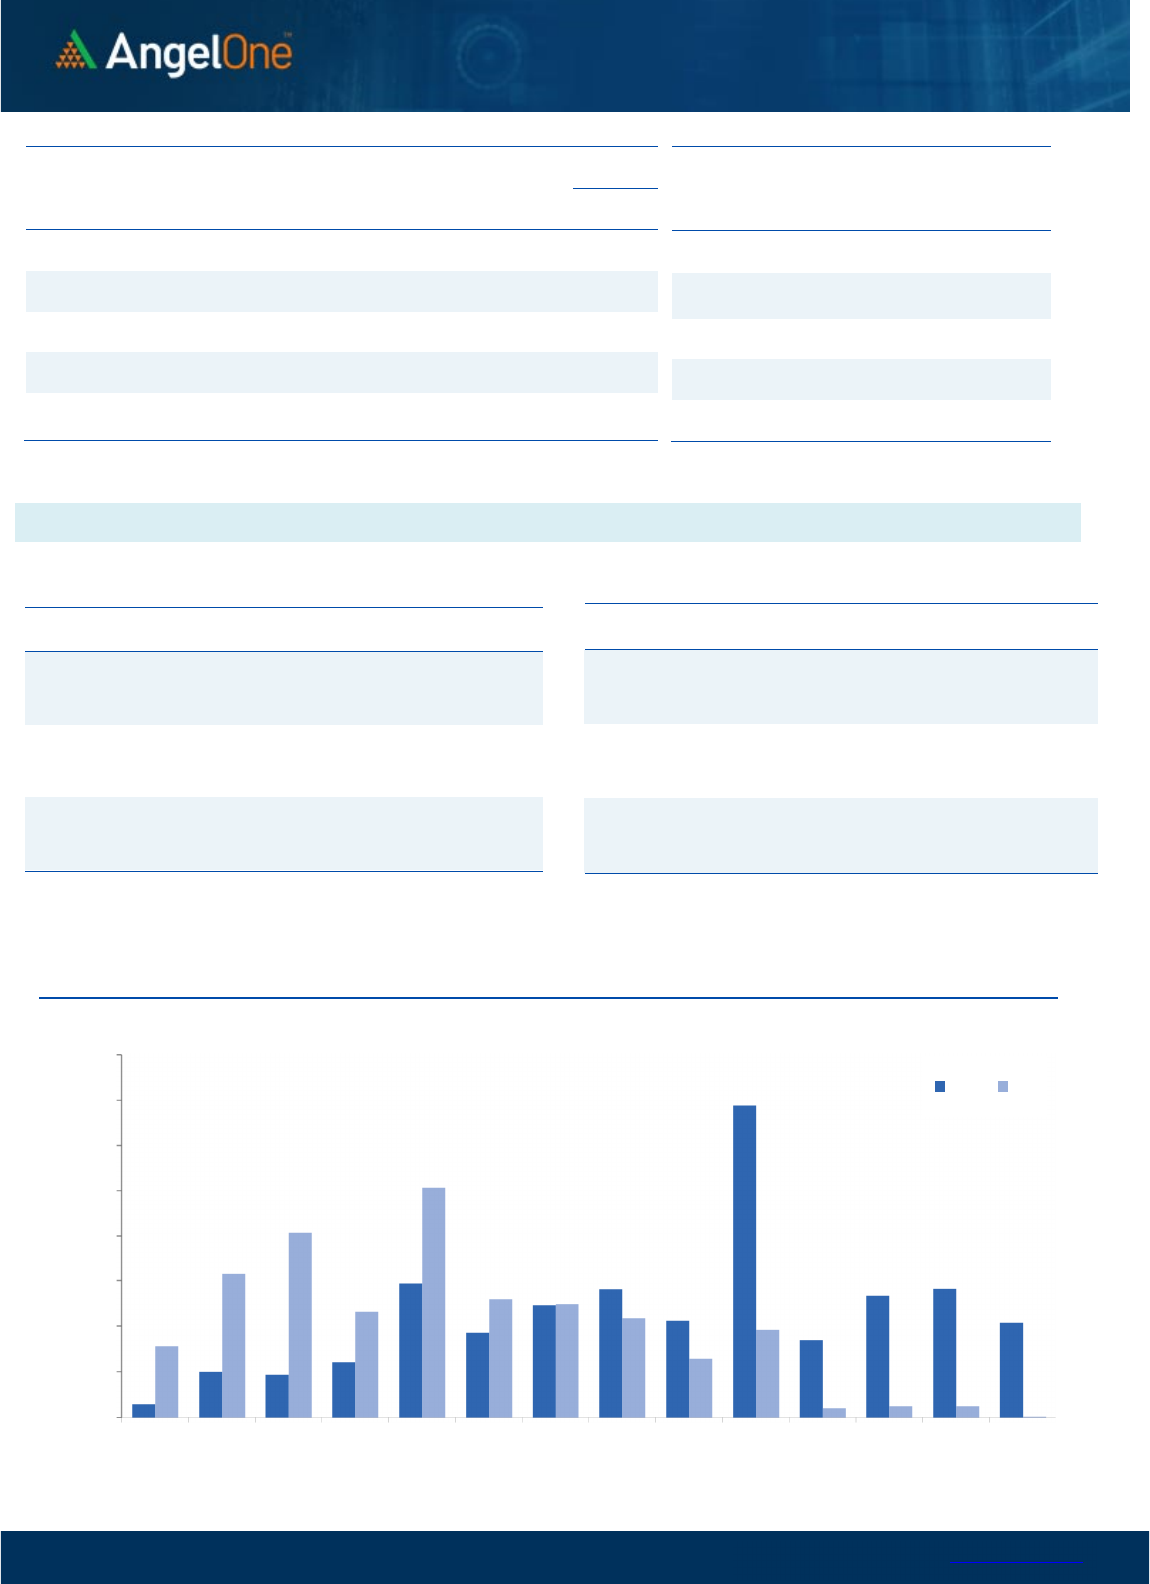
Nifty Bank Outlook (43333)
The banking index had a quiet start in tandem with benchmark. In
the initial hour, we observed some sluggish moves to enter sub-
43000 terrain. However, it was merely a formality as we witnessed
a good buying interest at lower levels to push the BANKNIFTY back
inside the green zone. In fact, as the day progressed, the banking
index took the charge as it single-handedly kept the benchmark
index in the hunt. It managed to pull the Nifty above the 18700
mark when other heavyweight pockets were sulking to some
extent. Eventually, the BANKNIFTY ended the session with nearly
half a percent gains.
We have been witnessing a range bound action in BANKNIFTY since
last eight trading sessions and yesterday too, the recovery took
place precisely after nearing the lower band. Now, since yesterday
it has managed to close around day’s high, it would be interesting
to see whether it continue to move northwards or not. Beyond
43500, once again banking index resumes its journey in the
uncharted territory. It we have to make any immediate projection,
43800 – 44000 would be the next levels to watch out for. On the
flipside, the support base remains in the vicinity of 43200 – 43000.
Key Levels
Support 1 – 43200 Resistance 1 – 43800
Support 2 – 43000 Resistance 2 – 44000
Exhibit 1: Nifty
Daily
Chart
Exhibit 2: Nifty Bank
Daily
Chart
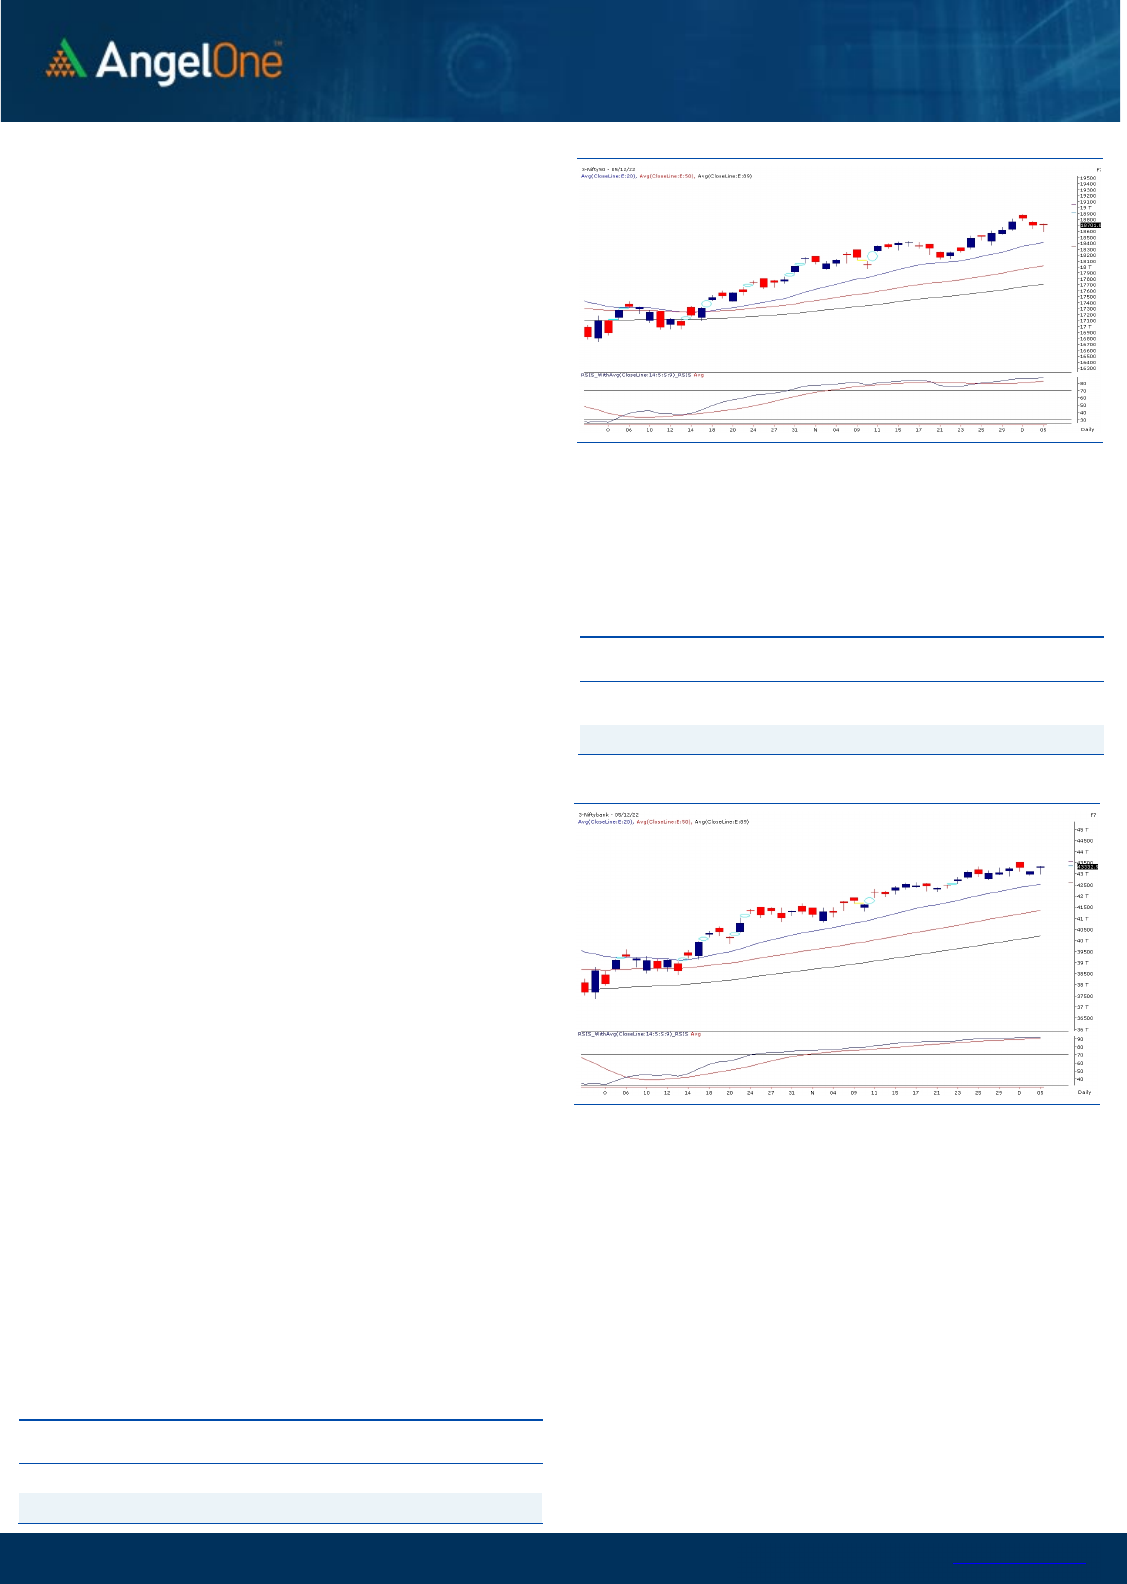
Sensex (62835) / Nifty (18701)
The Indian equity market started the week on a mild note despite
positive global developments over the weekend. The benchmark
index slipped instantly post the opening bell, but the dip augured
well for the bulls as they retaliated from the lows and made a
modest recovery in the index. We have witnessed some
tentativeness in the index as the follow-up buying was missing in
major heavyweights, and the index made a subdued move
throughout the day. Post the hustles, Nifty concluded the day on a
flat note with a mere gain of 0.03 percent and settled a tad above
18700 levels.
On the technical perspective, the crucial support of the 18600 was
firmly safeguarded, implying the resilience of the technical support.
However, some tentativeness was evident on the higher
grounds, but there has been no significant change in the chart
structure as such. The strategy of buy on the decline and sell on rise
fits perfectly in the current market scenario. As far as levels are
concerned, the 18600-18500 is likely to act as the sacrosanct
support zone, and on the higher end, the immediate hurdle could
be seen around 18800-18850, followed by the psychological mark
of 19000.
Going forward, our market is likely to remain upbeat in the near
term, wherein any minor dip could be seen as an opportunity for
the bulls to add long bets. We may expect gradual moves in key
indices, but individual pockets are performing well. Hence, it’s
advisable to keep focusing on such potential movers, which are
likely to provide better trading opportunities.
Key Levels
Support 1 – 18600 Resistance 1 – 18800
Support 2 – 18500 Resistance 2 – 18850

www.angelone.in
Technical & Derivatives Report
DEC 06, 2022
View
Trading for the week started mildly positive which was
followed by profit booking in the initial hour of trade to
test 18600. Fortunately, not much damage was
observed thereafter as index recouped almost entire
losses to end the day marginally higher to Friday’s
close.
FIIs were net sellers in the cash market segment to
the tune of Rs. 1139 crores. Simultaneously, in Index
futures, they bought worth Rs. 240 crores with a
decrease in open interest, indicating covering of
shorts.
Yesterday, the banking index outperformed the
benchmark and also added fresh longs, whereas open
interest activity for Nifty remained muted. Stronger
hands covered few shorts in index futures segment. In
options front, some build-up was seen in 18700 call
which looks to be on the long side. On the flip side,
writing was seen in 18600 and 18700 PUT but the
quantum remained insignificant. The way market
rebounded from the vicinity of 18600, it seems going
ahead 18550-18600 zone may act as strong support
zone. On the higher side, 18900 followed buy 19000
shall be seen as immediate hurdles. We would
maintain our bullish stance on market and would
advocate utilizing dips to add fresh longs.
Comments
The Nifty futures open interest has decreased by
0.72% and Bank Nifty futures open interest has
increased by 6.61% as the market closed at 18701.05.
The Nifty December future closed with a premium of
116.7 point against a premium of 116.45 point in the
last trading session. The January series closed at a
premium of 217.80 point.
The INDIA VIX increased from 13.45 to 13.73. At the
same time, the PCR-OI of Nifty has decreased to 0.90
from 0.94.
Few of the liquid counters where we have seen high
cost of carry are BHEL, ASTRAL, OFSS, EICHERMOT
and ABCAPITAL.
Historical Volatility
SCRIP HV
M&MFIN 54.62
ABCAPITAL 45.62
PEL 51.63
HINDALCO 50.72
TVSMOTOR 38.10
Nifty Vs OI
17800
18000
18200
18400
18600
18800
19000
8,000
9,000
10,000
11,000
12,000
13,000
14,000
15,000
16,000
11/16 11/18 11/23 11/25 11/29 12/1 12/5
Openinterest Nifty
OI Gainers
SCRIP OI
OI
CHG. (%)
PRICE
PRICE
CHG. (%)
NAVINFLUOR 453000 29.95 4397.65 -0.38
GNFC 8255000 16.45 599.15 0.41
M&MFIN 20820000 12.59 241.15 5.66
PEL 6099225 12.04 896.30 4.60
HINDALCO 21347525 10.01 481.20 4.09
CUB 8515000 9.59 195.65 2.15
ASTRAL 1487475 7.39 2040.70 0.95
BERGEPAINT 6597800 6.82 622.20 0.90
OI Losers
SCRIP OI
OI
CHG. (%)
PRICE
PRICE
CHG. (%)
PERSISTENT 505875 -11.96 4263.70 -2.14
NAUKRI 1482500 -6.33 4056.40 0.21
COALINDIA 30013200 -6.27 231.25 1.88
BRITANNIA 1337600 -5.58 4403.35 -0.65
NESTLEIND 275640 -5.41 19752.30 -0.19
GUJGASLTD 5012500 -5.16 508.50 -1.83
HDFC 15477300 -4.73 2675.80 0.26
UBL 1147600 -4.62 1748.35 0.55
Put-Call Ratio
SCRIP PCR (OI) PCR (VOL)
NIFTY 0.90 0.83
BANKNIFTY 1.09 0.91
RELIANCE 0.58 0.58
ICICIBANK 0.51 0.46
INFY 0.52 0.45
www.angelone.in
Technical & Derivatives Report
DEC 06, 2022
Note: Above mentioned Bullish or Bearish Spreads in Nifty (Dec Series) are given as an information and not as a recommendation.
Nifty Spot =
1
8
70
1
FII Statistics for
December
0
5
, 2022
Detail Buy
Contracts
Open
Interest
Value
(in Cr.)
Sell
Net
CHANGE
INDEX
FUTURES
2697.64 2457.98 239.66
173508 17055.85 (2.21)
INDEX
OPTIONS
828806.35 826540.08 2266.27
1889685 183848.50 8.86
STOCK
FUTURES
9112.19 9978.26 (866.07) 1923775 135754.53 (1.17)
STOCK
OPTIONS
6964.77 6971.06 (6.29) 130186 9396.63 8.21
Total 847580.95
845947.38
1633.57
4117154
346055.51
3.44
Turnover on
December
0
5
, 2022
Instrument
No. of
Contracts
Turnover
( in Cr. )
Change
(%)
Index
Futures
246984 24627.43 -8.08
Index
Options
108761108 34984.41 12.69
Stock
Futures
691175 48726.92 -4.84
Stock
Options
2694578 3675.05 -7.30
Total
2,694,578 3675.05 -0.88
Bull-Call Spreads
Action Strike Price Risk Reward BEP
Buy
18700 297.85
61.35
38.65
18761.35
Sell
18800 236.50
Buy
18700 297.85
113.45
86.55
18813.45
Sell
18900 184.40
Buy
18800 236.50
52.10 47.90 18852.10
Sell 18900 184.40
Bear
-
Put Spreads
Action Strike Price Risk Reward BEP
Buy 18700 179.15
33.90
66.10
18666.10
Sell
18600 145.25
Buy 18700 179.15
60.95
139.05
18639.05
Sell 18500 118.20
Buy
18600 145.25
27.05 72.95 18572.95
Sell 18500 118.20
Nifty Put
-
Call Analysis
,0
500,000
1000,000
1500,000
2000,000
2500,000
3000,000
3500,000
4000,000
18100 18200 18300 18400 18500 18600 18700 18800 18900 19000 19100 19200 19300 19400
Call Put

www.angelone.in
Technical & Derivatives Report
DEC 06, 2022
`
Daily Pivot Levels for Nifty Constituents
Scrips
S2
S1
PIVOT
R1 R2
ADANIENT 3,764 3,847
3,893
3,976
4,022
ADANIPORTS 871 882
889
900
907
APOLLOHOSP
4,681
4,730
4,816
4,865
4,951
ASIANPAINT 3,090 3,123
3,146
3,180
3,202
AXISBANK
892
895
901
905
911
BAJAJ-AUTO
3,623
3,641
3,657
3,675
3,691
BAJFINANCE
6,597
6,629
6,664
6,696
6,731
BAJAJFINSV 1,617 1,625
1,640
1,649
1,664
BPCL
335
337
339
341
344
BHARTIARTL
835
839
846
850
856
BRITANNIA 4,343 4,373
4,400
4,431
4,458
CIPLA
1,101
1,108
1,115
1,123
1,130
COALINDIA
225
228
230
233
235
DIVISLAB
3,322
3,346
3,370 3,394
3,418
DRREDDY 4,405 4,442
4,487
4,524 4,569
EICHERMOT
3,310
3,327
3,344
3,361
3,377
GRASIM
1,798
1,807
1,822
1,831
1,846
HCLTECH
1,119
1,125
1,133 1,139
1,148
HDFCBANK
1,590
1,601
1,608
1,620
1,626
HDFCLIFE
580
585
589
594
598
HDFC
2,619
2,648
2,664
2,693
2,709
HEROMOTOCO
2,768
2,798
2,815
2,845 2,863
HINDALCO
459
470
477
488
495
HINDUNILVR 2,570 2,595
2,610
2,635
2,650
ICICIBANK
924
929
933
938
942
INDUSINDBK 1,173 1,184
1,191
1,202
1,209
INFY 1,614 1,627
1,636
1,649
1,658
ITC
332
334
337
339 341
JSW STEEL 741 749
754
762
767
KOTAKBANK 1,910 1,924
1,934
1,948
1,958
LT 2,056 2,071
2,084
2,099
2,112
M&M
1,244
1,252
1,261 1,269
1,277
MARUTI
8,715
8,754
8,803
8,842 8,892
NESTLEIND 19,421 19,587
19,718
19,884
20,016
NTPC
170
172
174
177
178
ONGC
139
142
143 145 146
POWERGRID
215
219
220
224
226
RELIANCE 2,654 2,668
2,692
2,707
2,731
SBILIFE 1,261 1,273
1,285
1,297
1,310
SBIN
604
611
614
621
625
SUNPHARMA
1,024
1,031
1,039
1,047
1,054
TCS
3,392
3,409
3,424
3,441
3,456
TATACONSUM
783
792
797
806 812
TATAMOTORS
422
425
431 435
441
TATASTEEL 111 114
115
117
118
TECHM
1,082
1,091
1,105
1,114
1,129
TITAN
2,571
2,593
2,612
2,634
2,652
ULTRACEMCO 7,086 7,142
7,214
7,270
7,341
UPL 776 789
798
812 821
WIPRO
408
410
413 415 417

www.angelone.in
Technical & Derivatives Report
DEC 06, 2022
*
Technical and Derivatives Team:
Sameet Chavan Chief Analyst – Technical & Derivatives sameet.chavan@angelone.in
Sneha Seth Senior Analyst – Technical & Derivatives sneha.seth@angelone.in
Rajesh Bhosale Technical Analyst rajesh.bhosle@angelone.in
Osho Krishan Senior Analyst – Technical & Derivatives osho.krishan@angelone.in
Research Team Tel: 022 – 39357600 Website: www.angelone.in
For Technical Queries E-mail: technicalresearch-cso@angelone.in
For Derivatives Queries E-mail: derivatives.desk@angelone.in
DISCLAIMER
Angel One Limited (hereinafter referred to as “Angel”) is a registered Member of National Stock Exchange of India Limited, Bombay
Stock Exchange Limited and Metropolitan Stock Exchange Limited. It is also registered as a Depository Participant with CDSL and
Portfolio Manager and investment advisor with SEBI. It also has registration with AMFI as a Mutual Fund Distributor. Angel One
Limited is a registered entity with SEBI for Research Analyst in terms of SEBI (Research Analyst) Regulations, 2014 vide registration
number INH000000164. Angel or its associates has not been debarred/ suspended by SEBI or any other regulatory authority for
accessing /dealing in securities Market.
This document is solely for the personal information of the recipient, and must not be singularly used as the basis of any investment
decision. Nothing in this document should be construed as investment or financial advice. Each recipient of this document should
make such investigations as they deem necessary to arrive at an independent evaluation of an investment in the securities of the
companies referred to in this document (including the merits and risks involved), and should consult their own advisors to determine
the merits and risks of such an investment.
Angel or its associates or research analyst or his relative may have actual/beneficial ownership of 1% or more in the securities of
the subject company at the end of the month immediately preceding the date of publication of the research report. Neither Angel or
its associates nor Research Analysts or his relative has any material conflict of interest at the time of publication of research report.
Angel or its associates might have received any compensation from the companies mentioned in the report during the period
preceding twelve months from the date of this report for services in respect of managing or co-managing public offerings, corporate
finance, investment banking or merchant banking, brokerage services or other advisory service in a merger or specific transaction
in the normal course of business. Angel or its associates did not receive any compensation or other benefits from the companies
mentioned in the report or third party in connection with the research report. Neither Angel nor its research analyst entity has been
engaged in market making activity for the subject company.
Reports based on technical and derivative analysis center on studying charts of a stock's price movement, outstanding positions and
trading volume, as opposed to focusing on a company's fundamentals and, as such, may not match with a report on a company's
fundamentals. Investors are advised to refer the Fundamental and Technical Research Reports available on our website to evaluate
the contrary view, if any.
The information in this document has been printed on the basis of publicly available information, internal data and other reliable
sources believed to be true, but we do not represent that it is accurate or complete and it should not be relied on as such, as this
document is for general guidance only. Angel One Limited or any of its affiliates/ group companies shall not be in any way responsible
for any loss or damage that may arise to any person from any inadvertent error in the information contained in this report. Angel One
Limited has not independently verified all the information contained within this document. Accordingly, we cannot testify, nor make
any representation or warranty, express or implied, to the accuracy, contents or data contained within this document. While Angel
One Limited endeavors to update on a reasonable basis the information discussed in this material, there may be regulatory,
compliance, or other reasons that prevent us from doing so.
This document is being supplied to you solely for your information, and its contents, information or data may not be reproduced,
redistributed or passed on, directly or indirectly.
Neither Angel One Limited, nor its directors, employees or affiliates shall be liable for any loss or damage that may arise from or in
connection with the use of this information. Angel or its associates or Research Analyst or his relative might have financial interest
in the subject company. Research analyst has not served as an officer, director or employee of the subject company.
