Classified as Public
November
0
6
, 2023
www.angelone.in
Technical & Derivatives Report
8
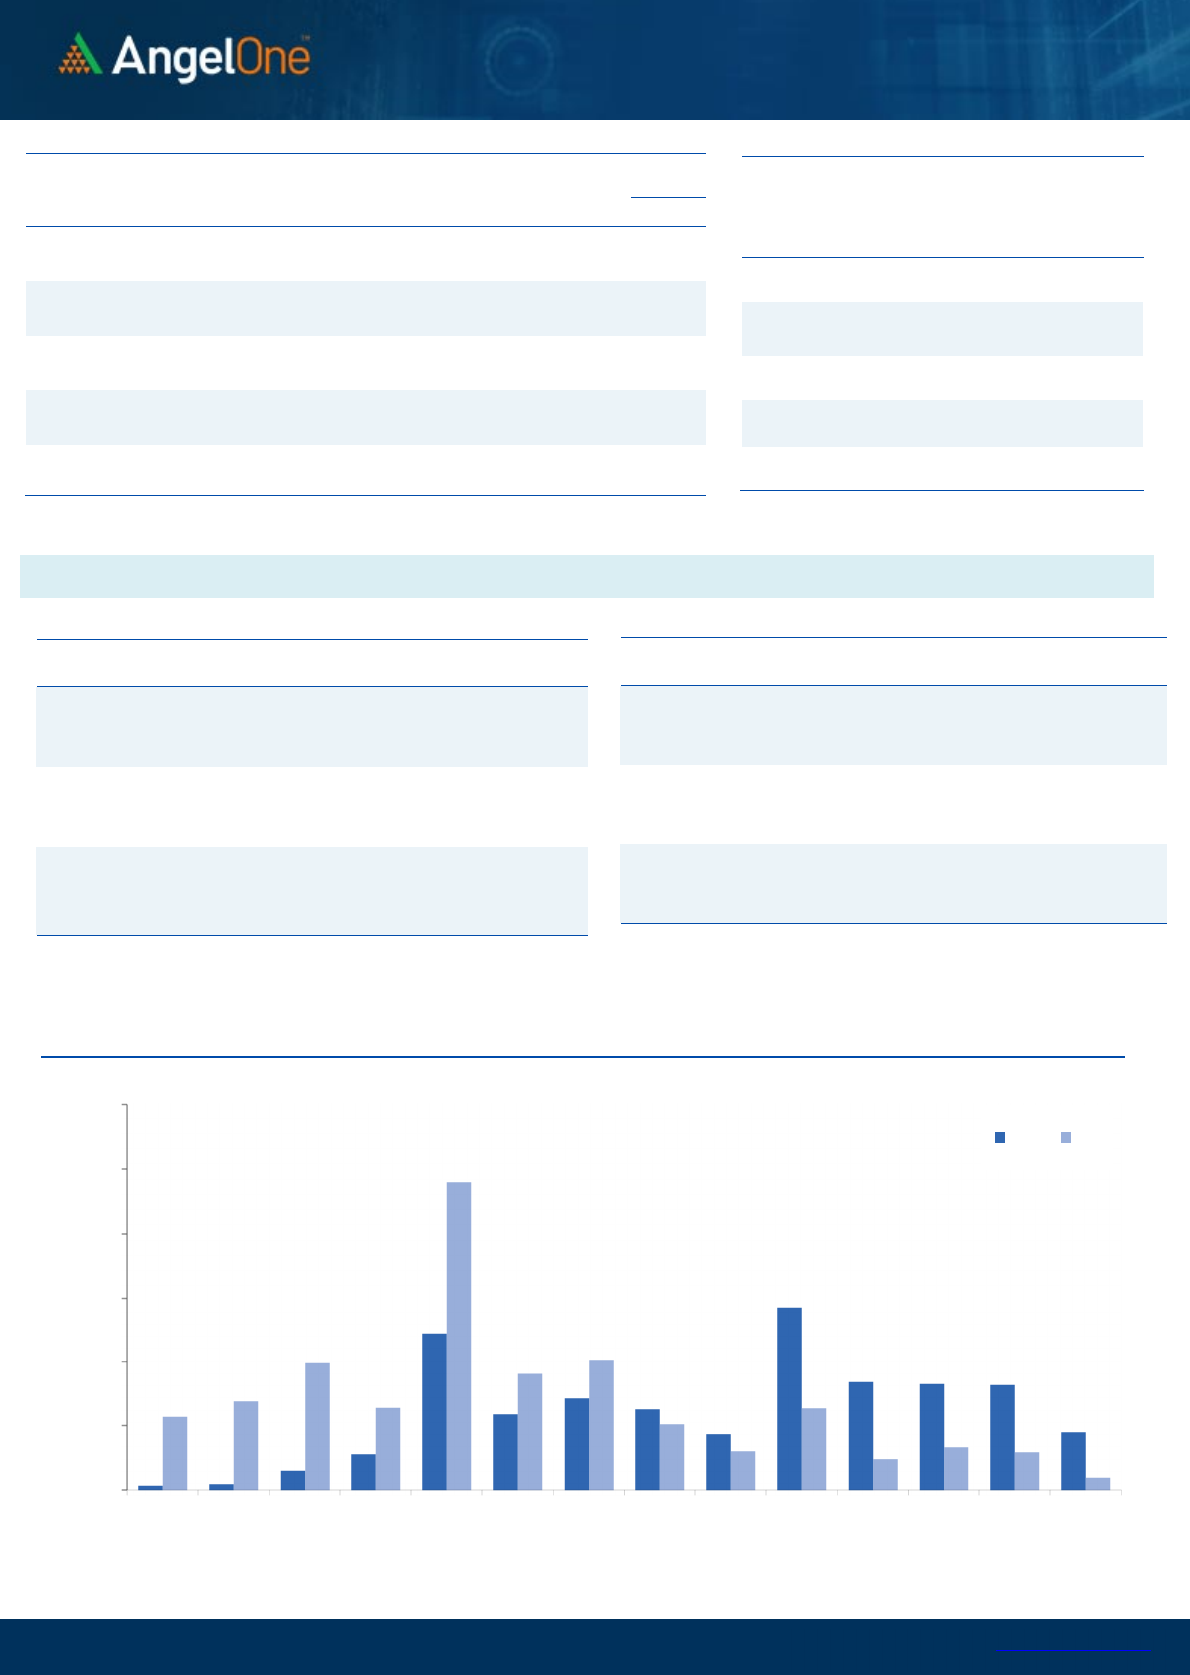
Nifty Bank Outlook (
4
3
3
1
8
)
During the last week, The banking index opened with a modestly
negative stance. After the initial dip on the first day, the index
experienced a strong recovery, reclaiming 43000. On Tuesday, it
started strongly, just above 43300, but as the day progressed, selling
pressure intensified with no sign of respite closing below 42900. Over
the following three sessions, the BankNifty gradually recouped its
losses, compensating for Tuesday's decline. The week concluded on a
positive note with gains of over a per cent after six weeks of negative
closures. Technically, things appeared gloomy after Tuesday's fall;
however, the index staged a strong recovery, which was indeed an
encouraging sign. Although it managed to end the week on a positive
note, the index remained tentative around the resistance zone of
43300-43400. Therefore, it will be interesting to observe the follow-
up action in this week. Early signs of completing the corrective phase
will only emerge with a sustained move beyond 44000. Until then, we
prefer to adopt a wait-and-watch approach and keep index trading
light. In terms of support levels, 43000-42800 is expected to provide
an immediate cushion in case of any intraday dip.
Key Levels
Support 1 – 43000 Resistance 1 – 43800
Support 2 – 42800 Resistance 2 – 44000
Exhibit 1: Nifty Daily Chart
Exhibit 2: Nifty Bank Daily Chart
Sensex (
6
4
364
) / Nifty (
1
9
231
)
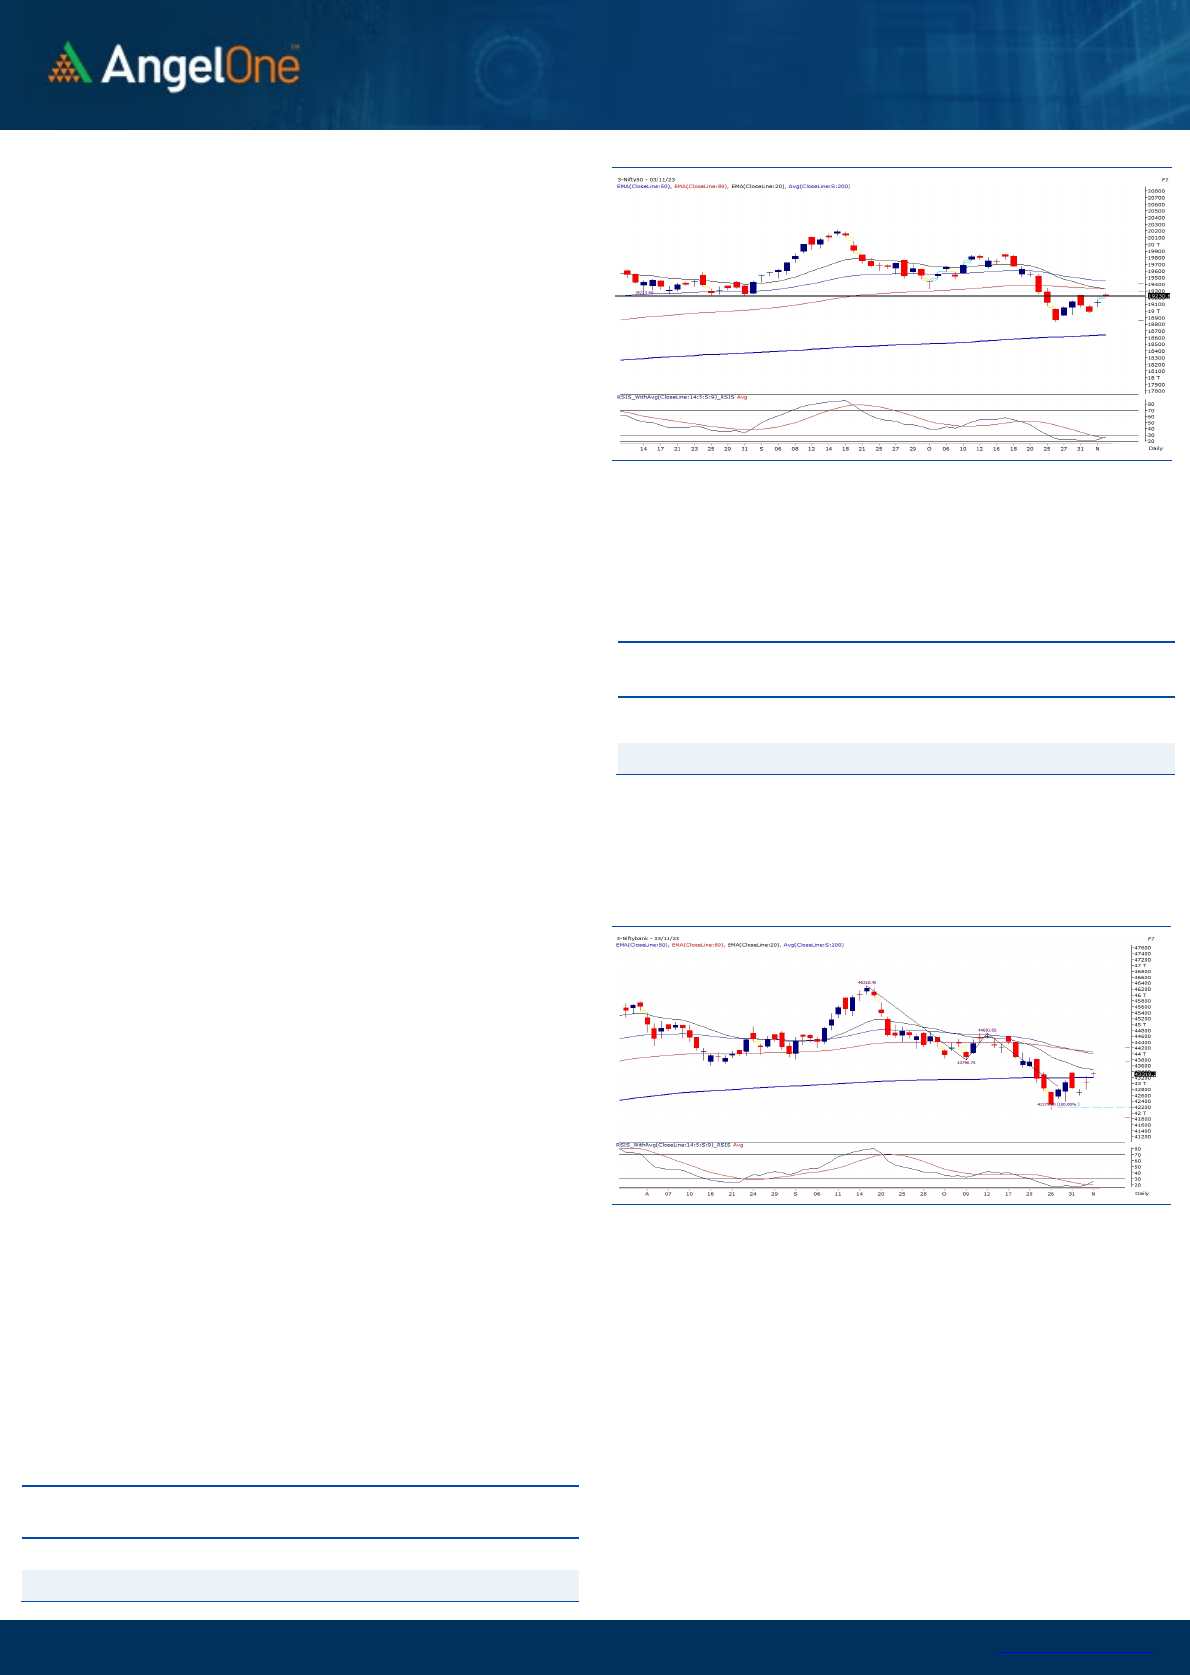
It was a week filled with notable events, and over the course of the
week, prices experienced a fierce battle between bulls and bears.
Eventually, with improved global cues, prices closed at the higher end
of the week’s range, putting an end to the recent series of losses. Nifty
ended the week with a 0.96% gain reclaiming the 19200 mark.
The week brought a sense of relief for the bulls, especially after the
sharp sell-off seen during fag end of the October month. The November
series has started on a positive note, primarily driven by two significant
factors: oversold market conditions and improved global cues. An
analysis of the weekly candle chart reveals that prices remained within
the trading range of the previous big bearish candle and have now re-
entered the region of uncertainty, ranging from 19200 to 19250, which
had witnessed a breakdown earlier. On the shorter time frame of the
hourly chart, a pattern of 'Higher Top Higher Bottom' has emerged,
though it hasn't displayed substantial bullish momentum. The future
trajectory of the market largely hinges on the sustainability of the
recent global market strength. If this strength endures, prices may
approach a key resistance level around 19350, which is a convergence
point of important moving averages (20EMA & 89EMA) and marks the
50% retracement of the recent decline. A breakthrough beyond this
point could indicate a shift in momentum favouring the bulls. On the
other hand, if prices hesitate at higher levels, we might witness a period
of consolidation leading up to the festive week, with support shifting
higher to the
19000
-
18900
range.
Traders are advised to closely monitor global developments and
keep a close watch on the aforementioned levels to make well-
informed decisions. Furthermore, it's prudent to focus on specific
stock opportunities, although caution is essential as recent market
movements have not displayed robust strength.
Key Levels
Support 1 – 19150 Resistance 1 – 19300
Support 2 – 19000 Resistance 2 – 19350

Classified as Public
www.angelone.in
Technical & Derivatives Report
November
0
6
, 2023
View
The Indian Equity market witnessed a smart recovery
during the week amidst global stability, wherein the
benchmark index Nifty50 surged nearly a percent on
a WoW basis, reclaiming 19200.
FIIs were net sellers in the cash market segment to
the tune of Rs. 12 cr. Simultaneously, they bought
worth Rs. 1022 cr in Index futures with an increase in
open interest, indicating short covering.
On the derivatives front, new longs have been
witnessed in key indices on a weekly time frame. On
the options front, the highest OI concentration could
be seen at 19200 put strike, followed by decent piling
around 19000 PE, suggesting an upliftment in the
support base. While on the higher end, the 19300-
19400 call strike witnessed some writings, indicating
intermediate resistance. FIIs remained net sellers in
equities on a net basis, though the quantum is
narrowing down. While curtailing bearish bets in
index futures segments resulted in a slight
advancement of the Long Short Ratio to 18% from
12% WoW. Considering the data, our market seems
slightly relieved, though one needs to maintain
caution and track global developments.
Comments
The Nifty futures open interest has decreased by 2.86%
and Bank Nifty futures open interest has decreased by
5.64% as the market closed at 19230.60.
The Nifty November future closed with a premium of
73 points against a premium of 105.60 points in the last
trading session. The December series closed at a
premium of 176.30 points.
The INDIA VIX has decreased from 11.08 to 10.88. At
the same time, the PCR-OI of Nifty has increased from
0.89 to 0.96.
A few of the liquid counters where we have seen high
cost of carry are APOLLOHOSP, CONCOR, LALPATHLAB,
MRF and ATUL.
Historical Volatility
SCRIP HV
IGL 38.24
MGL 37.42
HAVELLS 30.15
ITC 23.32
MPHASIS 37.25
Nifty Vs OI
18400
18600
18800
19000
19200
19400
19600
19800
20000
20200
8,000
9,000
10,000
11,000
12,000
13,000
14,000
15,000
10-18 10-23 10-26 10-30 11-1 11-3
Openinterest Nifty
OI Gainers
SCRIP OI
OI
CHG. (%)
PRICE
PRICE
CHG. (%)
MRF 55550 27.35 107723.40 -3.11
MCX 3158000 19.80 2545.55 4.60
ALKEM 1160400 13.36 3808.95 0.16
PETRONET 39858000 12.46 196.05 0.64
LALPATHLAB 977700 11.65 2594.60 6.08
GODREJPROP 3951525 11.38 1784.40 3.88
LUPIN 7255600 10.66 1186.55 1.42
ONGC 31750950 9.93 190.00 1.88
OI Losers
SCRIP OI
OI
CHG. (%)
PRICE
PRICE
CHG. (%)
LICHSGFIN 17600 -14.51 462.40 3.16
INFY 22766000 -10.38 1389.05 1.31
HEROMOTOCO 3396300 -9.61 3089.45 1.34
ZYDUSLIFE 6552000 -6.73 584.85 1.22
GUJGASLTD 8508750 -6.55 419.45 2.30
LTIM 1561800 -6.43 5134.80 1.88
PERSISTENT 1584650 -5.52 6286.00 0.77
IGL 16878125 -5.20 400.55 2.37
Put-Call Ratio
SCRIP PCR (OI) PCR (VOL)
NIFTY 0.96 0.99
BANKNIFTY 1.01 0.87
RELIANCE 0.59 0.53
ICICIBANK 0.70 0.48
INFY 0.48 0.45
Classified as Public
www.angelone.in
Technical & Derivatives Report
November
0
6
, 2023
Note: Above mentioned Bullish or Bearish Spreads in Nifty (Nov Series) are given as an information and not as a recommendation.
Nifty Spot =
1
9
230.60
FII Statistics for
November
0
3
, 2023
Detail Buy
Contracts
OI Value
(in Cr.)
Sell Net
CHANGE
INDEX
FUTURES
2981.54 1959.14 1022.40
251726 20626.46 (2.11)
INDEX
OPTIONS
654224.40 660021.45 (5797.05) 3716743 297159.37 32.28
STOCK
FUTURES
13648.53 11259.07 2389.46
2548860 176894.79 0.37
STOCK
OPTIONS
15729.62 15716.87 12.75
186243 13128.38 9.17
Total
686584.09
688956.53
(2372.44) 6703572
507809.00
16.04
Turnover on
November
0
3
, 2023
Instrument
No. of
Contracts
Turnover
(in Cr.)
Change
(%)
Index Futures
231407 18449.39
-36.97
Index Options
136089955
31751.02
-39.01
Stock Futures
892339 64276.91
-3.56
Stock Options
3785651 4427.21 1.86
Total
37,85,651 4427.21 -21.94
Bull-Call Spreads
Action Strike Price Risk Reward BEP
Buy
19200
261.00 59.45
40.55
19259.45
Sell
19300
201.55
Buy
19200 261.00 109.15
90.85
19309.15
Sell
19400 151.85
Buy
19300
201.55 49.70 50.30 19349.70
Sell
19400 151.85
Bear-Put Spreads
Action Strike Price Risk Reward BEP
Buy
19400 243.70
49.00
51.00
19351.00
Sell 19300 194.70
Buy 19400 243.70
89.35
110.65
19310.65
Sell
19200 154.35
Buy
19300 194.70
40.35 59.65 19259.65
Sell 19200 154.35
Nifty Put
-
Call Analysis
,0
1000,000
2000,000
3000,000
4000,000
5000,000
6000,000
18600 18700 18800 18900 19000 19100 19200 19300 19400 19500 19600 19700 19800 19900
Call Put

Classified as Public
www.angelone.in
Technical & Derivatives Report
November
0
6
, 2023
`
Daily Pivot Levels for Nifty Constituents
Scrips S2 S1 PIVOT R1 R2
ADANIENT 2,177 2,204 2,241 2,268 2,305
ADANIPORTS 769 782 791 804 812
APOLLOHOSP 4,857 5,005 5,085 5,233 5,314
ASIANPAINT 2,927 2,952 2,968 2,993 3,008
AXISBANK 977 983 987 993 997
BAJAJ-AUTO 5,294 5,331 5,354 5,392 5,415
BAJFINANCE 7,275 7,343 7,441 7,509 7,606
BAJAJFINSV 1,487 1,511 1,553 1,577 1,618
BPCL 358 360 362 363 365
BHARTIARTL 917 924 929 936 940
BRITANNIA 4,490 4,515 4,549 4,573 4,607
CIPLA 1,194 1,200 1,210 1,216 1,226
COALINDIA 308 310 312 314 317
DIVISLAB 3,312 3,331 3,360 3,379 3,407
DRREDDY 5,166 5,214 5,296 5,344 5,426
EICHERMOT 3,308 3,368 3,413 3,473 3,518
GRASIM 1,876 1,886 1,901 1,911 1,925
HCLTECH 1,248 1,257 1,272 1,281 1,296
HDFCBANK 1,476 1,480 1,486 1,490 1,495
HDFCLIFE 617 619 622 625 628
HEROMOTOCO 3,052 3,071 3,091 3,109 3,129
HINDALCO 470 472 477 480 484
HINDUNILVR 2,476 2,493 2,503 2,519 2,529
ICICIBANK 924 929 932 937 939
INDUSINDBK 1,431 1,441 1,458 1,468 1,485
INFY 1,372 1,381 1,386 1,395 1,401
ITC 430 431 433 435 436
JSW STEEL 730 738 743 751 756
KOTAKBANK 1,722 1,727 1,736 1,742 1,750
LT 2,878 2,895 2,921 2,938 2,964
LTIMINDTREE 5,025 5,080 5,114 5,169 5,203
M&M 1,445 1,457 1,473 1,485 1,500
MARUTI 10,167 10,222 10,296 10,351 10,425
NESTLEIND 23,835 23,917 24,059 24,140 24,282
NTPC 232 233 234 235 236
ONGC 184 187 189 192 194
POWERGRID 201 203 205 206 208
RELIANCE 2,304 2,312 2,323 2,331 2,343
SBILIFE 1,311 1,320 1,335 1,344 1,359
SBIN 571 575 577 581 583
SUNPHARMA 1,125 1,133 1,139 1,147 1,154
TCS 3,317 3,334 3,361 3,378 3,405
TATACONSUM
907 910 915 918 923
TATAMOTORS 633 640 653 660 673
TATASTEEL 116 117 118 118 119
TECHM 1,108 1,121 1,128 1,141 1,148
TITAN 3,173 3,224 3,256 3,307 3,339
ULTRACEMCO 8,402 8,462 8,496 8,556 8,590
UPL 541 546 549 553 557
WIPRO 380 382 384 386 388

Classified as Public
www.angelone.in
Technical & Derivatives Report
November
0
6
, 2023
Technical and Derivatives Team:
Sameet Chavan Head Research – Technical & Derivatives sameet.chavan@angelone.in
Sneha Seth Senior Analyst – Technical & Derivatives sneha.seth@angelone.in
Rajesh Bhosale Analyst - Technical rajesh.bhosle@angelone.in
Osho Krishan Senior Analyst – Technical & Derivatives osho.krishan@angelone.in
Hitesh Rathi Analyst – Technical & Derivatives hitesh.rathi@angelone.in
Research Team Tel: 022 – 39357600 Website: www.angelone.in
For Technical Queries E-mail: technicalresearch-cso@angelone.in
For Derivatives Queries E-mail: derivatives.desk@angelone.in
DISCLAIMER
We, Angel One Limited (hereinafter referred to as “Angel”) a company duly incorporated under the provisions of the Companies Act, 1956 with
its registered office at 601, 6th Floor, Ackruti Star, Central Road, MIDC, Andheri East, Mumbai – 400093, CIN: (L67120MH1996PLC101709) and
duly registered as a member of National Stock Exchange of India Limited, Bombay Stock Exchange Limited, Metropolitan Stock Exchange Limited,
Multi Commodity Exchange of India Ltd and National Commodity & Derivatives Exchange Ltd. Angel One limited is a company engaged in
diversified financial services business including securities broking, DP services, distribution of Mutual Fund products. It is also registered as a
Depository Participant with CDSL and Portfolio Manager and Investment Adviser with SEBI. It also has registration with AMFI as a Mutual Fund
Distributor. Angel One Limited is a registered entity with SEBI for Research Analyst in terms of SEBI (Research Analyst) Regulations, 2014 vide
registration number INH000000164 and also registered with PFRDA as PoP ,Registration No.19092018. Angel Group does not have any joint
ventures or associates. Angel One Limited is the ultimate parent company of the Group. Angel or its associates has not been debarred/ suspended
by SEBI or any other regulatory authority for accessing /dealing in securities Market.
AOL was merged with Angel Global Capital Private Limited and subsequently name of Angel Global Capital Private Limited was changed to Angel
Broking Private Limited (AOL) pursuant to scheme of Amalgamation sanctioned by the Hon'ble High Court of Judicature at Bombay by Orders
passed in Company Petition No 710 of 2011 and the approval granted by the Registrar of Companies. Further, name of Angel Broking Private
Limited again got changed to Angel Broking Limited (AOL) pursuant to fresh certificate of incorporation issued by Registrar of Companies (ROC)
dated June 28, 2018. Further name of Angel Broking name changed to Angel One Ltd pursuant to fresh certificate of incorporation issued by
Registrar of Companies (ROC) dated 23-09-21.
In case of any grievances please write to: support@angelone.in, Compliance Officer Details: Name : Hiren Thakkar, Tel No. –08657864228, Email
id - compliance@angelone.in
Registration granted by SEBI and certification from NISM in no way guarantee performance of the intermediary or provide any assurance of returns
to investors.
This document is solely for the personal information of the recipient, and must not be singularly used as the basis of any investment decision.
Nothing in this document should be construed as investment or financial advice. Each recipient of this document should make such investigations
as they deem necessary to arrive at an independent evaluation of an investment in the securities of the companies referred to in this document
(including the merits and risks involved), and should consult their own advisors to determine the merits and risks of such an investment.
Angel or its associates or research analyst or his relative may have actual/beneficial ownership of 1% or more in the securities of the subject
company at the end of the month immediately preceding the date of publication of the research report. Neither Angel or its associates nor
Research Analysts or his relative has any material conflict of interest at the time of publication of research report.
Angel or its associates might have received any compensation from the companies mentioned in the report during the period preceding twelve
months from the date of this report for services in respect of managing or co-managing public offerings, corporate finance, investment banking or
merchant banking, brokerage services or other advisory service in a merger or specific transaction in the normal course of business. Angel or its
associates did not receive any compensation or other benefits from the companies mentioned in the report or third party in connection with the
research report. Neither research entity nor research analyst has been engaged in market making activity for the subject company.

Classified as Public
www.angelone.in
Technical & Derivatives Report
November
0
6
, 2023
*
Reports based on technical and derivative analysis center on studying charts of a stock's price movement, outstanding positions and trading
volume, as opposed to focusing on a company's fundamentals and, as such, may not match with a report on a company's fundamentals. Investors
are advised to refer the Fundamental and Technical Research Reports available on our website to evaluate the contrary view, if any.
The information in this document has been printed on the basis of publicly available information, internal data and other reliable sources believed
to be true, but we do not represent that it is accurate or complete and it should not be relied on as such, as this document is for general guidance
only. Angel One Limited or any of its affiliates/ group companies shall not be in any way responsible for any loss or damage that may arise to any
person from any inadvertent error in the information contained in this report. Angel One Limited does not warrant the accuracy, adequacy or
completeness of the service, information and materials and expressly disclaims liability for errors or omissions in the service, information and
materials. While Angel One Limited endeavours to update on a reasonable basis the information discussed in this material, there may be
regulatory, compliance, or other reasons that prevent us from doing so.
This document is being supplied to you solely for your information, and its contents, information or data may not be reproduced, redistributed or
passed on, directly or indirectly.
Neither Angel One Limited, nor its directors, employees or affiliates shall be liable for any loss or damage that may arise from or in connection
with the use of this information. Angel or its associates or Research Analyst or his relative might have financial interest in the subject company.
Research analyst has not served as an officer, director or employee of the subject company.
Investment in securities market are subject to market risks. Read all the related documents carefully before investing.
Any communication sent to clients on phone numbers or e-mail ids registered with the Trading Member is meant for client consumption and such
material should not be redistributed. Brokerage will not exceed SEBI prescribed limit. Any Information provided by us through any medium based
on our research or that of our affiliates or third parties or other external sources is subject to domestic and international market conditions and
we do not guarantee the availability or otherwise of any securities or other instruments and such Information is merely an estimation of certain
investments, and we have not and shall not be deemed to have assumed any responsibility for any such Information. You should seek independent
professional advice and/or tax advice regarding the suitability of any investment decision whether based on any Information provided by us
through the Site from inhouse research or third party reports or otherwise.
The report and information contained herein is strictly confidential and meant solely for the selected recipient and may not be altered in any way,
transmitted to, copied or distributed, in part or in whole, to any other person or to the media or reproduced in any form, without prior written
consent.
