March 06, 2023
www.angelone.in
Technical & Derivatives Report
Nifty Bank
Outlook (
41251
)
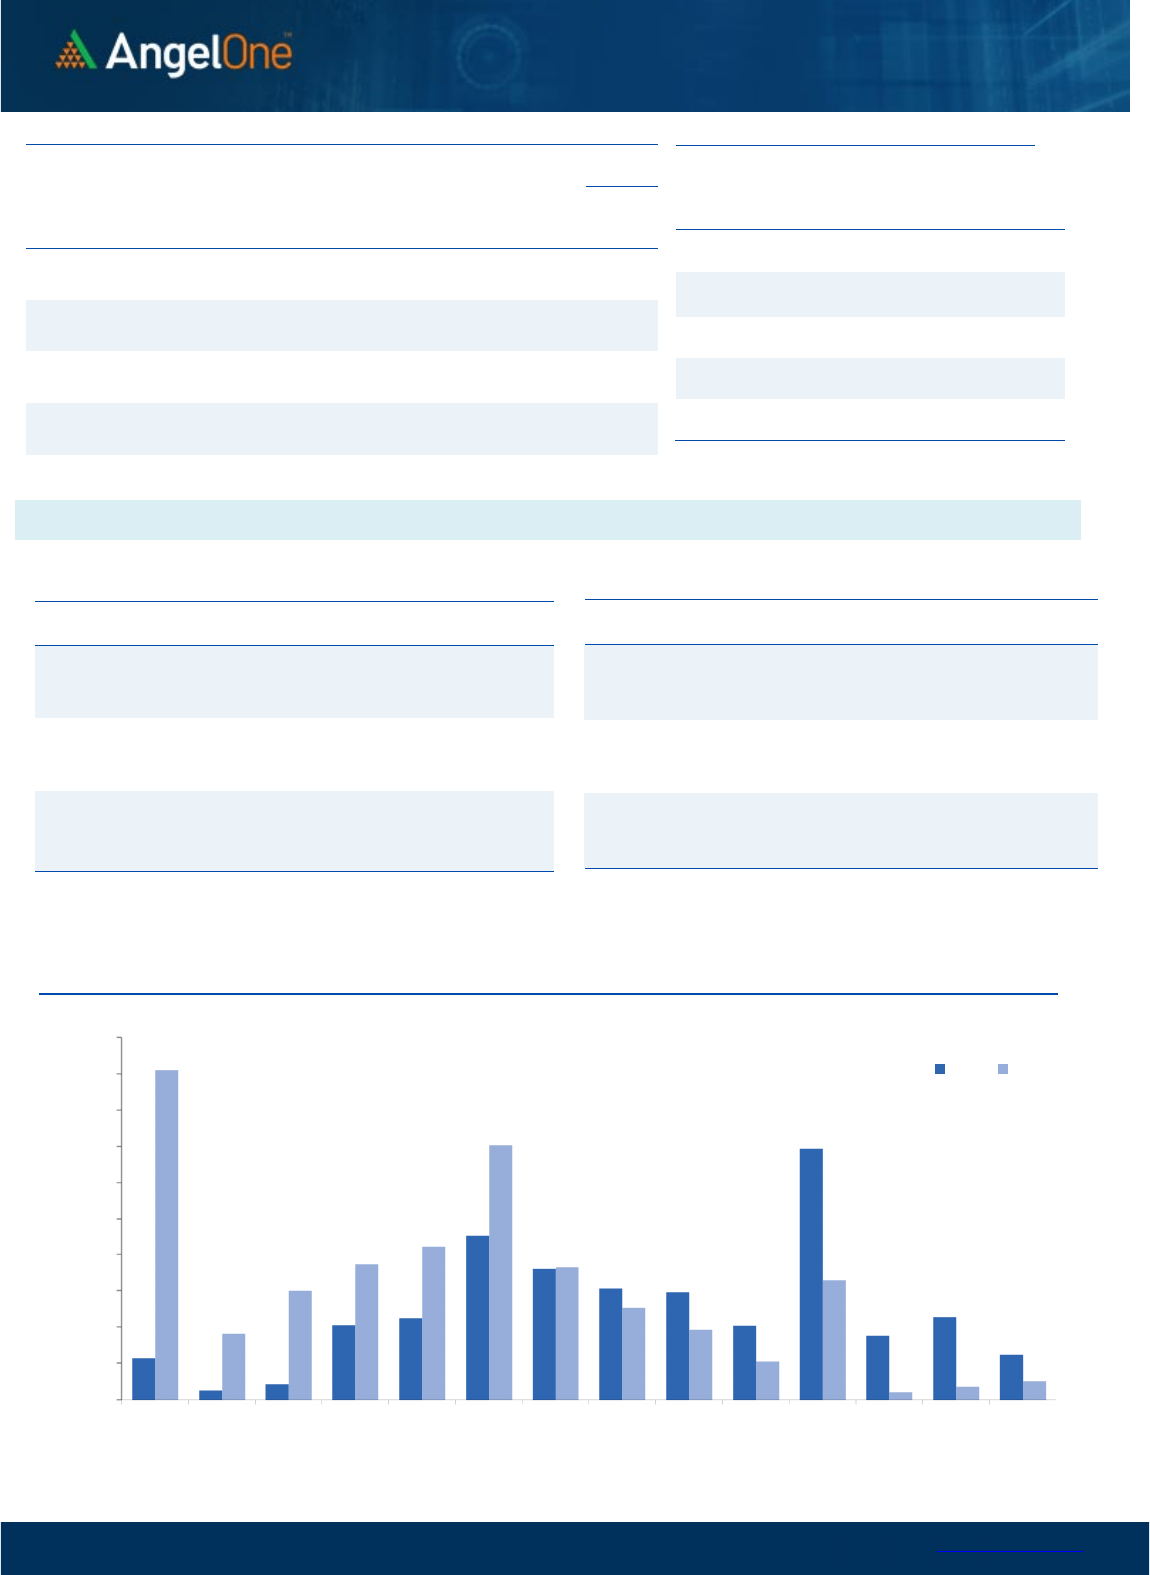
Bank Nifty had a spectacular week as we saw good recovery initially
after a gap down opening on Monday. It ensured there is no follow
through selling which could have otherwise dampened the overall
sentiments in the broader markets. All intra-week dips were
successfully absorbed by the bulls which eventually turned into a
strong breakthrough move on Friday, courtesy to positive
developments with respect to banking counters. Eventually, the
banking index ended the week on a pleasant note by adding 3%
from previous week’s close.
During the previous week, we highlighted a ‘Dragon Fly Doji’
pattern around the key support of Budget Day low and reiterated
against going short in the markets. Prices did respect this crucial
support and with a strong bounce from there we are now
witnessing a good large bullish candle on the weekly chart. Also,
the prices have closed around a crucial juncture of the Descending
Trendline resistance formed by joining major swing highs
coinciding with 89EMA.
Key Levels
Support 1 – 41000 Resistance 1 – 41680
Support 2 – 40800 Resistance 2 – 42000
Exhibit 1: Nifty Daily Chart
Exhibit 2: Nifty Bank Daily Chart
Sensex (
5
9809
) / Nifty (
1
7
594
)
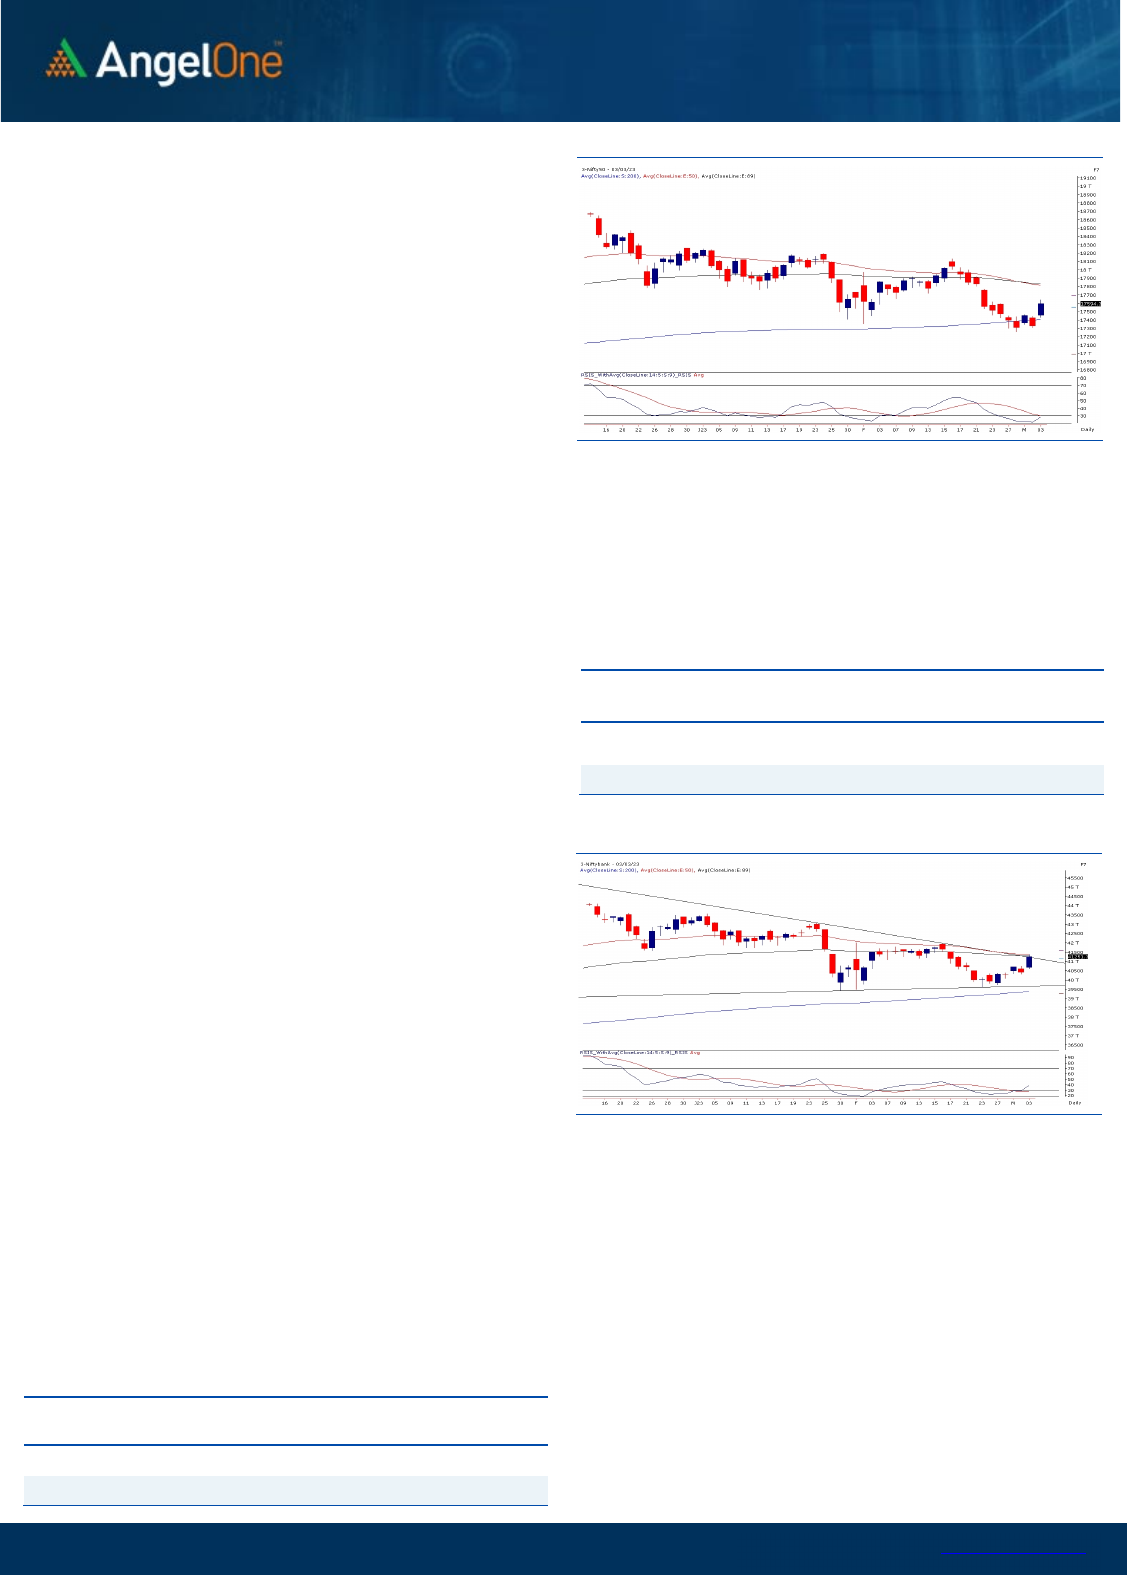
Our market started the week on a bleak note taking cues from the
weak global bourses, wherein the benchmark index tested the
Budget day’s swing low and dented market sentiments. Nifty
struggled near the 200 SMA throughout the week until the last
session, when a robust recovery was seen in the broader market
space. Eventually, the week closed on a positive note, procuring
0.74 percent from its previous week’s closure and Nifty settled a tad
below the 17600 level.
The upsurge in the Adani group companies post the block deal has
its rub of effect on the PSU Banks, eventually spreading the cheer in
the broader market. From a technical perspective, the recent price
action could be seen as constructive development for our markets
as the index witnessed a modest recovery from the 200 SMA and
made a strong closure on the daily time frame. As far as levels are
concerned, 17500 is now likely to be seen as the immediate support
zone, while the sacrosanct support lies around the 17350-17400
zone, coinciding with the 200 SMA. On the flip side, the bearish gap
of 17770-17800 is expected to act as the sturdy hurdle for Nifty in a
comparable period.
Going forward, we remain sanguine and would advise the
traders to utilize the dips to add long position in the index. The
participation from the high-beta Banking space has provided the
much needed impetus and is likely to continue in the near term.
Simultaneously, one should also keep a close tab on the Mid-cap
space, which is expected to provide immense trading
opportunities in the near period.
Key Levels
Support 1 – 17500 Resistance 1 – 17700
Support 2 – 17400 Resistance 2 – 17800
Considering the strong positive momentum on Friday and the
fresh buy signal in the RSI Smoothened indicator, we expect the
outperformance to continue. Traders are hence advised to
remain upbeat and use dips as a buying opportunity. In such a
scenario, immediate support is seen around 41000 followed by
40800 level whereas 41680 – 42000 is seen as next resistance
levels.

www.angelone.in
Technical & Derivatives Report
March 06, 2023
View
After recent sell-off finally we saw a sharp rally on
Friday to conclude the week around 17600 mark.
FIIs were net buyers in the cash market segment to
the tune of Rs. 246 crores. Simultaneously, in Index
futures, they bought worth Rs. 3938 crores with
decrease in open interest, indicating short covering
on Friday’s session.
During the selling, we witnessed decent amount of
shorts in key indices but on the final day of the week
short covering was seen in Nifty and banking index
added fresh longs. In options front, put writers
added huge positions in 17400-17600 strikes,
suggesting strong base formation around 17400-
17500 now. On the other side, 17700-17900 call
strikes added some fresh bets. Stronger hands have
covered shorts, led ‘Long Short Ratio’ to surge to 23%
from 18% WoW. The above data points hints, market
has certainly bottom out and we may see extension
of upmove in the festive week.
Comments
The Nifty futures open interest has decreased by 5.53%
and Bank Nifty futures open interest has increased by
5.34% as the market closed at 17594.35.
The Nifty March future closed with a premium of 77.2
point against a premium of 77.5 point in the last trading
session. The April series closed at a premium of 175.95
point.
The INDIA VIX decreased from 12.97 to 12.18. At the
same time, the PCR-OI of Nifty has increased from 0.76
to 1.17.
Few of the liquid counters where we have seen high
cost of carry are ADANIENT, RAIN, CHOLAFIN,
HINDPETRO, AND ZYDUSLIFE.
Historical Volatility
SCRIP HV
ADANIENT 94.72
ADANIPORTS 60.30
SBIN 34.38
ACC 41.37
BHARTIARTL 29.43
Nifty Vs OI
17400
17500
17600
17700
17800
17900
18000
18100
18200
4,000
6,000
8,000
10,000
12,000
14,000
16,000
2/10 2/14 2/16 2/20 2/23 2/27 3/1 3/3
Openinterest Nifty
OI Gainers
SCRIP OI
OI
CHG. (%)
PRICE
PRICE
CHG. (%)
TATASTEEL 235460500 10.49 107.00 2.33
PFC 52359000 8.56 155.15 3.48
BHARATFORG 7738000 8.04 825.05 -1.05
M&MFIN 24152000 7.82 253.95 0.67
CIPLA 13433550 7.32 878.65 -0.90
VOLTAS 5623200 7.07 912.85 -0.33
APOLLOTYRE 12631500 6.52 315.85 0.63
NAVINFLUOR 427650 6.14 4220.50 0.94
OI Losers
SCRIP OI
OI
CHG. (%)
PRICE
PRICE
CHG. (%)
ADANIPORTS 43603750 -8.08 684.60 9.72
MANAPPURAM 37968000 -7.12 106.10 1.77
MCX 922800 -6.18 1446.40 3.09
ATUL 158400 -5.50 7051.70 0.65
MARUTI 2173200 -5.15 8601.20 0.67
SRF 3657750 -4.39 2271.95 0.99
BANKBARODA 96273450 -4.25 172.90 4.77
LT 7800600 -4.09 2152.00 1.34
Put-Call Ratio
SCRIP PCR (OI) PCR (VOL)
NIFTY 1.17 0.84
BANKNIFTY 1.28 0.83
RELIANCE 0.64 0.43
ICICIBANK 0.74 0.54
INFY 0.53 0.43
www.angelone.in
Technical & Derivatives Report
March 06, 2023
Note: Above mentioned Bullish or Bearish Spreads in Nifty (March Series) are given as an information and not as a recommendation.
Nifty Spot =
1
7
594.35
0900
Lot Size = 75
FII Statistics for
March 0
3
, 202
3
Detail Buy
Contracts
Open
Interest
Value
(in Cr.)
Sell
Net
CHANGE
INDEX
FUTURES
8639.34
4701.03
3938.31
166437
15349.76
(10.73)
INDEX
OPTIONS
1085324.47
1090825.67
(5501.20) 2462326
225909.51
29.60
STOCK
FUTURES
11410.39
8935.03
2475.36
2137977
142266.40
(0.23)
STOCK
OPTIONS
9353.74
9523.24
(169.50) 122346
8242.07
3.36
Total 1114727.94
1113984.97
742.97
4889086
391767.74
12.45
Turnover
on
March
0
3
, 202
3
Instrumen
t
No. of
Contracts
Turnover
( in Cr. )
Change
(%)
Index Futures
450463
42866.07 40.62
Index Options
1543868
39
49213.22 -4.66
Stock Futures
885967
56466.01 20.07
Stock Options
3424912
5000.56 38.91
Total
3,424,91
2
5000.56 15.69
Bull-Call Spreads
Action Strike Price Risk Reward BEP
Buy
17600 231.95
55.50
44.50
17655.50
Sell
17700 176.45
Buy
17600 231.95
104.20
95.80
17704.20
Sell
17800 127.75
Buy
17700 176.45
48.70 51.30 17748.70
Sell
17800 127.75
Bear-Put Spreads
Action Strike Price Risk Reward BEP
Buy
17600 166.35
35.60
64.40
17564.40
Sell 17500 130.75
Buy 17600 166.35
62.60
137.40
17537.40
Sell
17400 103.75
Buy
17500 130.75
27.00 73.00 17473.00
Sell 17400 103.75
Nifty Put-Call Analysis
,0
500,000
1000,000
1500,000
2000,000
2500,000
3000,000
3500,000
4000,000
4500,000
5000,000
17000 17100 17200 17300 17400 17500 17600 17700 17800 17900 18000 18100 18200 18300
Call Put

www.angelone.in
Technical & Derivatives Report
March 06, 2023
`
Daily
Pivot Levels for Nifty
Constituents
Scrips
S2
S1
PIVOT
R1
R2
ADANIENT
1,603
1,741
1,824
1,962
2,044
ADANIPORTS 626 655
680
709
733
APOLLOHOSP
4,365
4,386
4,416
4,438
4,467
ASIANPAINT
2,789
2,809
2,831
2,850
2,872
AXISBANK 839 846
852
859
865
BAJAJ-AUTO
3,675
3,704
3,726
3,754
3,776
BAJFINANCE
6,037
6,068
6,105
6,136
6,173
BAJAJFINSV
1,337
1,346
1,355
1,365
1,374
BPCL 318 320
322
323
326
BHARTIARTL 736 750
758
772
780
BRITANNIA
4,348
4,380
4,412
4,444
4,477
CIPLA 868 873
883
888
898
COALINDIA 220 221
224
225
228
DIVISLAB
2,812
2,831
2,860
2,879
2,908
DRREDDY
4,329
4,383
4,415
4,470
4,502
EICHERMOT
3,094
3,110
3,131
3,148
3,168
GRASIM
1,578
1,587
1,600
1,609
1,621
HCLTECH
1,101
1,110
1,120
1,129
1,139
HDFCBANK
1,576
1,596
1,608
1,628
1,640
HDFCLIFE
477
484
488
494
499
HDFC
2,584
2,615
2,638
2,669
2,691
HEROMOTOCO
2,444
2,453
2,466
2,475
2,488
HINDALCO 409 413
416
420
423
HINDUNILVR
2,438
2,454
2,472
2,489
2,506
ICICIBANK 841 855
864
878
887
INDUSINDBK
1,093
1,110
1,121
1,138
1,150
INFY
1,464
1,472
1,481
1,488
1,498
ITC 373 379
382
388
391
JSW STEEL 672 677
681
687
691
KOTAKBANK
1,700
1,726
1,745
1,771
1,790
LT
2,120
2,136
2,148
2,164
2,176
M&M
1,243
1,256
1,266
1,279
1,290
MARUTI
8,514
8,558
8,593
8,637
8,672
NESTLEIND
18,281
18,365
18,490
18,575
18,699
NTPC 170 171
173
175
177
ONGC 152 153
154
155
157
POWERGRID 218 220
223
225
228
RELIANCE
2,322
2,353
2,373
2,405
2,425
SBILIFE
1,088
1,109
1,121
1,141
1,153
SBIN 533 547
556
570
578
SUNPHARMA 953 960
965
972
977
TCS
3,317
3,330
3,344
3,356
3,371
TATACONSUM
703 706
710
713
717
TATAMOTORS 418 423
427
432
435
TATASTEEL 104 106
106
108
109
TECHM
1,059
1,072
1,096
1,109
1,133
TITAN
2,342
2,369
2,385
2,413
2,429
ULTRACEMCO
7,090
7,153
7,251
7,315
7,413
UPL 700 705
710
715
720
WIPRO 388 389
390
392
393

www.angelone.in
Technical & Derivatives Report
March 06, 2023
*
Technical and Derivatives Team:
Sameet Chavan Chief Analyst – Technical & Derivatives sameet.chavan@angelone.in
Sneha Seth Senior Analyst – Technical & Derivatives sneha.seth@angelone.in
Rajesh Bhosale Technical Analyst rajesh.bhosle@angelone.in
Osho Krishan Senior Analyst – Technical & Derivatives osho.krishan@angelone.in
Research Team Tel: 022 – 39357600 Website: www.angelone.in
For Technical Queries E-mail: technicalresearch-cso@angelone.in
For Derivatives Queries E-mail: derivatives.desk@angelone.in
DISCLAIMER
Angel One Limited (hereinafter referred to as “Angel”) is a registered Member of National Stock Exchange of India Limited, Bombay Stock Exchange
Limited and Metropolitan Stock Exchange Limited. It is also registered as a Depository Participant with CDSL and Portfolio Manager and investment
advisor with SEBI. It also has registration with AMFI as a Mutual Fund Distributor. Angel One Limited is a registered entity with SEBI for Research
Analyst in terms of SEBI (Research Analyst) Regulations, 2014 vide registration number INH000000164. Angel or its associates has not been
debarred/ suspended by SEBI or any other regulatory authority for accessing /dealing in securities Market.
This document is solely for the personal information of the recipient, and must not be singularly used as the basis of any investment decision.
Nothing in this document should be construed as investment or financial advice. Each recipient of this document should make such investigations
as they deem necessary to arrive at an independent evaluation of an investment in the securities of the companies referred to in this document
(including the merits and risks involved), and should consult their own advisors to determine the merits and risks of such an investment.
Angel or its associates or research analyst or his relative may have actual/beneficial ownership of 1% or more in the securities of the subject
company at the end of the month immediately preceding the date of publication of the research report. Neither Angel or its associates nor
Research Analysts or his relative has any material conflict of interest at the time of publication of research report.
Angel or its associates might have received any compensation from the companies mentioned in the report during the period preceding twelve
months from the date of this report for services in respect of managing or co-managing public offerings, corporate finance, investment banking or
merchant banking, brokerage services or other advisory service in a merger or specific transaction in the normal course of business. Angel or its
associates did not receive any compensation or other benefits from the companies mentioned in the report or third party in connection with the
research report. Neither Angel nor its research analyst entity has been engaged in market making activity for the subject company.
Reports based on technical and derivative analysis center on studying charts of a stock's price movement, outstanding positions and trading
volume, as opposed to focusing on a company's fundamentals and, as such, may not match with a report on a company's fundamentals. Investors
are advised to refer the Fundamental and Technical Research Reports available on our website to evaluate the contrary view, if any.
The information in this document has been printed on the basis of publicly available information, internal data and other reliable sources believed
to be true, but we do not represent that it is accurate or complete and it should not be relied on as such, as this document is for general guidance
only. Angel One Limited or any of its affiliates/ group companies shall not be in any way responsible for any loss or damage that may arise to any
person from any inadvertent error in the information contained in this report. Angel One Limited has not independently verified all the information
contained within this document. Accordingly, we cannot testify, nor make any representation or warranty, express or implied, to the accuracy,
contents or data contained within this document. While Angel One Limited endeavors to update on a reasonable basis the information discussed
in this material, there may be regulatory, compliance, or other reasons that prevent us from doing so.
This document is being supplied to you solely for your information, and its contents, information or data may not be reproduced, redistributed or
passed on, directly or indirectly.
Neither Angel One Limited, nor its directors, employees or affiliates shall be liable for any loss or damage that may arise from or in connection
with the use of this information. Angel or its associates or Research Analyst or his relative might have financial interest in the subject company.
Research analyst has not served as an officer, director or employee of the subject company.
