DEC 05, 2022
www.angelone.in
Technical & Derivatives Report
xOOOOOOOO
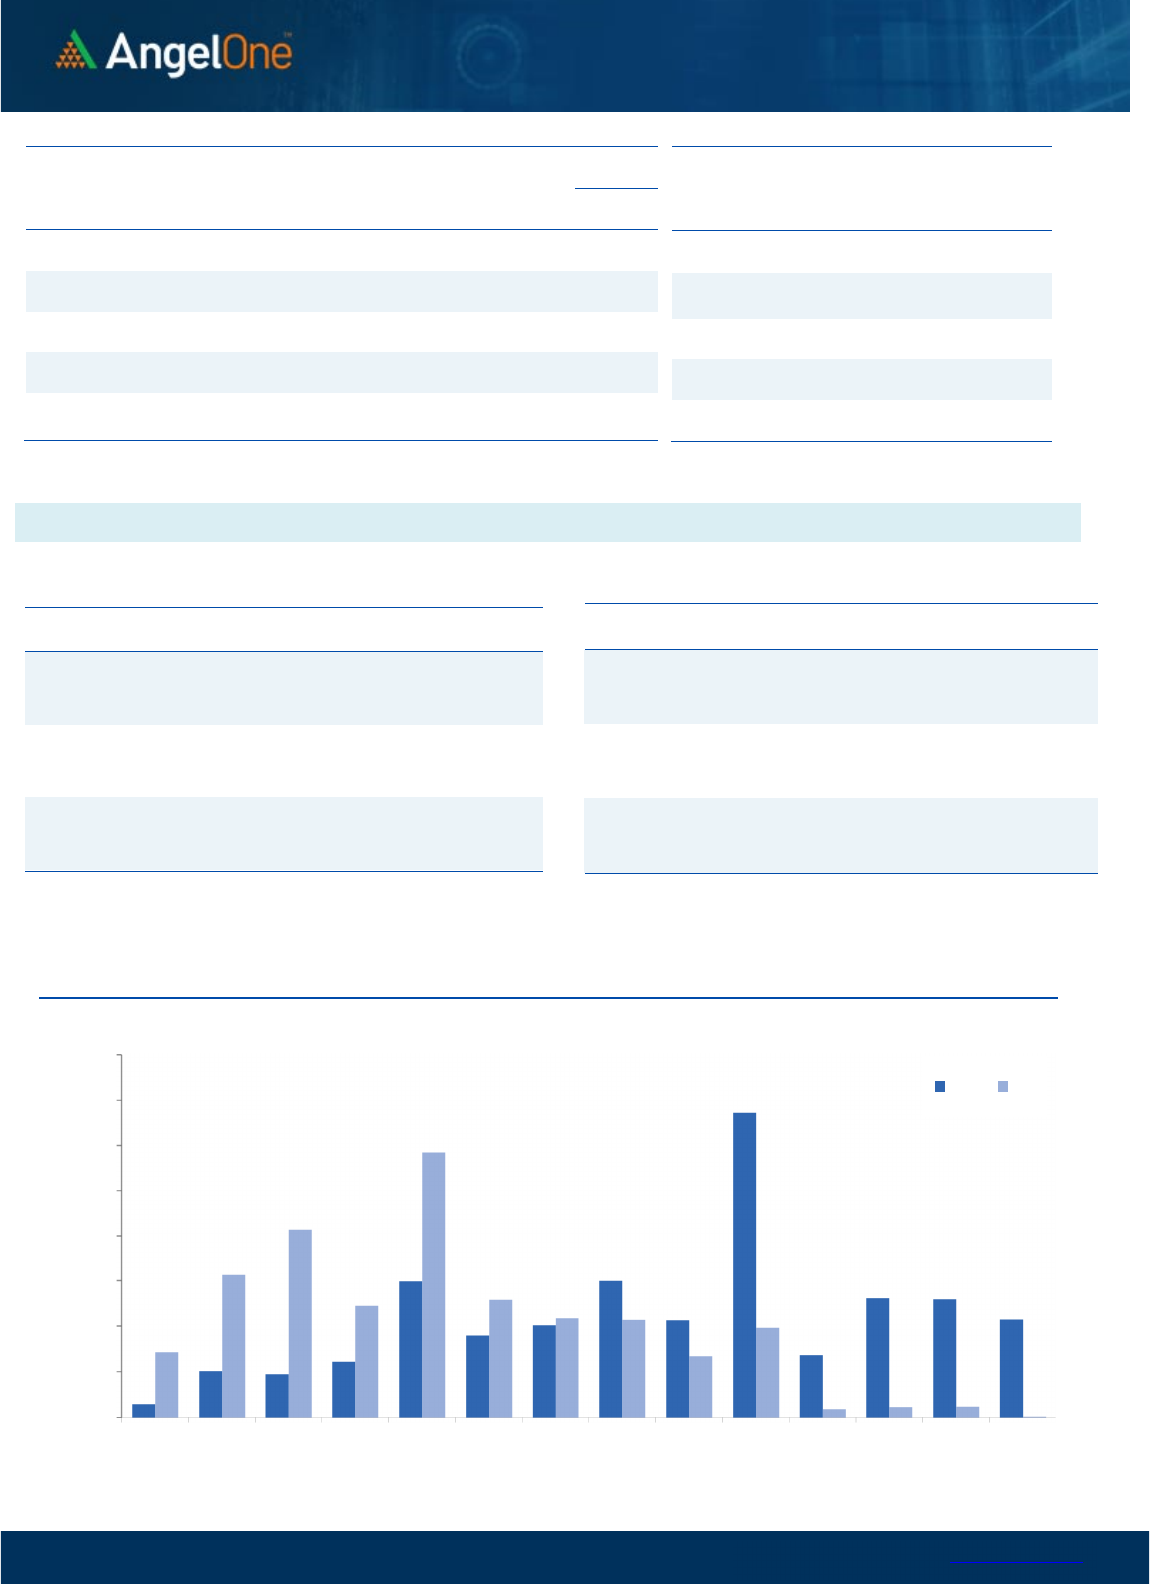
Nifty Bank Outlook (43104)
On Friday, there was a gap-down opening however there was no
major traction throughout the day and the bank index eventually
ended the week with gains of 0.28% against the previous week's
close.
Bank Nifty continued with its winning streak for the ninth
consecutive week however the bull's momentum seems to have
slowed down as mild profit booking was seen at higher levels. The
momentum indicator reading is highly overbought and hence any
timewise or price-wise correction cannot be ruled out; however,
the undertone remains bullish and such corrections should be
considered healthy in nature for the bulls. In such a scenario, one
should look to buy on dips whereas profit booking should be
considered at higher levels. Ideally, one should focus on action
outside the Index as individual stocks can continue to outperform.
As far as levels are concerned, 42740 followed by 42450 is seen as
strong support for this week whereas 43550 - 43870 is seen as
immediate resistance.
Key Levels
Support 1 – 42740 Resistance 1 – 43550
Support 2 – 42450 Resistance 2 – 43870
Exhibit 1: Nifty
Daily
Chart
Exhibit 2: Nifty Bank
Daily
Chart
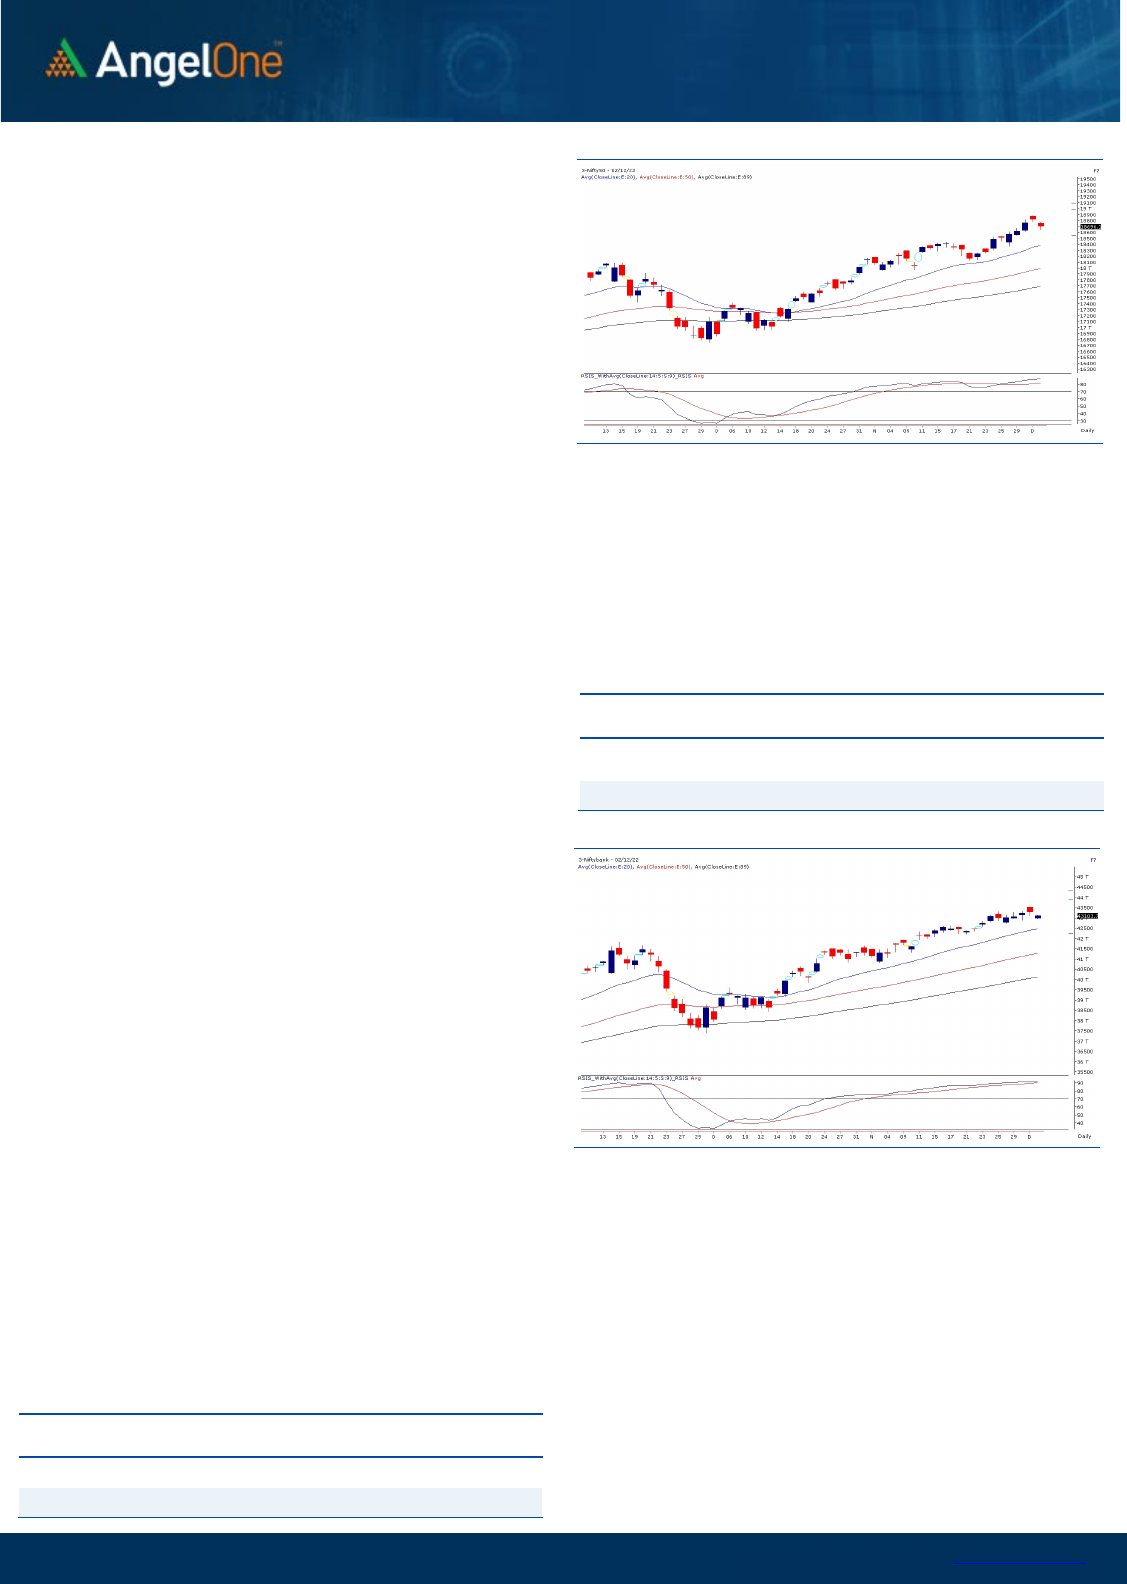
Sensex (62868) / Nifty (18696)
The Indian market had a splendid week, as the bullish momentum
carried throughout the week, with Nifty being on a roll of achieving
new heights daily. However, the stellar run of the eight consecutive
days came to a halt ahead of the weekend as Nifty snapped its
winning streak and took a breather. All in all, it has been an
unprecedented move wherein the broader market also participated
in levitating the sentiments. With the weekly closure, Nifty surged
nearly a percent and settled a tad below the 18700 level.
Technically speaking, the chart structure construes a positive
development, with the indices being in a cycle of higher highs –
higher lows. Even the global relief of the Fed to temper its
aggressive interest rate hike has provided a significant thrust to the
equities across the globe, mirroring which our market continued to
soar northwards. Alongside the broader participation from the
small and midcap counters can be seen as a sign of progression in
such market conditions. As far as levels are concerned, 18500 is
expected to act as the sacrosanct support for the index. While on
the higher end, the swing high of 18900 odd zone is expected to
provide some intermediate resistance, followed by the
psychological mark of 19000 in the near term.
We remain sanguine with the up trend and would advocate the
traders to utilize the dips to add long position in the index. Also,
we expect strong moves outside the indices as the midcap space
has witnessed a multi-month breakout and could unfold a new
leg of rally in the comparable period. Simultaneously, one should
stay abreast with global and domestic developments on a regular
basis and continue with a similar buy on decline strategy till the
time important supports are held comfortably.
Key Levels
Support 1 – 18600 Resistance 1 – 18900
Support 2 – 18500 Resistance 2 – 19000

www.angelone.in
Technical & Derivatives Report
DEC 05, 2022
View
Our market snapped its winning streak of eight
consecutive sessions, wherein the benchmark index
Nifty50 corrected 0.62 percent to settle a tad below the
18700 level.
FIIs were net buyers in the cash market segment to
the tune of Rs. 215 crores. Simultaneously, in Index
futures, they sold worth Rs. 3918 crores with a
decrease in open interest, indicating long unwinding.
Looking at the overall F&O data, we have witnessed a
long unwinding in both indices. On the options front,
the piling up of OI is visible in the 18700-18500 put
strikes, indicating nearby support. On the higher end,
the piling up of positions could be seen at the 18800-
19000 call strikes, suggesting the intermediate
resistance for the index. Meanwhile, the ‘Long Short
Ratio’ has cooled off a bit to 66% from 71% WoW.
Considering the recent price action, the undertone is
likely to remain upbeat, and any intra-week dip
towards the mentioned support zone could augur well
for the bulls to add long bets in the index.
Comments
The Nifty futures open interest has decreased by
6.64% and Bank Nifty futures open interest has
decreased by 1.85% as the market closed at 18696.10.
The Nifty December future closed with a premium of
116.45 point against a premium of 135.80 point in the
last trading session. The January series closed at a
premium of 223.75 point.
The INDIA VIX increased from 13.36 to 13.45. At the
same time, the PCR-OI of Nifty has decreased to 0.94
from 1.15.
Few of the liquid counters where we have seen high
cost of carry are BHEL, ASTRAL, OFSS, EICHERMOT
and ABCAPITAL.
Historical Volatility
SCRIP HV
IDEA 73.22
IBULHSGFIN 70.01
RBLBANK 68.61
GNFC 59.58
HINDCOPPER 58.95
Nifty Vs OI
17800
18000
18200
18400
18600
18800
19000
8,000
9,000
10,000
11,000
12,000
13,000
14,000
15,000
16,000
11/15 11/17 11/22 11/24 11/28 11/30 12/2
Openinterest Nifty
OI Gainers
SCRIP OI
OI
CHG. (%)
PRICE
PRICE
CHG. (%)
UBL 1203200 25.07 1735.80 2.12
EICHERMOT 3648225 16.63 3331.85 -3.34
OFSS 636200 12.88 3218.85 3.02
VEDL 37625600 10.06 313.85 1.10
L&TFH 62923124 10.02 91.35 3.31
JKCEMENT 524250 7.54 3236.30 1.10
SUNTV 10183500 6.66 491.65 -0.59
BAJFINANCE 5760625 6.28 6675.75 -1.06
OI Losers
SCRIP OI
OI
CHG. (%)
PRICE
PRICE
CHG. (%)
BHEL 101104500 -11.17 90.55 7.46
HCLTECH 10840200 -7.41 1135.55 -0.41
ATUL 113700 -6.82 8887.50 1.90
POLYCAB 1069800 -6.77 2674.30 3.03
SUNPHARMA 15959300 -6.70 1040.00 -0.65
LTTS 975600 -6.43 4287.20 2.99
BANKBARODA 84503250 -6.39 171.20 -0.17
METROPOLIS 847900 -5.59 1478.40 0.12
Put-Call Ratio
SCRIP PCR (OI) PCR (VOL)
NIFTY 0.94 0.89
BANKNIFTY 0.79 0.94
RELIANCE 0.64 0.52
ICICIBANK 0.56 0.61
INFY 0.56 0.56
www.angelone.in
Technical & Derivatives Report
DEC 05, 2022
Note: Above mentioned Bullish or Bearish Spreads in Nifty (Dec Series) are given as an information and not as a recommendation.
Nifty Spot =
1
8
696
.
1
0
FII Statistics for
December
0
2
, 2022
Detail Buy
Contracts
Open
Interest
Value
(in Cr.)
Sell
Net
CHANGE
INDEX
FUTURES
2235.23 6153.06 (3917.83) 177438 17451.23 (8.10)
INDEX
OPTIONS
645228.37 646337.69 (1109.32) 1735949 169081.09 25.56
STOCK
FUTURES
7984.99 10028.87 (2043.88) 1946571 137286.82 (0.82)
STOCK
OPTIONS
7584.88 7629.08 (44.20) 120311 8730.82 8.26
Total 663033.47
670148.70
(7115.23) 3980269
332549.96
9.07
Turnover on
December
0
2
, 2022
Instrument
No. of
Contracts
Turnover
( in Cr. )
Change
(%)
Index
Futures
270218 2679192.83
-3.52
Index
Options
79930286 3104453.21
-29.47
Stock
Futures
723787 5120673.92
-7.16
Stock
Options
2826178 396426.35 -4.91
Total
28,26,178 396426.35 -13.81
Bull-Call Spreads
Action Strike Price Risk Reward BEP
Buy
18600 362.05
67.05
32.95
18667.05
Sell
18700 295.00
Buy
18600 362.05
127.25
72.75
18727.25
Sell
18800 234.80
Buy
18700 295.00
60.20 39.80 18760.20
Sell 18800 234.80
Bear
-
Put Spreads
Action Strike Price Risk Reward BEP
Buy 18600 147.15
27.55
72.45
18572.45
Sell
18500 119.60
Buy 18600 147.15
49.75
150.25
18550.25
Sell 18400 97.40
Buy
18500 119.60
22.20 77.80 18477.80
Sell 18400 97.40
Nifty Put
-
Call Analysis
,0
500,000
1000,000
1500,000
2000,000
2500,000
3000,000
3500,000
4000,000
18100 18200 18300 18400 18500 18600 18700 18800 18900 19000 19100 19200 19300 19400
Call Put

www.angelone.in
Technical & Derivatives Report
DEC 05, 2022
`
Daily Pivot Levels for Nifty Constituents
Scrips
S2
S1
PIVOT
R1 R2
ADANIENT 3,845 3,884
3,924
3,963
4,003
ADANIPORTS
873
880
892
900
911
APOLLOHOSP 4,693 4,782
4,832 4,922
4,972
ASIANPAINT 3,110 3,127
3,151
3,167
3,191
AXISBANK
886
895
901
911
917
BAJAJ-AUTO
3,599
3,629
3,671
3,701 3,742
BAJFINANCE
6,593
6,635
6,688
6,729
6,783
BAJAJFINSV 1,613 1,628
1,640
1,655
1,668
BPCL
336
338
341 344
346
BHARTIARTL
834
841
847
854
859
BRITANNIA 4,355 4,394
4,419
4,458
4,483
CIPLA
1,087
1,101
1,113
1,127
1,139
COALINDIA
224
225
227
228
229
DIVISLAB 3,306 3,344
3,369
3,407 3,432
DRREDDY 4,434 4,472
4,498
4,536 4,562
EICHERMOT 3,254 3,293
3,364 3,403
3,474
GRASIM 1,771 1,796
1,810
1,834
1,849
HCLTECH
1,117
1,126
1,133 1,143
1,150
HDFCBANK
1,597
1,602
1,610 1,615
1,624
HDFCLIFE
583
586
591
594
599
HDFC 2,649 2,657
2,671
2,679
2,693
HEROMOTOCO
2,781
2,801
2,833 2,853
2,885
HINDALCO 451 456
463
468
476
HINDUNILVR 2,575 2,595
2,627
2,648 2,680
ICICIBANK 922 926
930
935
939
INDUSINDBK 1,158 1,169
1,177 1,187
1,196
INFY 1,617 1,627
1,645
1,655
1,672
ITC
334
336
338
340
342
JSW STEEL
734
739
745
749
756
KOTAKBANK 1,910 1,920
1,928
1,938
1,945
LT 2,055 2,070
2,085 2,100
2,114
M&M
1,239
1,252
1,273
1,286
1,307
MARUTI 8,659 8,737
8,833 8,912 9,007
NESTLEIND
19,398
19,574
19,856
20,033
20,315
NTPC
170
171
172
173
174
ONGC 138 139
142 144 146
POWERGRID
217
218
220
221
223
RELIANCE
2,676
2,699
2,724
2,747
2,771
SBILIFE
1,252
1,273
1,287
1,308
1,322
SBIN
602
605
607
610
612
SUNPHARMA
1,027
1,033
1,042
1,048
1,057
TCS 3,384 3,412
3,440
3,468 3,496
TATACONSUM
780
788
800
808
820
TATAMOTORS 431 433
437
439
443
TATASTEEL
109
111
112
113
114
TECHM
1,094
1,104
1,110
1,121
1,127
TITAN 2,578 2,598
2,625
2,645
2,671
ULTRACEMCO
7,092
7,164
7,232
7,304
7,372
UPL 762 773
779
790
796
WIPRO
407
410
412 415 417

www.angelone.in
Technical & Derivatives Report
DEC 05, 2022
*
Technical and Derivatives Team:
Sameet Chavan Chief Analyst – Technical & Derivatives sameet.chavan@angelone.in
Sneha Seth Senior Analyst – Technical & Derivatives sneha.seth@angelone.in
Rajesh Bhosale Technical Analyst rajesh.bhosle@angelone.in
Osho Krishan Senior Analyst – Technical & Derivatives osho.krishan@angelone.in
Research Team Tel: 022 – 39357600 Website: www.angelone.in
For Technical Queries E-mail: technicalresearch-cso@angelone.in
For Derivatives Queries E-mail: derivatives.desk@angelone.in
DISCLAIMER
Angel One Limited (hereinafter referred to as “Angel”) is a registered Member of National Stock Exchange of India Limited, Bombay
Stock Exchange Limited and Metropolitan Stock Exchange Limited. It is also registered as a Depository Participant with CDSL and
Portfolio Manager and investment advisor with SEBI. It also has registration with AMFI as a Mutual Fund Distributor. Angel One
Limited is a registered entity with SEBI for Research Analyst in terms of SEBI (Research Analyst) Regulations, 2014 vide registration
number INH000000164. Angel or its associates has not been debarred/ suspended by SEBI or any other regulatory authority for
accessing /dealing in securities Market.
This document is solely for the personal information of the recipient, and must not be singularly used as the basis of any investment
decision. Nothing in this document should be construed as investment or financial advice. Each recipient of this document should
make such investigations as they deem necessary to arrive at an independent evaluation of an investment in the securities of the
companies referred to in this document (including the merits and risks involved), and should consult their own advisors to determine
the merits and risks of such an investment.
Angel or its associates or research analyst or his relative may have actual/beneficial ownership of 1% or more in the securities of
the subject company at the end of the month immediately preceding the date of publication of the research report. Neither Angel or
its associates nor Research Analysts or his relative has any material conflict of interest at the time of publication of research report.
Angel or its associates might have received any compensation from the companies mentioned in the report during the period
preceding twelve months from the date of this report for services in respect of managing or co-managing public offerings, corporate
finance, investment banking or merchant banking, brokerage services or other advisory service in a merger or specific transaction
in the normal course of business. Angel or its associates did not receive any compensation or other benefits from the companies
mentioned in the report or third party in connection with the research report. Neither Angel nor its research analyst entity has been
engaged in market making activity for the subject company.
Reports based on technical and derivative analysis center on studying charts of a stock's price movement, outstanding positions and
trading volume, as opposed to focusing on a company's fundamentals and, as such, may not match with a report on a company's
fundamentals. Investors are advised to refer the Fundamental and Technical Research Reports available on our website to evaluate
the contrary view, if any.
The information in this document has been printed on the basis of publicly available information, internal data and other reliable
sources believed to be true, but we do not represent that it is accurate or complete and it should not be relied on as such, as this
document is for general guidance only. Angel One Limited or any of its affiliates/ group companies shall not be in any way responsible
for any loss or damage that may arise to any person from any inadvertent error in the information contained in this report. Angel One
Limited has not independently verified all the information contained within this document. Accordingly, we cannot testify, nor make
any representation or warranty, express or implied, to the accuracy, contents or data contained within this document. While Angel
One Limited endeavors to update on a reasonable basis the information discussed in this material, there may be regulatory,
compliance, or other reasons that prevent us from doing so.
This document is being supplied to you solely for your information, and its contents, information or data may not be reproduced,
redistributed or passed on, directly or indirectly.
Neither Angel One Limited, nor its directors, employees or affiliates shall be liable for any loss or damage that may arise from or in
connection with the use of this information. Angel or its associates or Research Analyst or his relative might have financial interest
in the subject company. Research analyst has not served as an officer, director or employee of the subject company.
