October
0
4
, 2023
www.angelone.in
Technical & Derivatives Report
8
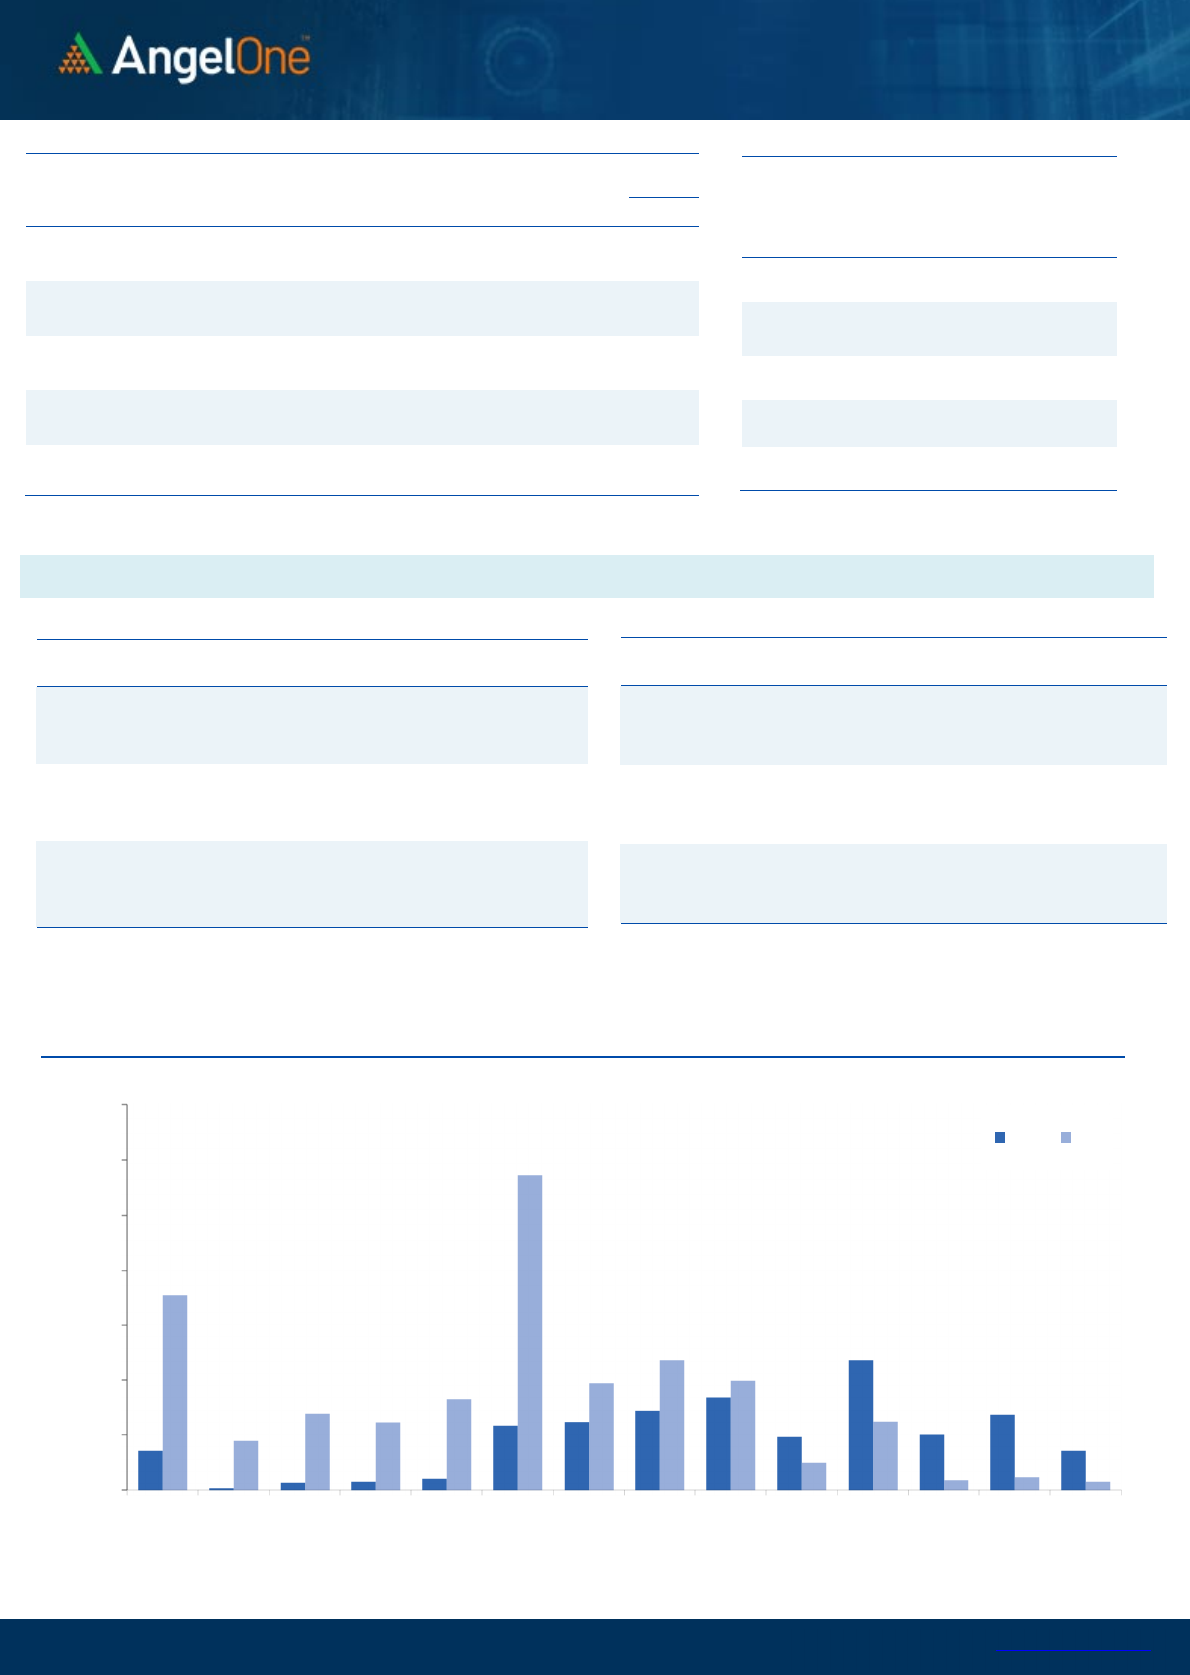
Nifty Bank Outlook (
4
4
399
)
Following an extended weekend, the Bank Nifty commenced the new
week on a relatively subdued note. However, shortly after the opening
bell, there was a sharp decline in the initial minutes of trading.
Subsequently, the market exhibited minimal momentum, and prices
largely remained within a narrow range for the entire session.
Eventually, the Bank Nifty concluded the day with a loss of 0.42%, just
below the 44400 mark.
Technically, the daily chart reveals that prices have been consolidating
within a tight range since last week. On the downside, the range of
44200 to 44000 has been acting as a solid support level, while on the
upside, the range of 44800 to 45000 poses a formidable resistance. It
appears that market participants are awaiting a catalyst, and given the
upcoming RBI policy announcement this week, we anticipate the
emergence of a clear and robust trend very soon. Until a breakout
occurs beyond the aforementioned range of 44000 to 45000, we can
expect the consolidation phase to persist. Meanwhile, the PSU bank
index continued its upward trajectory, displaying strength after a brief
consolidation period lasting a couple of weeks. It managed to
outperform, registering gains exceeding 2%. Consequently, we
recommend traders to focus predominantly on stock-specific that
demonstrate outperforming opportunities.
Key Levels
Support 1 – 44200 Resistance 1 – 44800
Support 2 – 44000 Resistance 2 – 45000
Exhibit 1: Nifty Daily Chart
Exhibit 2: Nifty Bank Daily Chart
Sensex (
6
5
512
) / Nifty (
19
529
)
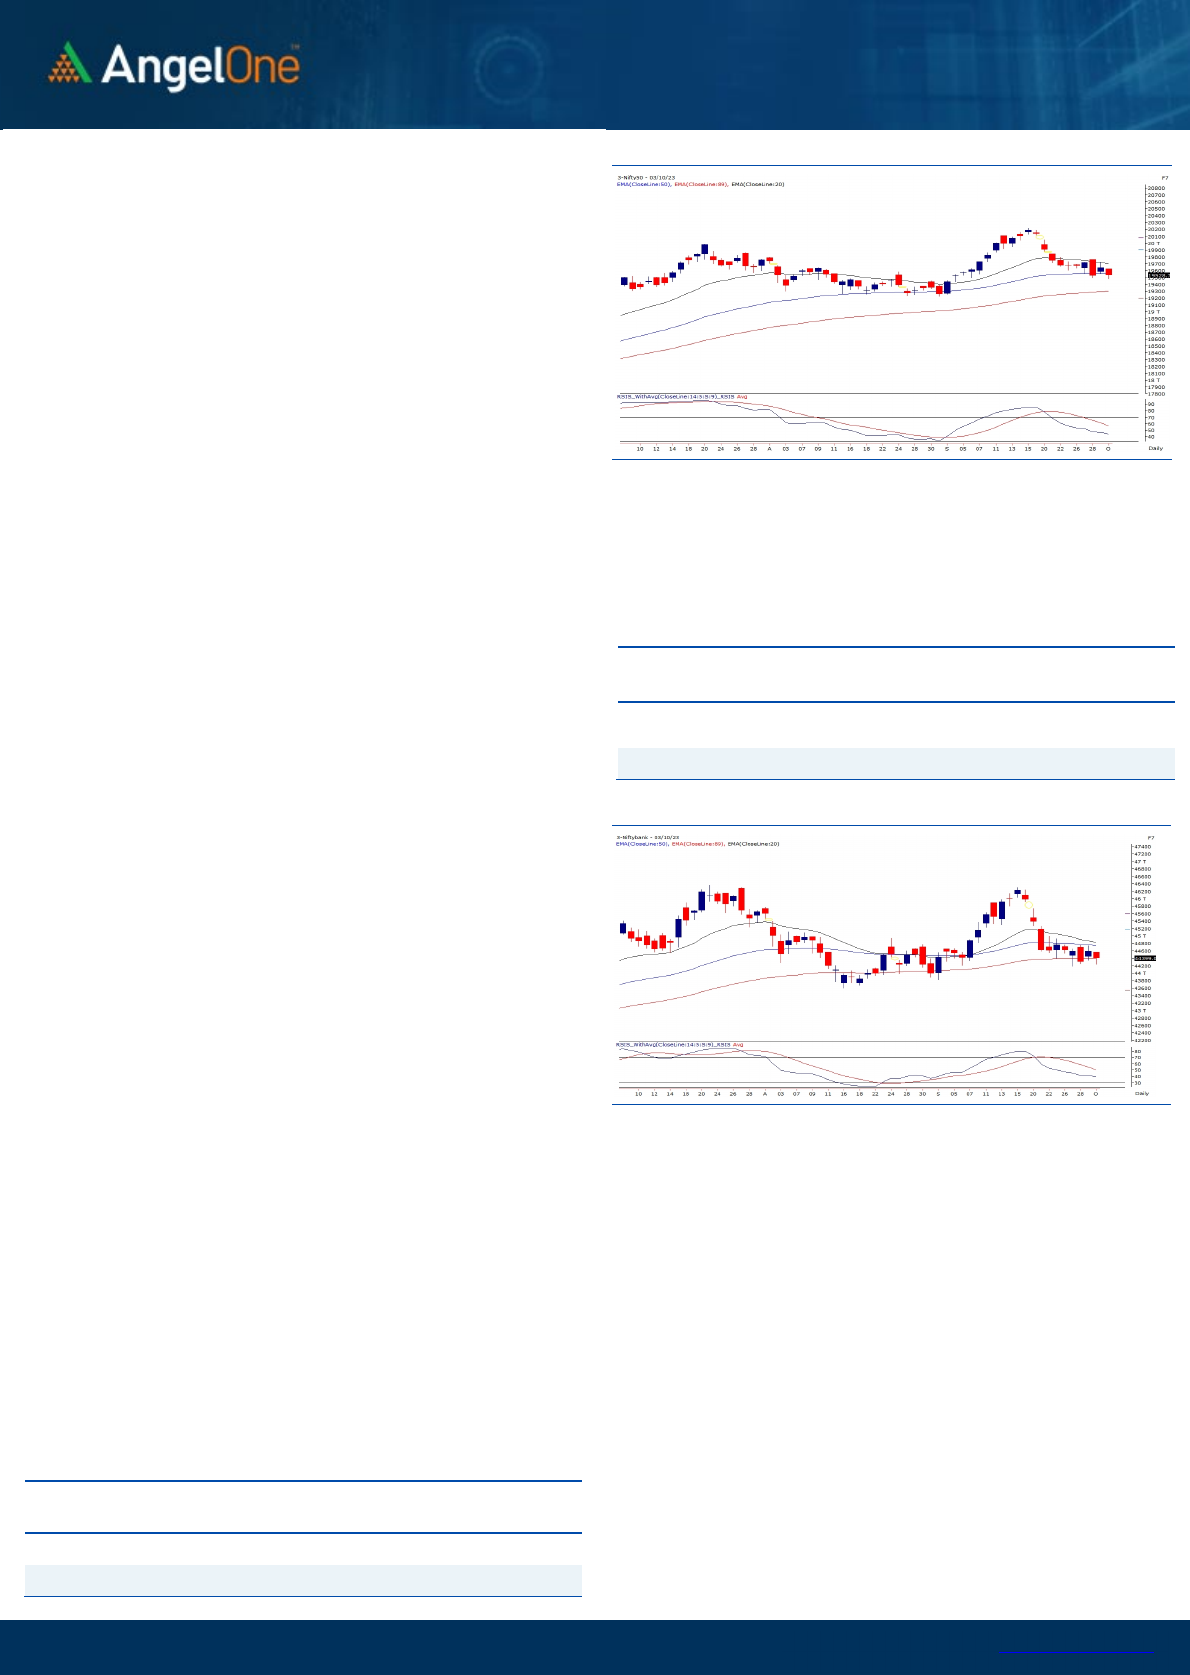
The global tremors over the extended weekend led to a sluggish start
for our markets. The benchmark index initially slipped below the pivotal
support of 19500 and went below the lows of the September month
expiry session but gradually recouped some of the lost grounds and
managed to withhold the pivotal zone. There has been no significant
traction in the Nifty50 index throughout the day and amidst a lackluster
session, it sheds over half a percent to settle a tad above 19500 at the
start of the truncated week.
In the absence of significant buying traction, our market remains
indecisive, narrowing down the price movements. From a technical
point of view, the hourly chart suggests an oversold parameter and
bulls eagerly await some trigger from the global bourses to have a
comeback. At present, Nifty hovers near the 50 DEMA and the crucial
support of the 19500-19400 zone, breaching which the sentiments
might turn unpleasant in the short run. Conversely, the zone of 19600-
19700 is likely to be seen as a daunting task for the bulls and a
sustainable breakthrough could only bring back some cheer in the
overall space.
For now, we remain hopeful that any relief from our global peers
could provide some sentimental upliftment in the markets. The high
beta Banking space also struggles to keep the momentum, adding to
a cautious view. In the meantime, it is highly advisable to keep a
pragmatic approach and avoid aggressive bets till the trend gets
clarity.
Key Levels
Support 1 – 19500 Resistance 1 – 19600
Support 2 – 19400 Resistance 2 – 19700

www.angelone.in
Technical & Derivatives Report
October
0
4
,
2023
View
The Indian equity market witnessed a tentative start
but as soon as the day progressed the index entered
a consolidation mood to end the day tad below
19550 with a cut of half a percent.
FIIs were net sellers in the cash market segment to
the tune of Rs. 2034 cr. Simultaneously, they sold
worth Rs. 1839 cr in Index futures with the rise in
open interest, indicating the addition of fresh shorts.
We observed the addition of mixed bets in Nifty and
open interest reduction was seen in the banking
index. On the options front, noteworthy piling is seen
at 19500-19700 call strikes, with the surge in IVs
suggesting the addition of fresh longs. On the lower
end, no relevant build-up was observed in put
strikes. The highest open interest concentration
remains intact in 19500 put, indicating an
intermediate support zone. Meanwhile, the selling
streak from stronger hands continues in the cash and
index future segment. For now, we would prefer
opting for the wait and watch approach and letting
things settle before initiating any directional bets in
the system.
Comments
The Nifty futures open interest has increased by 7.71%
and Bank Nifty futures open interest has decreased by
1.96% as the market closed at 19528.75.
The Nifty October future closed with a premium of
42.75 points against 70.70 points in the last trading
session. The November series closed at a premium of
166.30 points.
The INDIA VIX has increased from 11.45 to 11.79. At the
same time, the PCR-OI of Nifty has decreased from 1.03
to 0.91.
A few of the liquid counters where we have seen high
cost of carry are NAVINFLUOR, GLENMARK, SUNTV,
VEDL and ABBOTINDIA.
Historical Volatility
SCRIP HV
BERGEPAINT 30.43
CANBK 42.17
ZYDUSLIFE 28.66
GRANULES 38.81
DRREDDY 25.18
Nifty Vs OI
19000
19200
19400
19600
19800
20000
20200
20400
20600
9,000
9,500
10,000
10,500
11,000
11,500
12,000
12,500
13,000
13,500
14,000
9-13 9-15 9-19 9-25 9-27 9-29
Openinterest Nifty
OI Gainers
SCRIP OI
OI
CHG. (%)
PRICE
PRICE
CHG. (%)
NAVINFLUOR 1247700 136.51 3766.70 -12.99
DELTACORP 13062000 21.83 142.70 0.88
LTIM 1738350 15.98 5209.85 -1.68
INDIACEM 17518900 15.75 233.20 2.58
LALPATHLAB 886800 14.13 2524.25 4.46
SUNTV 9040500 14.10 612.15 5.18
LUPIN 5738350 12.61 1171.25 3.49
GRANULES 11210000 12.17 354.75 3.81
OI Losers
SCRIP OI
OI
CHG. (%)
PRICE
PRICE
CHG. (%)
GLENMARK 17600 -8.20 855.50 9.67
CROMPTON 11502000 -6.43 309.85 1.20
LAURUSLABS 11561700 -5.99 395.40 2.39
VEDL 65642000 -5.79 222.55 6.55
HAL 9706200 -5.16 1928.15 2.10
HINDPETRO 50022900 -4.47 254.95 1.89
ICICIGI 2887000 -4.20 1309.55 2.25
PEL 9950250 -3.93 1049.35 3.18
Put-Call Ratio
SCRIP PCR (OI) PCR (VOL)
NIFTY 1.03 0.93
BANKNIFTY 0.90 0.88
RELIANCE 0.69 0.45
ICICIBANK 0.57 0.57
INFY 0.58 0.49
www.angelone.in
Technical & Derivatives Report
October
0
4
,
2023
Note: Above mentioned Bullish or Bearish Spreads in Nifty (Oct Series) are given as an information and not as a recommendation.
Nifty Spot =
19
528.75
FII Statistics for
October
03
, 2023
Detail Buy
Contracts
OI Value
(in Cr.)
Sell Net
CHANGE
INDEX
FUTURES
2324.20
4163.53
(1839.33) 165567
13673.65
12.15
INDEX
OPTIONS
1296512.43
1288630.37
7882.06
3935754
315338.68
31.11
STOCK
FUTURES
13391.08
15283.50
(1892.42) 2360320
186382.42
(0.69)
STOCK
OPTIONS
16991.46
17163.46
(172.00) 128720
10522.92
21.96
Total
1329219.17
1325240.86
3978.31
6590361
525917.67
17.02
Turnover on
October
03
, 2023
Instrument
No. of
Contracts
Turnover
(in Cr.)
Change
(%)
Index Futures
339818 27722.93
-48.80
Index Options
253712256
43478.61
-35.11
Stock Futures
890518 73586.60
-67.27
Stock Options
3130256 5152.79 18.16
Total
31,30,256 5152.79 -57.20
Bull-Call Spreads
Action Strike Price Risk Reward BEP
Buy
19500 261.20
58.50
41.50
19558.50
Sell
19600 202.70
Buy
19500 261.20
106.50
93.50
19606.50
Sell
19700 154.70
Buy
19600 202.70
48.00 52.00 19648.00
Sell
19700 154.70
Bear-Put Spreads
Action Strike Price Risk Reward BEP
Buy
19700 151.05
32.80
67.20
19667.20
Sell 19600 118.25
Buy 19700 151.05
58.25
141.75
19641.75
Sell
19500 92.80
Buy
19600 118.25
25.45 74.55 19574.55
Sell 19500 92.80
Nifty Put
-
Call Analysis
,0
1000,000
2000,000
3000,000
4000,000
5000,000
6000,000
7000,000
19000 19100 19200 19300 19400 19500 19600 19700 19800 19900 20000 20100 20200 20300
Call Put

www.angelone.in
Technical & Derivatives Report
October
0
4
,
2023
`
Daily Pivot Levels for Nifty Constituents
Scrips S2 S1 PIVOT R1 R2
ADANIENT 2,342 2,365 2,395 2,417 2,448
ADANIPORTS 818 825 831 837 843
APOLLOHOSP 5,024 5,072 5,113 5,161 5,202
ASIANPAINT 3,120 3,143 3,186 3,209 3,251
AXISBANK 1,027 1,034 1,039 1,046 1,052
BAJAJ-AUTO 4,953 4,985 5,029 5,061 5,105
BAJFINANCE 7,679 7,823 7,899 8,044 8,120
BAJAJFINSV 1,514 1,537 1,551 1,575 1,588
BPCL 335 338 344 347 352
BHARTIARTL 911 918 923 930 935
BRITANNIA 4,445 4,470 4,512 4,537 4,578
CIPLA 1,165 1,174 1,180 1,189 1,195
COALINDIA 286 289 293 296 300
DIVISLAB 3,672 3,698 3,731 3,757 3,790
DRREDDY 5,363 5,412 5,500 5,549 5,636
EICHERMOT 3,231 3,291 3,363 3,423 3,495
GRASIM 1,890 1,906 1,922 1,938 1,955
HCLTECH 1,205 1,222 1,239 1,256 1,273
HDFCBANK 1,493 1,500 1,514 1,521 1,535
HDFCLIFE 624 629 633 638 642
HEROMOTOCO 2,951 2,983 3,024 3,057 3,097
HINDALCO 472 476 480 484 488
HINDUNILVR 2,439 2,454 2,477 2,491 2,514
ICICIBANK 931 936 944 948 956
INDUSINDBK 1,413 1,424 1,431 1,443 1,450
INFY 1,414 1,424 1,430 1,441 1,447
ITC 437 438 441 442 444
JSW STEEL 763 767 772 775 780
KOTAKBANK 1,706 1,717 1,726 1,736 1,745
LT 2,966 3,020 3,049 3,102 3,131
LTIMINDTREE 5,088 5,150 5,200 5,263 5,312
M&M 1,491 1,514 1,556 1,579 1,621
MARUTI 10,047 10,197 10,453 10,603 10,860
NESTLEIND 22,049 22,182 22,388 22,522 22,728
NTPC 237 239 243 245 249
ONGC 180 182 186 188 192
POWERGRID 196 198 199 201 202
RELIANCE 2,304 2,311 2,323 2,331 2,343
SBILIFE 1,273 1,283 1,292 1,302 1,312
SBIN 584 593 599 609 614
SUNPHARMA 1,125 1,133 1,148 1,156 1,170
TCS 3,455 3,485 3,509 3,539 3,563
TATACONSUM
856 864 872 880 887
TATAMOTORS 610 615 624 629 638
TATASTEEL 126 127 128 129 130
TECHM 1,202 1,209 1,220 1,227 1,238
TITAN 3,076 3,136 3,174 3,234 3,272
ULTRACEMCO 8,145 8,225 8,301 8,381 8,457
UPL 600 603 610 613 620
WIPRO 401 403 406 408 410

www.angelone.in
Technical & Derivatives Report
October
0
4
,
2023
Technical and Derivatives Team:
Sameet Chavan Head Research – Technical & Derivatives sameet.chavan@angelone.in
Sneha Seth Senior Analyst – Technical & Derivatives sneha.seth@angelone.in
Rajesh Bhosale Analyst - Technical rajesh.bhosle@angelone.in
Osho Krishan Senior Analyst – Technical & Derivatives osho.krishan@angelone.in
Hitesh Rathi Analyst – Technical & Derivatives hitesh.rathi@angelone.in
Research Team Tel: 022 – 39357600 Website: www.angelone.in
For Technical Queries E-mail: technicalresearch-cso@angelone.in
For Derivatives Queries E-mail: derivatives.desk@angelone.in
DISCLAIMER
We, Angel One Limited (hereinafter referred to as “Angel”) a company duly incorporated under the provisions of the Companies Act, 1956 with
its registered office at 601, 6th Floor, Ackruti Star, Central Road, MIDC, Andheri East, Mumbai – 400093, CIN: (L67120MH1996PLC101709) and
duly registered as a member of National Stock Exchange of India Limited, Bombay Stock Exchange Limited, Metropolitan Stock Exchange Limited,
Multi Commodity Exchange of India Ltd and National Commodity & Derivatives Exchange Ltd. Angel One limited is a company engaged in
diversified financial services business including securities broking, DP services, distribution of Mutual Fund products. It is also registered as a
Depository Participant with CDSL and Portfolio Manager and Investment Adviser with SEBI. It also has registration with AMFI as a Mutual Fund
Distributor. Angel One Limited is a registered entity with SEBI for Research Analyst in terms of SEBI (Research Analyst) Regulations, 2014 vide
registration number INH000000164 and also registered with PFRDA as PoP ,Registration No.19092018. Angel Group does not have any joint
ventures or associates. Angel One Limited is the ultimate parent company of the Group. Angel or its associates has not been debarred/ suspended
by SEBI or any other regulatory authority for accessing /dealing in securities Market.
AOL was merged with Angel Global Capital Private Limited and subsequently name of Angel Global Capital Private Limited was changed to Angel
Broking Private Limited (AOL) pursuant to scheme of Amalgamation sanctioned by the Hon'ble High Court of Judicature at Bombay by Orders
passed in Company Petition No 710 of 2011 and the approval granted by the Registrar of Companies. Further, name of Angel Broking Private
Limited again got changed to Angel Broking Limited (AOL) pursuant to fresh certificate of incorporation issued by Registrar of Companies (ROC)
dated June 28, 2018. Further name of Angel Broking name changed to Angel One Ltd pursuant to fresh certificate of incorporation issued by
Registrar of Companies (ROC) dated 23-09-21.
In case of any grievances please write to: support@angelone.in, Compliance Officer Details: Name : Hiren Thakkar, Tel No. –08657864228, Email
id - compliance@angelone.in
Registration granted by SEBI and certification from NISM in no way guarantee performance of the intermediary or provide any assurance of returns
to investors.
This document is solely for the personal information of the recipient, and must not be singularly used as the basis of any investment decision.
Nothing in this document should be construed as investment or financial advice. Each recipient of this document should make such investigations
as they deem necessary to arrive at an independent evaluation of an investment in the securities of the companies referred to in this document
(including the merits and risks involved), and should consult their own advisors to determine the merits and risks of such an investment.
Angel or its associates or research analyst or his relative may have actual/beneficial ownership of 1% or more in the securities of the subject
company at the end of the month immediately preceding the date of publication of the research report. Neither Angel or its associates nor
Research Analysts or his relative has any material conflict of interest at the time of publication of research report.
Angel or its associates might have received any compensation from the companies mentioned in the report during the period preceding twelve
months from the date of this report for services in respect of managing or co-managing public offerings, corporate finance, investment banking or
merchant banking, brokerage services or other advisory service in a merger or specific transaction in the normal course of business. Angel or its
associates did not receive any compensation or other benefits from the companies mentioned in the report or third party in connection with the
research report. Neither research entity nor research analyst has been engaged in market making activity for the subject company.

www.angelone.in
Technical & Derivatives Report
October
0
4
,
2023
*
Reports based on technical and derivative analysis center on studying charts of a stock's price movement, outstanding positions and trading
volume, as opposed to focusing on a company's fundamentals and, as such, may not match with a report on a company's fundamentals. Investors
are advised to refer the Fundamental and Technical Research Reports available on our website to evaluate the contrary view, if any.
The information in this document has been printed on the basis of publicly available information, internal data and other reliable sources believed
to be true, but we do not represent that it is accurate or complete and it should not be relied on as such, as this document is for general guidance
only. Angel One Limited or any of its affiliates/ group companies shall not be in any way responsible for any loss or damage that may arise to any
person from any inadvertent error in the information contained in this report. Angel One Limited does not warrant the accuracy, adequacy or
completeness of the service, information and materials and expressly disclaims liability for errors or omissions in the service, information and
materials. While Angel One Limited endeavours to update on a reasonable basis the information discussed in this material, there may be
regulatory, compliance, or other reasons that prevent us from doing so.
This document is being supplied to you solely for your information, and its contents, information or data may not be reproduced, redistributed or
passed on, directly or indirectly.
Neither Angel One Limited, nor its directors, employees or affiliates shall be liable for any loss or damage that may arise from or in connection
with the use of this information. Angel or its associates or Research Analyst or his relative might have financial interest in the subject company.
Research analyst has not served as an officer, director or employee of the subject company.
Investment in securities market are subject to market risks. Read all the related documents carefully before investing.
Any communication sent to clients on phone numbers or e-mail ids registered with the Trading Member is meant for client consumption and such
material should not be redistributed. Brokerage will not exceed SEBI prescribed limit. Any Information provided by us through any medium based
on our research or that of our affiliates or third parties or other external sources is subject to domestic and international market conditions and
we do not guarantee the availability or otherwise of any securities or other instruments and such Information is merely an estimation of certain
investments, and we have not and shall not be deemed to have assumed any responsibility for any such Information. You should seek independent
professional advice and/or tax advice regarding the suitability of any investment decision whether based on any Information provided by us
through the Site from inhouse research or third party reports or otherwise.
The report and information contained herein is strictly confidential and meant solely for the selected recipient and may not be altered in any way,
transmitted to, copied or distributed, in part or in whole, to any other person or to the media or reproduced in any form, without prior written
consent.
