October
03
, 2023
www.angelone.in
Technical & Derivatives Report
8
Nifty Bank Outlook (
4
4
585
)
We began the week on Monday on a subdued note but experienced
decent buying initially, pushing it towards 44900. However, the
market remained somewhat uncertain at higher levels, leading to
follow-through profit-taking in the subsequent three sessions. The
October series began on an optimistic note, with fresh buying evident
right from the outset. As the day unfolded, the banking index not only
sustained its gains but also inched higher, testing the 44750 mark. Due
to modest profit booking towards the end, the index concluded the
week with a negligible loss.
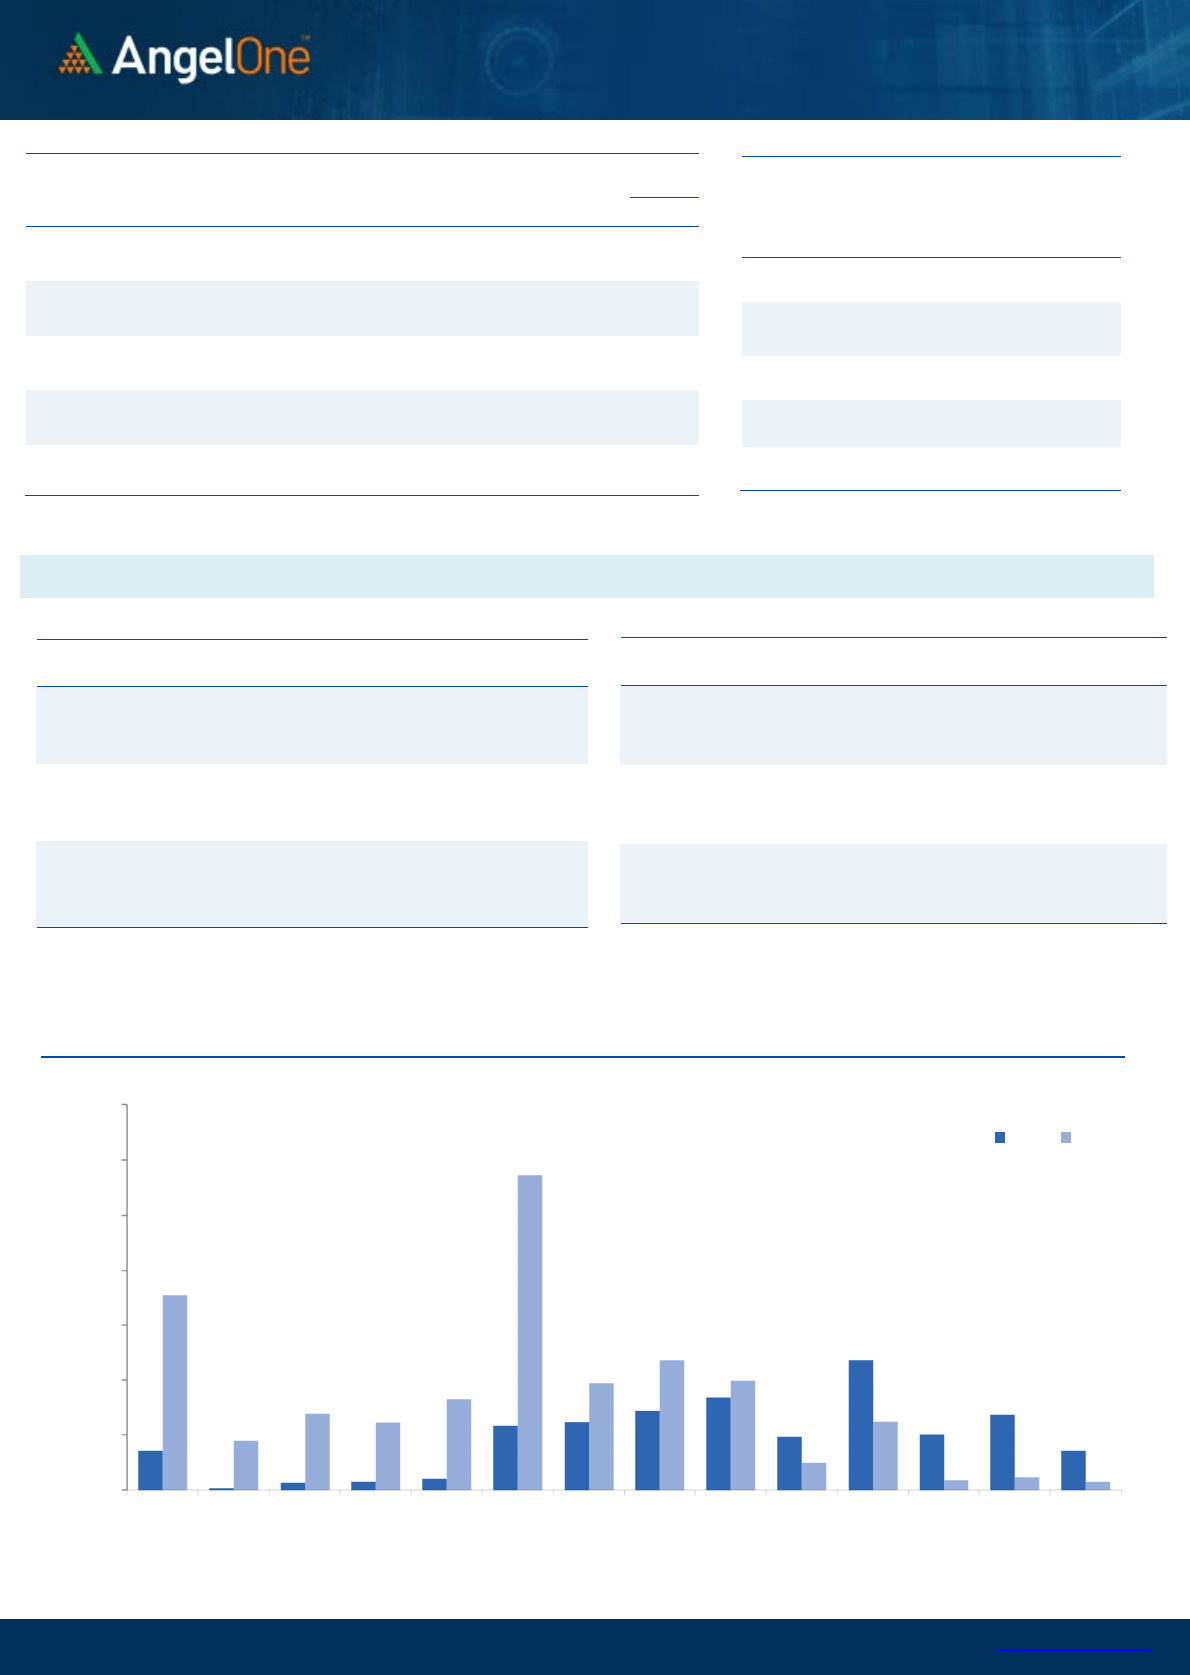
The BANKNIFTY kept vacillating in a narrow range of 750 points this
week with slightly higher volatility. Mostly, it continued to be the
weakest link, barring the last couple of sessions. From a technical
standpoint, the banking index is hovering around the 89-EMA on the
daily chart, coinciding with the rising trend line. This level holds
significance as the index rebounded from this same moving average in
the previous month. Given the strong comeback on Friday, we are
optimistic for this week.
Key Levels
Support 1 – 44000 Resistance 1 – 44800
Support 2 – 43800 Resistance 2 – 45000
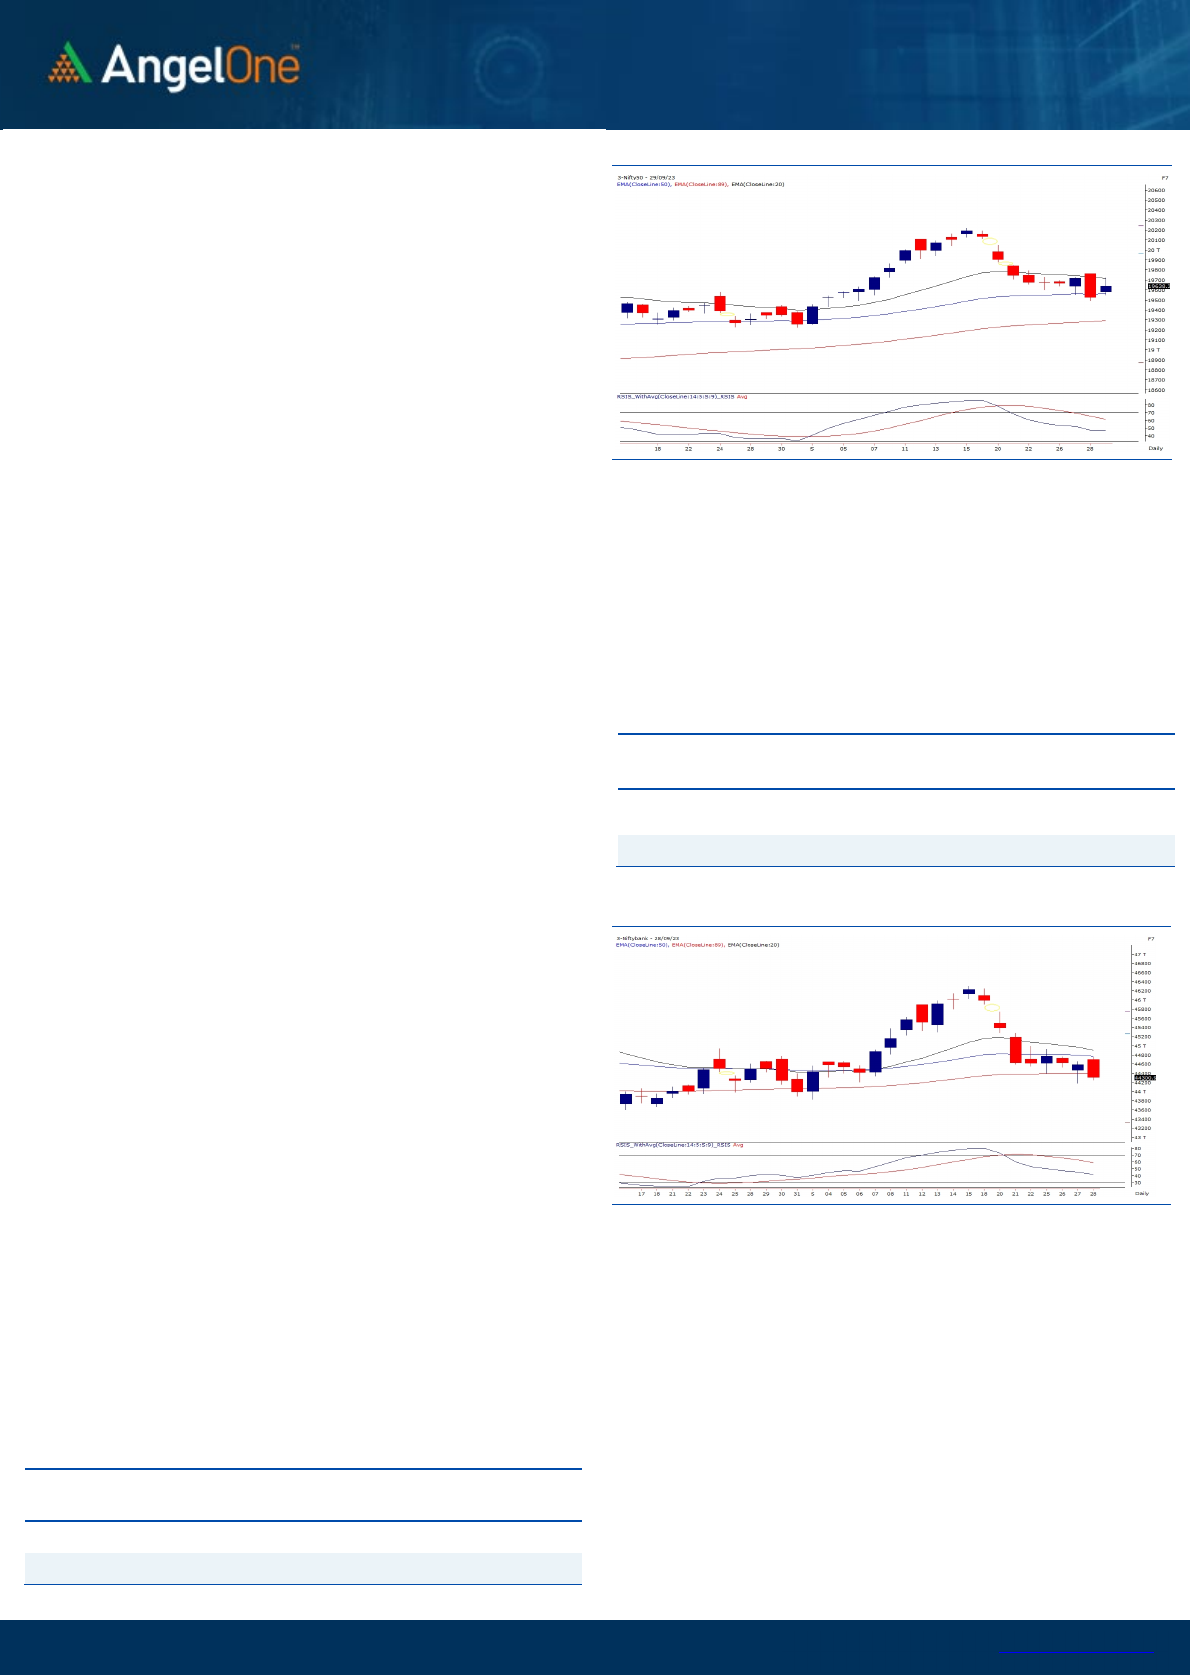
Exhibit 1: Nifty Daily Chart
Exhibit 2: Nifty Bank Daily Chart
Sensex (
6
5
828
) / Nifty (
19
638
)
The trading week began on an intriguing note, commencing with a halt
in the decline from the previous week and observing two trading
sessions with no significant price changes. Wednesday saw some
buying interest from lower levels, instilling optimism. However, on the
monthly expiry day, prices remained uncertain at higher levels and
experienced another round of profit booking. Eventually, on Friday, the
market rebounded from crucial support levels. Despite a week-long
tug-of-war between bulls and bears, prices closed the week with no
major change ending a tad below the 19650 mark.
From a technical standpoint, little has altered this week, as prices
oscillated within a defined range. On the daily chart, prices stayed
within a specific range, with 19500 serving as immediate support and
19750 - 19800 as formidable resistance. September concluded with a
2% gain, although the late sell-off in the last two weeks was
disheartening. Having said that, prices defended the critical support
levels of the 50SMA and 61.8% retracement on a weekly basis. If prices
continue to hold and break above the mentioned resistance, October
could potentially turn out in the favour of the bulls. Global cues will play
a crucial role in this scenario, hence, one needs to keep a close eye on
them. On the downside, the 19500 - 19550 range provided strong
support and should be considered a pivotal level.
A breach below this range could trigger further declines, with levels
around 19300 marked by the 89-day EMA and the starting point of
the recent rally at 19200 possibly becoming the next downside
target. Traders should closely track these levels and make their
trading decisions accordingly. While the major indices traded within
a range, there was active participation in the broader market during
the week. A thematic approach can be pursued, but investors should
exercise caution and be highly selective to identify opportunities for
out-performance.
Key Levels
Support 1 – 19550 Resistance 1 – 19750
Support 2 – 19500 Resistance 2 – 19850
However, one should avoid being aggressive till the time few
important levels are not reclaimed on the higher side. In terms of
key levels, as long as we manage to stay above the recent swing lows
of around 44000-43800, the sentiment remains bullish. On the
upside, any sustained movement beyond 44800-45000 would be an
encouraging sign.

www.angelone.in
Technical & Derivatives Report
October
03
,
2023
View
The Indian equity market witnessed a lackluster
week of trade, barring the expiry session. The
benchmark index Nifty50 had a subdued closure on
a weekly basis, prompting signs of a breather after
the previous week’s correction.
FIIs were net sellers in the cash market segment to
the tune of Rs. 1686 cr. Simultaneously, they sold
worth Rs. 701 cr in Index futures with an insignificant
change in open interest.
The October month series started with a short
covering in key indices, indicating an early sign of
relief. The derivative data remains insignificant
ahead of the extended weekend, while on the
options front, noteworthy piling is seen at 19600-
19500 put strikes, suggesting strong nearby support.
On the higher end, the 19800-call strike withholds
the highest OI, followed by 19700 CE, indicating an
intermediate resistance zone. Meanwhile, the selling
streak from stronger hands continues in the cash
segment, while curtailing longs in the index future
segment led to a deep correction in the ‘Long Short
Ratio’ to 28% from 53% on a weekly basis.
Comments
The Nifty futures open interest has decreased by 2.45%
and Bank Nifty futures open interest has decreased by
3.76% as the market closed at 19638.30.
The Nifty October future closed with a premium of
70.70 points against 113.55 points in the last trading
session. The November series closed at a premium of
188.30 points.
The INDIA VIX has decreased from 12.82 to 11.45. At
the same time, the PCR-OI of Nifty has increased from
0.98 to 1.03.
A few of the liquid counters where we have seen high
cost of carry are NAVINFLUOR, GLENMARK, SUNTV,
VEDL and ABBOTINDIA.
Historical Volatility
SCRIP HV
BERGEPAINT 30.43
CANBK 42.17
ZYDUSLIFE 28.66
GRANULES 38.81
DRREDDY 25.18
Nifty Vs OI
19000
19200
19400
19600
19800
20000
20200
20400
20600
9,000
9,500
10,000
10,500
11,000
11,500
12,000
12,500
13,000
13,500
14,000
9-13 9-15 9-19 9-25 9-27 9-29
Openinterest Nifty
OI Gainers
SCRIP OI
OI
CHG. (%)
PRICE
PRICE
CHG. (%)
NAVINFLUOR 1247700 136.51 3766.70 -12.99
DELTACORP 13062000 21.83 142.70 0.88
LTIM 1738350 15.98 5209.85 -1.68
INDIACEM 17518900 15.75 233.20 2.58
LALPATHLAB 886800 14.13 2524.25 4.46
SUNTV 9040500 14.10 612.15 5.18
LUPIN 5738350 12.61 1171.25 3.49
GRANULES 11210000 12.17 354.75 3.81
OI Losers
SCRIP OI
OI
CHG. (%)
PRICE
PRICE
CHG. (%)
GLENMARK 17600 -8.20 855.50 9.67
CROMPTON 11502000 -6.43 309.85 1.20
LAURUSLABS 11561700 -5.99 395.40 2.39
VEDL 65642000 -5.79 222.55 6.55
HAL 9706200 -5.16 1928.15 2.10
HINDPETRO 50022900 -4.47 254.95 1.89
ICICIGI 2887000 -4.20 1309.55 2.25
PEL 9950250 -3.93 1049.35 3.18
Put-Call Ratio
SCRIP PCR (OI) PCR (VOL)
NIFTY 1.03 0.93
BANKNIFTY 0.90 0.88
RELIANCE 0.69 0.45
ICICIBANK 0.57 0.57
INFY 0.58 0.49
www.angelone.in
Technical & Derivatives Report
October
03
,
2023
Note: Above mentioned Bullish or Bearish Spreads in Nifty (Oct Series) are given as an information and not as a recommendation.
Nifty Spot =
19
638
.
30
FII Statistics for
September
2
9
, 2023
Detail Buy
Contracts
OI Value
(in Cr.)
Sell Net
CHANGE
INDEX
FUTURES
2930.72 3631.40 (700.68) 147633 12109.91 0.36
INDEX
OPTIONS
819433.20 845184.61 (25751.41) 3001849 248230.64 20.36
STOCK
FUTURES
16041.85 14325.49 1716.36
2376674 188299.38 0.87
STOCK
OPTIONS
16198.50 16054.31 144.19
105545 8553.57
211.04
Total
854604.27
879195.81
(24591.54) 5631701
457193.50
11.93
Turnover on
September
2
9
, 2023
Instrument
No. of
Contracts
Turnover
(in Cr.)
Change
(%)
Index Futures
339818 27722.93
-48.80
Index Options
253712256
43478.61
-35.11
Stock Futures
890518 73586.60
-67.27
Stock Options
3130256 5152.79
18.16
Total
31,30,256
5152.79
-57.20
Bull-Call Spreads
Action Strike Price Risk Reward BEP
Buy
19500 358.55
68.30
31.70
19568.30
Sell
19600 290.25
Buy
19500 358.55
127.20
72.80
19627.20
Sell
19700 231.35
Buy
19600 290.25
58.90 41.10 19658.90
Sell
19700 231.35
Bear-Put Spreads
Action Strike Price Risk Reward BEP
Buy
19700 222.10
40.05
59.95
19659.95
Sell 19600 182.05
Buy 19700 222.10
71.50
128.50
19628.50
Sell
19500 150.60
Buy
19600 182.05
31.45 68.55 19568.55
Sell 19500 150.60
Nifty Put
-
Call Analysis
,0
1000,000
2000,000
3000,000
4000,000
5000,000
6000,000
7000,000
19000 19100 19200 19300 19400 19500 19600 19700 19800 19900 20000 20100 20200 20300
Call Put

www.angelone.in
Technical & Derivatives Report
October
03
,
2023
`
Daily Pivot Levels for Nifty Constituents
Scrips S2 S1 PIVOT R1 R2
ADANIENT 2,358 2,386 2,433 2,461 2,507
ADANIPORTS 816 821 827 831 837
APOLLOHOSP 4,957 5,047 5,117 5,208 5,277
ASIANPAINT 3,102 3,132 3,163 3,193 3,224
AXISBANK 1,018 1,027 1,034 1,044 1,051
BAJAJ-AUTO 4,973 5,018 5,050 5,096 5,128
BAJFINANCE 7,672 7,741 7,795 7,864 7,918
BAJAJFINSV 1,521 1,531 1,542 1,551 1,563
BPCL 343 345 347 348 350
BHARTIARTL 914 920 928 935 943
BRITANNIA 4,474 4,506 4,533 4,565 4,592
CIPLA 1,149 1,168 1,183 1,202 1,218
COALINDIA 289 292 295 298 301
DIVISLAB 3,648 3,707 3,745 3,804 3,842
DRREDDY 5,380 5,484 5,557 5,660 5,734
EICHERMOT 3,397 3,422 3,451 3,476 3,505
GRASIM 1,893 1,918 1,934 1,959 1,976
HCLTECH 1,215 1,225 1,237 1,247 1,260
HDFCBANK 1,515 1,521 1,528 1,534 1,541
HDFCLIFE 627 632 636 641 645
HEROMOTOCO 2,935 2,996 3,033 3,094 3,131
HINDALCO 467 480 487 500 507
HINDUNILVR 2,441 2,453 2,463 2,475 2,485
ICICIBANK 938 945 951 957 963
INDUSINDBK 1,382 1,405 1,423 1,446 1,463
INFY 1,402 1,419 1,433 1,450 1,464
ITC 437 441 443 447 449
JSW STEEL 766 773 778 785 791
KOTAKBANK 1,727 1,731 1,738 1,742 1,749
LT 2,976 3,000 3,029 3,053 3,082
LTIMINDTREE 5,039 5,124 5,214 5,299 5,389
M&M 1,534 1,544 1,560 1,570 1,587
MARUTI 10,414 10,512 10,609 10,707 10,804
NESTLEIND 22,272 22,390 22,547 22,665 22,822
NTPC 234 240 246 252 258
ONGC 187 189 191 193 195
POWERGRID 197 199 200 201 203
RELIANCE 2,314 2,330 2,349 2,365 2,384
SBILIFE 1,279 1,292 1,302 1,315 1,325
SBIN 588 593 597 602 605
SUNPHARMA 1,120 1,140 1,153 1,173 1,187
TCS 3,471 3,500 3,534 3,563 3,597
TATACONSUM
867 872 879 884 891
TATAMOTORS 611 620 627 636 643
TATASTEEL 127 128 129 130 131
TECHM 1,200 1,211 1,221 1,233 1,243
TITAN 3,123 3,136 3,156 3,169 3,190
ULTRACEMCO 8,070 8,163 8,224 8,317 8,378
UPL 603 610 616 622 628
WIPRO 398 402 406 410 413

www.angelone.in
Technical & Derivatives Report
October
03
,
2023
Technical and Derivatives Team:
Sameet Chavan Head Research – Technical & Derivatives sameet.chavan@angelone.in
Sneha Seth Senior Analyst – Technical & Derivatives sneha.seth@angelone.in
Rajesh Bhosale Analyst - Technical rajesh.bhosle@angelone.in
Osho Krishan Senior Analyst – Technical & Derivatives osho.krishan@angelone.in
Hitesh Rathi Analyst – Technical & Derivatives hitesh.rathi@angelone.in
Research Team Tel: 022 – 39357600 Website: www.angelone.in
For Technical Queries E-mail: technicalresearch-cso@angelone.in
For Derivatives Queries E-mail: derivatives.desk@angelone.in
DISCLAIMER
We, Angel One Limited (hereinafter referred to as “Angel”) a company duly incorporated under the provisions of the Companies Act, 1956 with
its registered office at 601, 6th Floor, Ackruti Star, Central Road, MIDC, Andheri East, Mumbai – 400093, CIN: (L67120MH1996PLC101709) and
duly registered as a member of National Stock Exchange of India Limited, Bombay Stock Exchange Limited, Metropolitan Stock Exchange Limited,
Multi Commodity Exchange of India Ltd and National Commodity & Derivatives Exchange Ltd. Angel One limited is a company engaged in
diversified financial services business including securities broking, DP services, distribution of Mutual Fund products. It is also registered as a
Depository Participant with CDSL and Portfolio Manager and Investment Adviser with SEBI. It also has registration with AMFI as a Mutual Fund
Distributor. Angel One Limited is a registered entity with SEBI for Research Analyst in terms of SEBI (Research Analyst) Regulations, 2014 vide
registration number INH000000164 and also registered with PFRDA as PoP ,Registration No.19092018. Angel Group does not have any joint
ventures or associates. Angel One Limited is the ultimate parent company of the Group. Angel or its associates has not been debarred/ suspended
by SEBI or any other regulatory authority for accessing /dealing in securities Market.
AOL was merged with Angel Global Capital Private Limited and subsequently name of Angel Global Capital Private Limited was changed to Angel
Broking Private Limited (AOL) pursuant to scheme of Amalgamation sanctioned by the Hon'ble High Court of Judicature at Bombay by Orders
passed in Company Petition No 710 of 2011 and the approval granted by the Registrar of Companies. Further, name of Angel Broking Private
Limited again got changed to Angel Broking Limited (AOL) pursuant to fresh certificate of incorporation issued by Registrar of Companies (ROC)
dated June 28, 2018. Further name of Angel Broking name changed to Angel One Ltd pursuant to fresh certificate of incorporation issued by
Registrar of Companies (ROC) dated 23-09-21.
In case of any grievances please write to: support@angelone.in, Compliance Officer Details: Name : Hiren Thakkar, Tel No. –08657864228, Email
id - compliance@angelone.in
Registration granted by SEBI and certification from NISM in no way guarantee performance of the intermediary or provide any assurance of returns
to investors.
This document is solely for the personal information of the recipient, and must not be singularly used as the basis of any investment decision.
Nothing in this document should be construed as investment or financial advice. Each recipient of this document should make such investigations
as they deem necessary to arrive at an independent evaluation of an investment in the securities of the companies referred to in this document
(including the merits and risks involved), and should consult their own advisors to determine the merits and risks of such an investment.
Angel or its associates or research analyst or his relative may have actual/beneficial ownership of 1% or more in the securities of the subject
company at the end of the month immediately preceding the date of publication of the research report. Neither Angel or its associates nor
Research Analysts or his relative has any material conflict of interest at the time of publication of research report.
Angel or its associates might have received any compensation from the companies mentioned in the report during the period preceding twelve
months from the date of this report for services in respect of managing or co-managing public offerings, corporate finance, investment banking or
merchant banking, brokerage services or other advisory service in a merger or specific transaction in the normal course of business. Angel or its
associates did not receive any compensation or other benefits from the companies mentioned in the report or third party in connection with the
research report. Neither research entity nor research analyst has been engaged in market making activity for the subject company.

www.angelone.in
Technical & Derivatives Report
October
03
,
2023
*
Reports based on technical and derivative analysis center on studying charts of a stock's price movement, outstanding positions and trading
volume, as opposed to focusing on a company's fundamentals and, as such, may not match with a report on a company's fundamentals. Investors
are advised to refer the Fundamental and Technical Research Reports available on our website to evaluate the contrary view, if any.
The information in this document has been printed on the basis of publicly available information, internal data and other reliable sources believed
to be true, but we do not represent that it is accurate or complete and it should not be relied on as such, as this document is for general guidance
only. Angel One Limited or any of its affiliates/ group companies shall not be in any way responsible for any loss or damage that may arise to any
person from any inadvertent error in the information contained in this report. Angel One Limited does not warrant the accuracy, adequacy or
completeness of the service, information and materials and expressly disclaims liability for errors or omissions in the service, information and
materials. While Angel One Limited endeavours to update on a reasonable basis the information discussed in this material, there may be
regulatory, compliance, or other reasons that prevent us from doing so.
This document is being supplied to you solely for your information, and its contents, information or data may not be reproduced, redistributed or
passed on, directly or indirectly.
Neither Angel One Limited, nor its directors, employees or affiliates shall be liable for any loss or damage that may arise from or in connection
with the use of this information. Angel or its associates or Research Analyst or his relative might have financial interest in the subject company.
Research analyst has not served as an officer, director or employee of the subject company.
Investment in securities market are subject to market risks. Read all the related documents carefully before investing.
Any communication sent to clients on phone numbers or e-mail ids registered with the Trading Member is meant for client consumption and such
material should not be redistributed. Brokerage will not exceed SEBI prescribed limit. Any Information provided by us through any medium based
on our research or that of our affiliates or third parties or other external sources is subject to domestic and international market conditions and
we do not guarantee the availability or otherwise of any securities or other instruments and such Information is merely an estimation of certain
investments, and we have not and shall not be deemed to have assumed any responsibility for any such Information. You should seek independent
professional advice and/or tax advice regarding the suitability of any investment decision whether based on any Information provided by us
through the Site from inhouse research or third party reports or otherwise.
The report and information contained herein is strictly confidential and meant solely for the selected recipient and may not be altered in any way,
transmitted to, copied or distributed, in part or in whole, to any other person or to the media or reproduced in any form, without prior written
consent.
