March 03, 2023
www.angelone.in
Technical & Derivatives Report
Nifty Bank
Outlook (
40
390
)
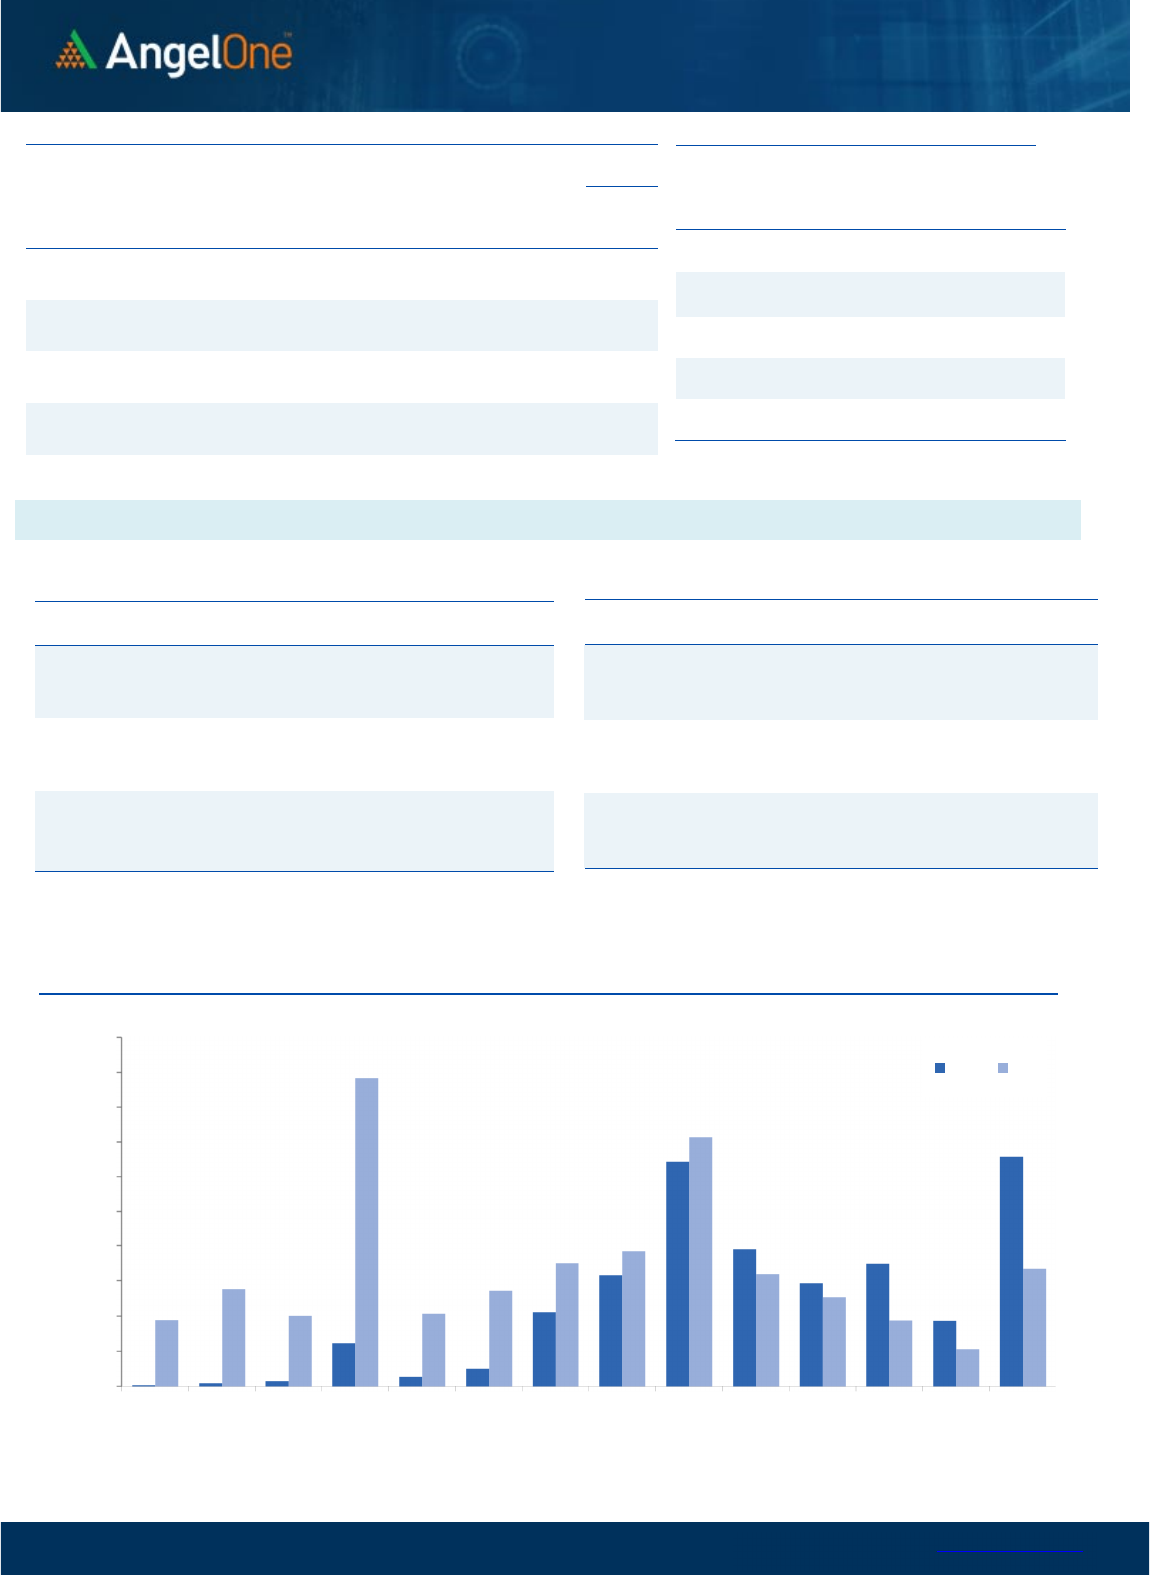
The BANKNIFTY started the session slightly in the red in tandem
with benchmark index. After some initial swings, the prices started
declining, which kept happening throughout the session in a
gradual manner. Eventually, the BANKNIFTY ended the session tad
below 40400 by shedding nearly eight tenths of percent from
previous close.
Looking at Wednesday’s move, we expected some decent moves
in the upward direction. But due to lack up follow up buying, it
poured water on this promising attempt. Now although, the
correction was a bit depressing, we continue to remain hopeful as
long as 40000 - 39700 is being held convincingly. Hence, traders are
advised not to lose hope and wait for a sustenance above 40800-
41000. Meanwhile, 40500-40700 are to be seen immediate
hurdles.
Key Levels
Support 1 – 40200 Resistance 1 – 40700
Support 2 – 40000 Resistance 2 – 41000
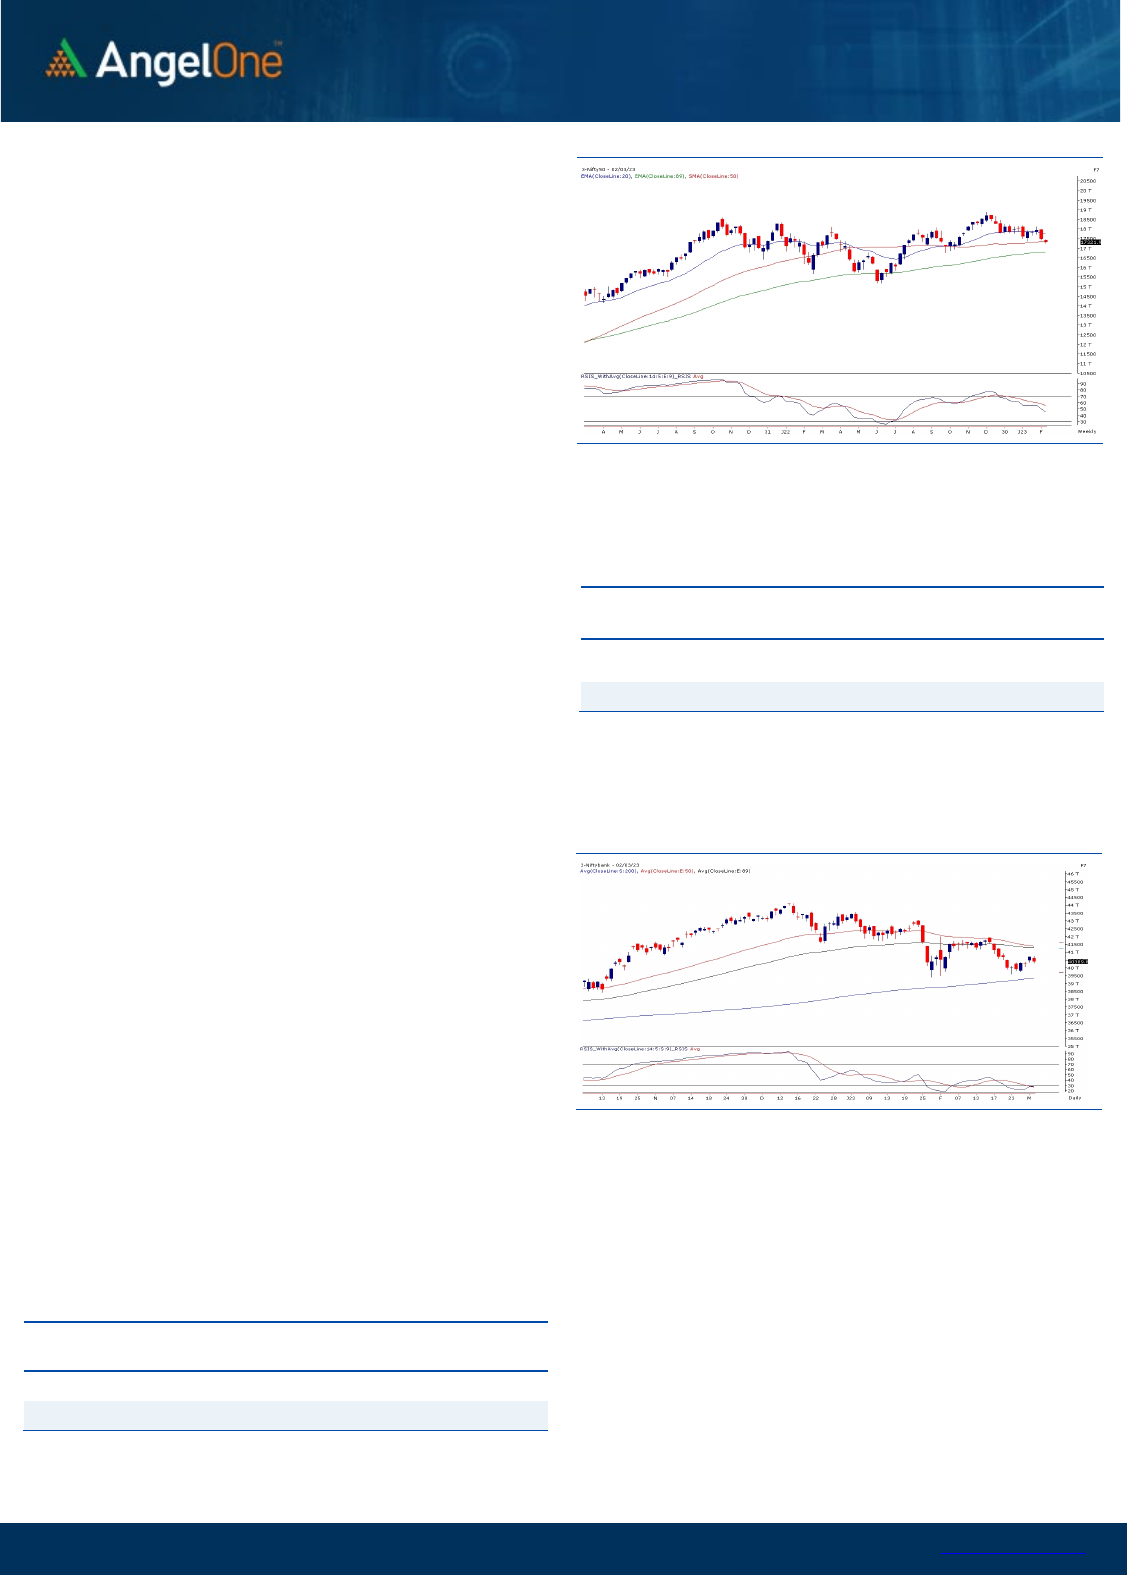
Exhibit 1: Nifty Daily Chart
Exhibit 2: Nifty Bank Daily Chart
Sensex (
5
8909
) / Nifty (
1
7
322
)
Our market started the weekly expiry session on a bleak note, taking
cues from the SGX Nifty and soon after the opening bell the
benchmark index descended to the lower grounds. The bears once
again tightened their grip, showing strong resilience in letting the
Nifty surge. By the latter half, another round of sell-off dragged the
index below previous day’s swing low dampening sentiments. Post
all hustles, Nifty concluded the day in red with a cut of 0.74 percent
and settled a tad above the 17300 level.
Technically speaking, a sign of timidness is evident as there is no cue
of follow-up buying in the index to levitate the sentiments. The
recent developments construe a motion of tentativeness among the
market participants as Nifty struggles around the 200 SMA. The
absence of buying is only worrisome; however, most of the
indicators are in the oversold terrain and traders need to avoid fresh
short bets for the time being. As far as levels are concerned, the
immediate swing low of 17255 could act as the initial support zone,
breaching which 17200-17100 could be tested in the comparable
period. While on the higher end, 17450-17500 is the sturdy hurdle
and an authoritative breach could only turn around the sentiments
in the market.
As we advance, we advocate traders to keep a close tab on the
mentioned levels and should focus on a stock-centric approach
for better trading opportunities. Also, one should stay abreast
with global developments.
Key Levels
Support 1 – 17255 Resistance 1 – 17450
Support 2 – 17100 Resistance 2 – 17500

www.angelone.in
Technical & Derivatives Report
March 03, 2023
View
On the weekly expiry session, we witnessed some
tentativeness right from the word go to drag index
towards 17300.
FIIs were net buyers in the cash market segment to
the tune of Rs. 12771 crores. Simultaneously, in
Index futures, they sold worth Rs. 532 crores with
decrease in open interest, indicating long unwinding.
On the weekly expiry day, we witnessed a mixed bag
of pictures, as there was short formations in Nifty
whereas long unwinding in Bank Nifty. FIIs were
buyers in the cash segment considering the block
deal in the Adani group whereas in index futures
unwinding of longs were seen. On the option chain
front, 17400 CALL strike has decent build up whereas
on the PUT side 17000 strike is acting as support.
LONG SHORT Ratio has plunged back below 15% and
indicates markets in oversold zone. Considering this
factor we continue to advise traders to avoid fresh
short positions at current levels and look for buying
opportunities.
Comments
The Nifty futures open interest has increased by 2.59%
and Bank Nifty futures open interest has decreased by
2.27% as the market closed at 17321.90.
The Nifty March future closed with a premium of 77.5
point against a premium of 81.8 point in the last trading
session. The April series closed at a premium of 178.45
point.
The INDIA VIX decreased from 12.99 to 12.97. At the
same time, the PCR-OI of Nifty has decreased from 0.92
to 0.76.
Few of the liquid counters where we have seen high
cost of carry are ADANIENT, RAIN, CHOLAFIN,
HINDPETRO, AND ZYDUSLIFE.
Historical Volatility
SCRIP HV
SIEMENS 32.33
ESCORTS 41.06
AMBUJACEM 55.98
MARUTI 30.81
BATAINDIA 30.94
Nifty Vs OI
17400
17500
17600
17700
17800
17900
18000
18100
18200
4,000
6,000
8,000
10,000
12,000
14,000
16,000
2/8 2/10 2/14 2/16 2/20 2/23 2/27
Openinterest Nifty
OI Gainers
SCRIP OI
OI
CHG. (%)
PRICE
PRICE
CHG. (%)
POWERGRID 32073300 13.64 220.35 1.00
ADANIENT 16306500 12.29 1607.20 3.13
VOLTAS 5251800 11.75 918.80 1.23
TORNTPOWER 3646500 11.46 515.60 1.59
MCX 983600 8.57 1424.30 -1.88
LTTS 1176000 8.23 3698.55 -1.62
PETRONET 13095000 7.12 221.90 0.47
MFSL 3532100 6.93 686.55 -1.78
OI Losers
SCRIP OI
OI
CHG. (%)
PRICE
PRICE
CHG. (%)
CROMPTON 5482500 -7.02 308.75 -0.51
MRF 55570 -5.54 86802.70 0.67
COALINDIA 38375400 -5.20 222.85 2.54
ABBOTINDIA 45920 -4.73 20094.70 -1.50
HONAUT 24105 -4.23 35397.15 0.03
APOLLOHOSP 1372375 -3.88 4402.20 -0.12
BHEL 71137500 -3.86 74.80 2.26
TECHM 10600800 -3.69 1109.80 -1.34
Put-Call Ratio
SCRIP PCR (OI) PCR (VOL)
NIFTY 0.76 0.96
BANKNIFTY 0.79 1.04
RELIANCE 0.59 0.43
ICICIBANK 0.68 0.64
INFY 0.51 0.54
www.angelone.in
Technical & Derivatives Report
March 03, 2023
Note: Above mentioned Bullish or Bearish Spreads in Nifty (March Series) are given as an information and not as a recommendation.
Nifty Spot =
1
7321.90
0900
Lot Size = 75
FII Statistics for
March 0
2
, 202
3
Detail Buy
Contracts
Open
Interest
Value
(in Cr.)
Sell
Net
CHANGE
INDEX
FUTURES
5908.07 6440.43 (532.36) 186446 16789.18 (5.44)
INDEX
OPTIONS
2274632.26 2256380.06 18252.20
1899927 169098.26 (30.65)
STOCK
FUTURES
10143.97 12725.10 (2581.13) 2142859 140694.94 (1.41)
STOCK
OPTIONS
6606.05 6730.05 (124.00) 118369 7754.01 11.99
Total 2297290.35
2282275.64
15014.71
4347601
334336.39
(16.65)
Turnover
on
March
0
2
, 202
3
Instrumen
t
No. of
Contracts
Turnover
( in Cr. )
Change
(%)
Index Futures
327351
30483.48 17.04
Index Options
3559695
85
51617.94 17.00
Stock Futures
755562
47025.65 1.11
Stock Options
2422927
3599.73 0.09
Total
2,422,92
7
3599.73 10.36
Bull-Call Spreads
Action Strike Price Risk Reward BEP
Buy
17400 213.50
51.20 48.80 17451.20
Sell
17500 162.30
Buy
17400 213.50
93.75 106.25 17493.75
Sell
17600 119.75
Buy
17500 162.30
42.55 57.45 17542.55
Sell
17600 119.75
Bear-Put Spreads
Action Strike Price Risk Reward BEP
Buy
17300 175.70
33.45 66.55 17266.55
Sell 17200 142.25
Buy 17300 175.70
61.55 138.45 17238.45
Sell
17100 114.15
Buy
17200 142.25
28.10 71.90 17171.90
Sell 17100 114.15
Nifty Put-Call Analysis
,0
500,000
1000,000
1500,000
2000,000
2500,000
3000,000
3500,000
4000,000
4500,000
5000,000
16700 16800 16900 17000 17100 17200 17300 17400 17500 17600 17700 17800 17900 18000
Call Put

www.angelone.in
Technical & Derivatives Report
March 03, 2023
`
Daily
Pivot Levels for Nifty Constituents
Scrips
S2
S1
PIVOT
R1
R2
ADANIENT
1,316
1,461
1,554
1,700
1,792
ADANIPORTS 572 597
611
637
651
APOLLOHOSP
4,342
4,372
4,411
4,441
4,480
ASIANPAINT
2,793
2,814
2,831
2,852
2,869
AXISBANK 829 837
852
860
875
BAJAJ-AUTO
3,640
3,678
3,718
3,755
3,795
BAJFINANCE
5,981
6,032
6,121
6,172
6,260
BAJAJFINSV
1,307
1,325
1,356
1,374
1,404
BPCL 312 316
319
324
326
BHARTIARTL 727 733
743
749
759
BRITANNIA
4,319
4,357
4,381
4,418
4,443
CIPLA 873 880
891
898
910
COALINDIA 214 219
222
226
229
DIVISLAB
2,809
2,835
2,853
2,879
2,897
DRREDDY
4,289
4,340
4,371
4,421
4,452
EICHERMOT
3,066
3,096
3,127
3,157
3,189
GRASIM
1,582
1,590
1,596
1,604
1,610
HCLTECH
1,078
1,092
1,104
1,119
1,131
HDFCBANK
1,567
1,576
1,591
1,600
1,615
HDFCLIFE
476
479
485
489
495
HDFC
2,577
2,590
2,608
2,622
2,640
HEROMOTOCO
2,420
2,442
2,463
2,484
2,505
HINDALCO 403 407
412
416
421
HINDUNILVR
2,430
2,443
2,456
2,469
2,482
ICICIBANK 845 849
856
860
866
INDUSINDBK
1,085
1,093
1,102
1,111
1,119
INFY
1,455
1,463
1,476
1,485
1,497
ITC 372 374
377
379
382
JSW STEEL 667 671
677
681
688
KOTAKBANK
1,700
1,711
1,729
1,739
1,757
LT
2,085
2,103
2,126
2,145
2,168
M&M
1,231
1,242
1,260
1,270
1,289
MARUTI
8,348
8,448
8,610
8,710
8,872
NESTLEIND
18,236
18,359
18,580
18,702
18,923
NTPC 169 170
171
172
173
ONGC 152 153
154
155
156
POWERGRID 214 217
219
222
224
RELIANCE
2,303
2,315
2,333
2,345
2,363
SBILIFE
1,082
1,091
1,107
1,116
1,132
SBIN 528 531
535
538
543
SUNPHARMA 945 955
961
971
977
TCS
3,285
3,303
3,336
3,355
3,388
TATACONSUM
698 703
711
715
723
TATAMOTORS 415 418
422
425
429
TATASTEEL 103 104
105
106
108
TECHM
1,094
1,102
1,113
1,121
1,132
TITAN
2,326
2,342
2,368
2,385
2,411
ULTRACEMCO
7,214
7,251
7,291
7,329
7,368
UPL 697 701
709
713
721
WIPRO 386 387
389
390
392

www.angelone.in
Technical & Derivatives Report
March 03, 2023
*
Technical and Derivatives Team:
Sameet Chavan Chief Analyst – Technical & Derivatives sameet.chavan@angelone.in
Sneha Seth Senior Analyst – Technical & Derivatives sneha.seth@angelone.in
Rajesh Bhosale Technical Analyst rajesh.bhosle@angelone.in
Osho Krishan Senior Analyst – Technical & Derivatives osho.krishan@angelone.in
Research Team Tel: 022 – 39357600 Website: www.angelone.in
For Technical Queries E-mail: technicalresearch-cso@angelone.in
For Derivatives Queries E-mail: derivatives.desk@angelone.in
DISCLAIMER
Angel One Limited (hereinafter referred to as “Angel”) is a registered Member of National Stock Exchange of India Limited, Bombay Stock Exchange
Limited and Metropolitan Stock Exchange Limited. It is also registered as a Depository Participant with CDSL and Portfolio Manager and investment
advisor with SEBI. It also has registration with AMFI as a Mutual Fund Distributor. Angel One Limited is a registered entity with SEBI for Research
Analyst in terms of SEBI (Research Analyst) Regulations, 2014 vide registration number INH000000164. Angel or its associates has not been
debarred/ suspended by SEBI or any other regulatory authority for accessing /dealing in securities Market.
This document is solely for the personal information of the recipient, and must not be singularly used as the basis of any investment decision.
Nothing in this document should be construed as investment or financial advice. Each recipient of this document should make such investigations
as they deem necessary to arrive at an independent evaluation of an investment in the securities of the companies referred to in this document
(including the merits and risks involved), and should consult their own advisors to determine the merits and risks of such an investment.
Angel or its associates or research analyst or his relative may have actual/beneficial ownership of 1% or more in the securities of the subject
company at the end of the month immediately preceding the date of publication of the research report. Neither Angel or its associates nor
Research Analysts or his relative has any material conflict of interest at the time of publication of research report.
Angel or its associates might have received any compensation from the companies mentioned in the report during the period preceding twelve
months from the date of this report for services in respect of managing or co-managing public offerings, corporate finance, investment banking or
merchant banking, brokerage services or other advisory service in a merger or specific transaction in the normal course of business. Angel or its
associates did not receive any compensation or other benefits from the companies mentioned in the report or third party in connection with the
research report. Neither Angel nor its research analyst entity has been engaged in market making activity for the subject company.
Reports based on technical and derivative analysis center on studying charts of a stock's price movement, outstanding positions and trading
volume, as opposed to focusing on a company's fundamentals and, as such, may not match with a report on a company's fundamentals. Investors
are advised to refer the Fundamental and Technical Research Reports available on our website to evaluate the contrary view, if any.
The information in this document has been printed on the basis of publicly available information, internal data and other reliable sources believed
to be true, but we do not represent that it is accurate or complete and it should not be relied on as such, as this document is for general guidance
only. Angel One Limited or any of its affiliates/ group companies shall not be in any way responsible for any loss or damage that may arise to any
person from any inadvertent error in the information contained in this report. Angel One Limited has not independently verified all the information
contained within this document. Accordingly, we cannot testify, nor make any representation or warranty, express or implied, to the accuracy,
contents or data contained within this document. While Angel One Limited endeavors to update on a reasonable basis the information discussed
in this material, there may be regulatory, compliance, or other reasons that prevent us from doing so.
This document is being supplied to you solely for your information, and its contents, information or data may not be reproduced, redistributed or
passed on, directly or indirectly.
Neither Angel One Limited, nor its directors, employees or affiliates shall be liable for any loss or damage that may arise from or in connection
with the use of this information. Angel or its associates or Research Analyst or his relative might have financial interest in the subject company.
Research analyst has not served as an officer, director or employee of the subject company.
