DEC 02, 2022
www.angelone.in
Technical & Derivatives Report
xOOOOOOOO
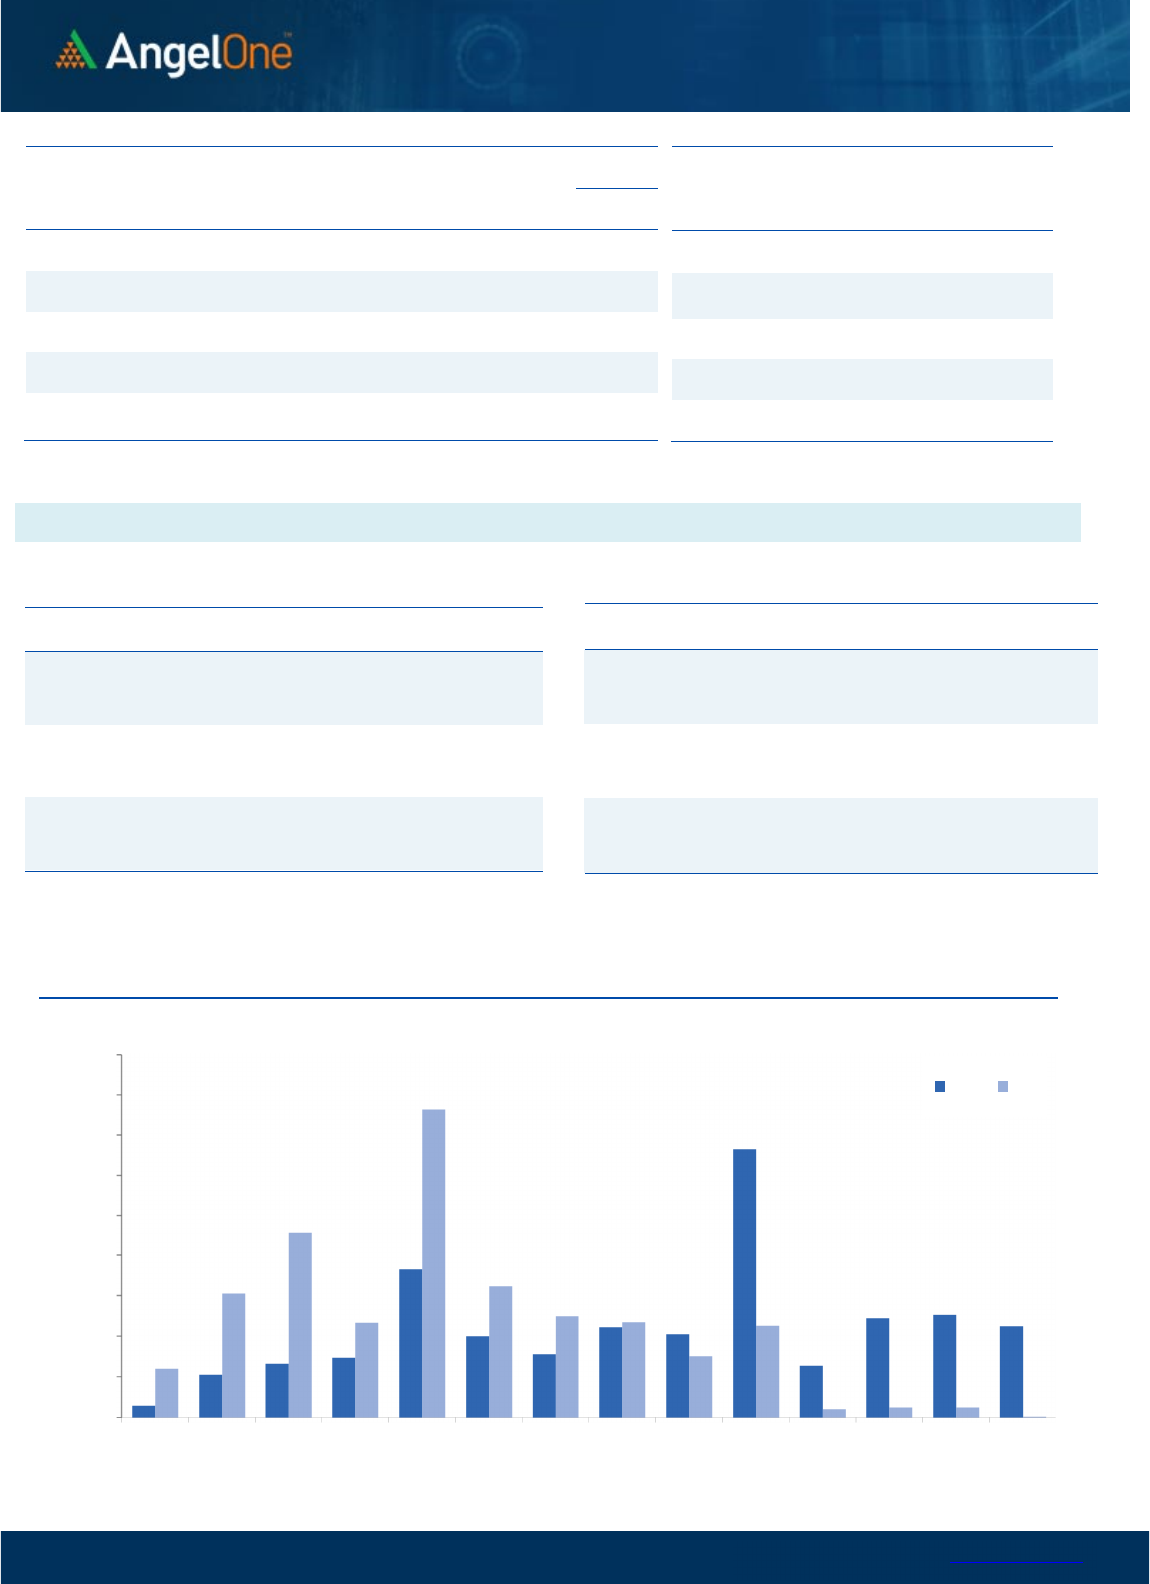
Nifty Bank Outlook (43261)
Bank Nifty as well started on a strong note however we witnessed
an open high kind of scenario where prices right from the word go
started to slide lower to mark an intraday low of 43101.
Subsequently, during the penultimate hour, we witnessed some
volatility amidst the weekly expiry to eventually end flat at 43261.
Technically, not much changed on the index front as the prices
continue to inch higher in the northward direction. In our last
couple of outlooks, we have been mentioning the high overbought
conditions and to prefer buying on dips and selling on the rise. This
has worked well, and we remain with this stance as we expect
some consolidation in the near term. There is however no shortage
of action in individual stocks as they continue to buzz for example
yesterday it was the PSU basket that again resumed positive
traction after a couple of days of pause; traders should continue to
identify such potential outperformers in the near term. As far as
levels for the bank index are concerned, 43040 - 42880 remains an
immediate support whereas 43500 - 43640 is immediate
resistance.
Key Levels
Support 1 – 43040 Resistance 1 – 43500
Support 2 – 42880 Resistance 2 – 43650
Exhibit 1: Nifty
Daily
Chart
Exhibit 2: Nifty Bank
Daily
Chart
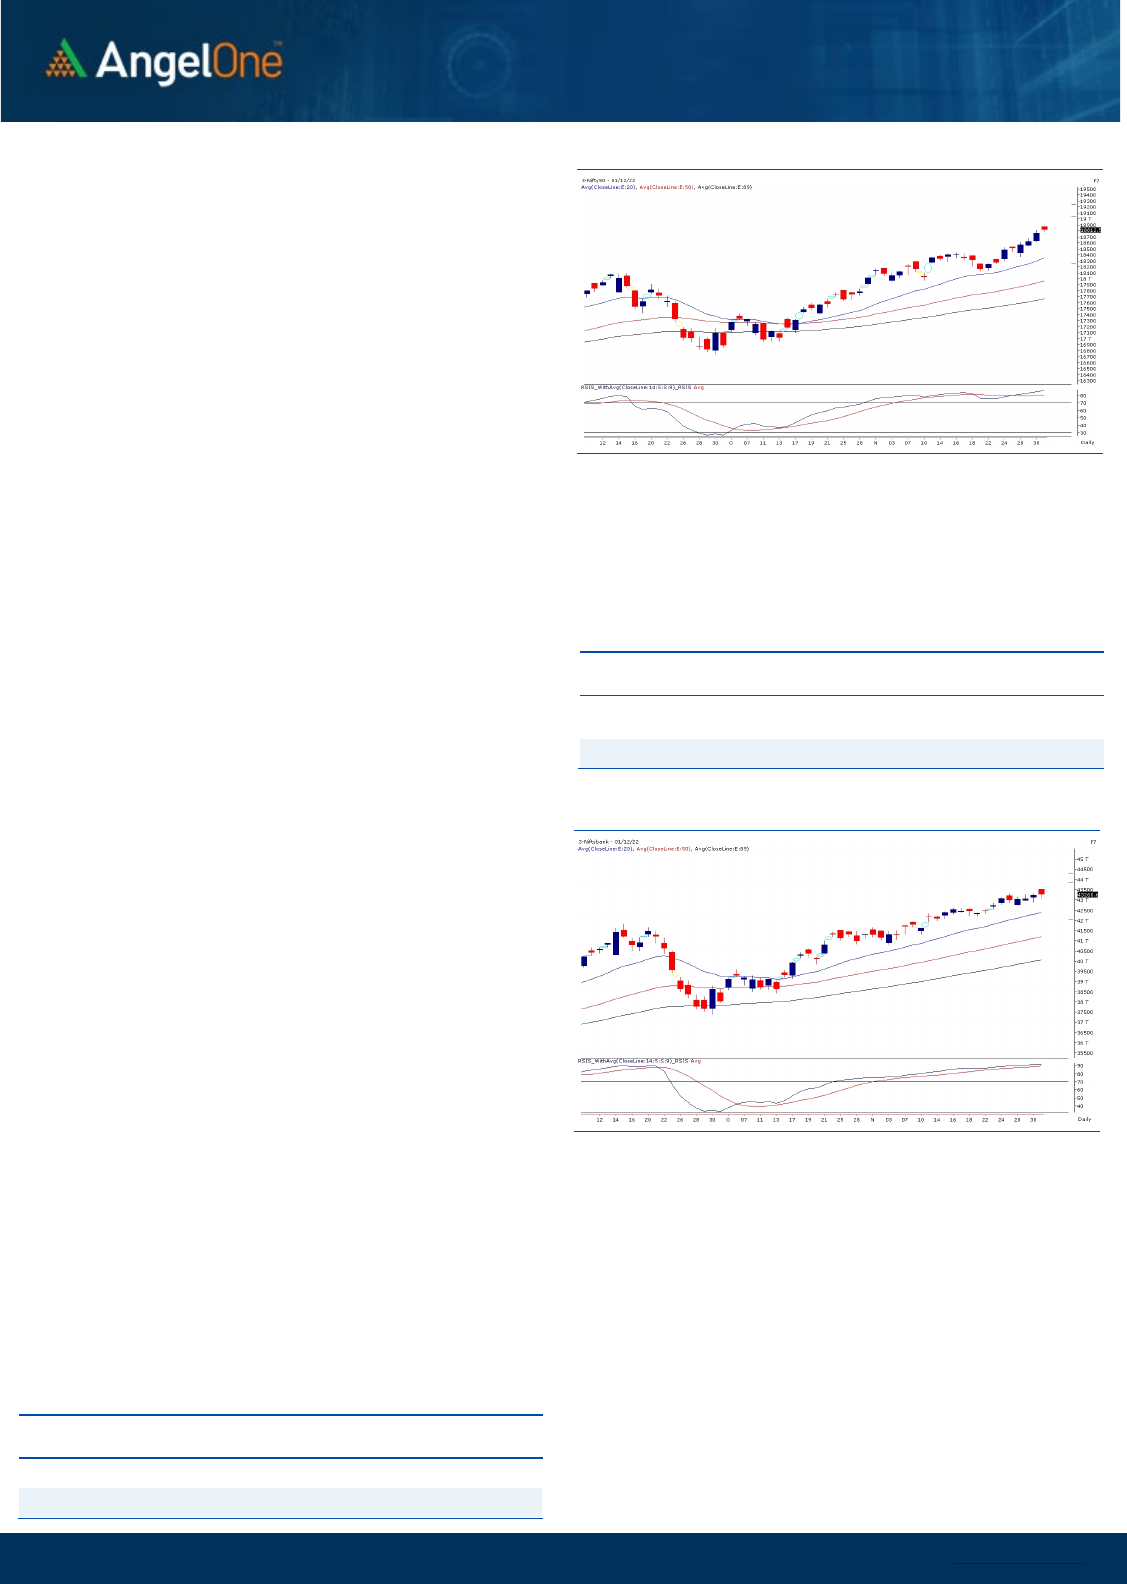
Sensex (63284) / Nifty (18812)
The positive global cues led to a decent gap-up opening to our
domestic market, wherein the benchmark index Nifty50 continued
its northwards journey consecutively for the eighth trading session.
The bulls are being dominant as they persuade on the intraday dip
to showcase their resilience; however, some profit booking was
seen later in the session. The technical structure remains buoyant
as Nifty is in a roll of making higher highs, and with yet another
positive closure Nifty settled at fresh highs of 18812 levels,
procuring 0.29 percent.
The broad-based buying interest has levitated overall market
sentiments, followed by positive developments overseas, which
strengthened the momentum. All these phenomena are auguring
well for the bulls of D-Street. Technically, the structure construes
optimism and any short-term blip to be considered healthy. As far
as levels are concerned, 18600-18500 is likely to be the sacrosanct
support zone. While on the higher end, 18900-19000 is expected to
act as an immediate hurdle for the index in the comparable period.
Looking at the recent developments, the undertone is likely to
remain in favor of the bulls, with significant traction seen outside
the indices. Hence it is advisable to keep Identifying apt themes
and potential movers within the same, which are likely to provide
better trading opportunities. Meanwhile, it is also advisable to
keep a close tab on global developments.
Key Levels
Support 1 – 18675 Resistance 1 – 18900
Support 2 – 18600 Resistance 2 – 19000

www.angelone.in
Technical & Derivatives Report
DEC 02, 2022
View
Our market maintained its winning streak for the
eighth consecutive session, wherein the benchmark
index Nifty50 logs a fresh high to settle above the
18800 zone with gains of 0.29 percent.
FIIs were net sellers in the cash market segment to
the tune of Rs. 1566 crores. Simultaneously, in Index
futures, they sold worth Rs. 526 crores with a
decrease in open interest, indicating long unwinding.
Looking at the overall F&O data, we have witnessed a
mixed trade on the weekly expiry. On the options front,
the piling up of OI is visible in the 18800 put strike,
followed by 18600 PE, indicating nearby support. On the
higher end, the piling up of positions could be seen at
the 19000-call strike, suggesting the immediate
resistance for the index. Meanwhile, the stronger
hands have remained steady with their bullish bets as
the ‘Long Short Ratio’ remained unchanged at 75%.
Considering the recent price action, the undertone is
likely to remain upbeat, and any intra-day dip towards
the mentioned support zone could augur well for the
bulls to add long bets in the index.
Comments
The Nifty futures open interest has increased by
0.55% and Bank Nifty futures open interest has
decreased by 0.27% as the market closed at 18812.50.
The Nifty December future closed with a premium of
135.80 point against a premium of 116.15 point in the
last trading session. The January series closed at a
premium of 228.15 point.
The INDIA VIX decreased from 13.80 to 13.36. At the
same time, the PCR-OI of Nifty has decreased to 1.15
from 1.55.
Few of the liquid counters where we have seen high
cost of carry are LTTS, MPHASIS, BSOFT,
PERSISTENT and ATUL.
Historical Volatility
SCRIP HV
IDEA 73.36
IBULHSGFIN 70.19
RBLBANK 68.78
GNFC 59.73
HINDCOPPER 59.09
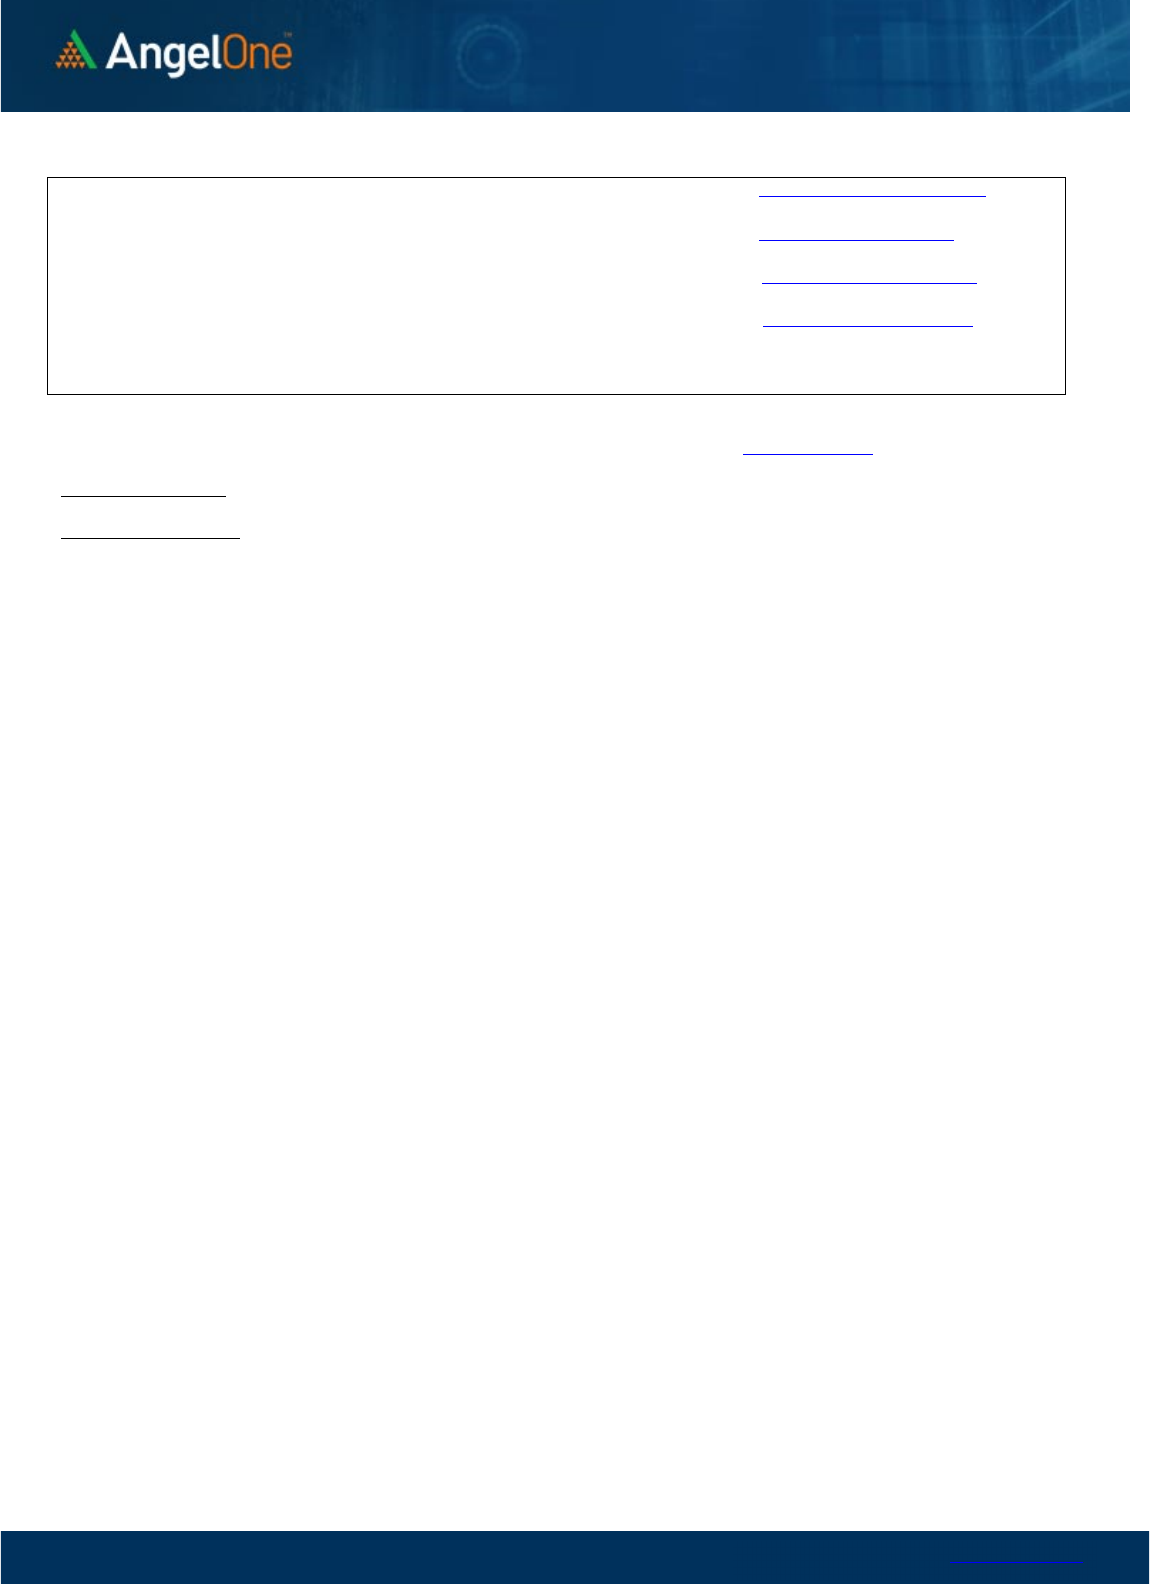
Nifty Vs OI
17800
18000
18200
18400
18600
18800
19000
8,000
9,000
10,000
11,000
12,000
13,000
14,000
15,000
16,000
11/14 11/16 11/18 11/23 11/25 11/29 12/1
Openinterest Nifty
OI Gainers
SCRIP OI
OI
CHG. (%)
PRICE
PRICE
CHG. (%)
OFSS 563600 17.22 3121.20 0.81
ASTRAL 1458600 15.83 1924.20 2.27
GUJGASLTD 5156250 12.67 508.30 1.54
RAIN 10192000 10.81 186.30 2.99
PERSISTENT 547400 10.02 4323.95 4.91
CUB 7685000 7.03 189.45 0.61
BAJAJFINSV 8614000 6.83 1638.80 0.78
HONAUT 33120 6.62 42019.60 1.12
OI Losers
SCRIP OI
OI
CHG. (%)
PRICE
PRICE
CHG. (%)
CUMMINSIND 1590000 -13.96 1437.85 1.31
BANDHANBNK 54068400 -12.51 235.50 -1.15
LICHSGFIN 9814000 -7.22 394.00 1.74
ULTRACEMCO 1857200 -6.57 7274.15 2.47
ICICIGI 4014125 -6.02 1224.65 1.04
APOLLOTYRE 16912000 -5.79 315.50 -0.19
RBLBANK 45070000 -5.38 153.30 0.00
TVSMOTOR 7578200 -5.18 1050.00 0.57
Put-Call Ratio
SCRIP PCR (OI) PCR (VOL)
NIFTY 1.15 1.06
BANKNIFTY 0.81 0.95
RELIANCE 0.71 0.54
ICICIBANK 0.62 0.60
INFY 0.64 0.39
www.angelone.in
Technical & Derivatives Report
DEC 02, 2022
Note: Above mentioned Bullish or Bearish Spreads in Nifty (Dec Series) are given as an information and not as a recommendation.
Nifty Spot =
1
8
812
.
50
FII Statistics for
December
01
, 2022
Detail Buy
Contracts
Open
Interest
Value
(in Cr.)
Sell
Net
CHANGE
INDEX
FUTURES
2816.52 3342.61 (526.09) 193074 19037.54 (4.19)
INDEX
OPTIONS
2367750.73 2359661.90 8088.83
1382533 134344.36 (30.85)
STOCK
FUTURES
10649.38 9708.27 941.11
1962566 138823.96 (0.80)
STOCK
OPTIONS
8293.97 8547.30 (253.33) 111129 8091.38 6.94
Total 2389510.60
2381260.08
8250.52
3649302
300297.24
(14.80)
Turnover on
December
01
, 2022
Instrument
No. of
Contracts
Turnover
( in Cr. )
Change
(%)
Index
Futures
274805 2776888.46
3.03
Index
Options
309575145 4401875.09
16.94
Stock
Futures
800991 5515407.80
-3.45
Stock
Options
3027838 416913.86 13.82
Total
30,27,838 416913.86 4.57
Bull-Call Spreads
Action Strike Price Risk Reward BEP
Buy
18700 345.60
67.75
32.35
18767.75
Sell
18800 285.65
Buy
18700 345.60
132.80
67.20
18832.80
Sell
18900 227.05
Buy
18800 285.65
65.05 34.95 18865.05
Sell 18900 227.05
Bear
-
Put Spreads
Action Strike Price Risk Reward BEP
Buy 18700 175.70
25.50
74.50
18674.50
Sell
18600 145.55
Buy 18700 175.70
47.65
152.35
18652.35
Sell 18500 121.90
Buy
18600 145.55
22.15 77.85 18577.85
Sell 18500 121.90
Nifty Put
-
Call Analysis
,0
500,000
1000,000
1500,000
2000,000
2500,000
3000,000
3500,000
4000,000
4500,000
18100 18200 18300 18400 18500 18600 18700 18800 18900 19000 19100 19200 19300 19400
Call Put

www.angelone.in
Technical & Derivatives Report
DEC 02, 2022
`
Daily Pivot Levels for Nifty Constituents
Scrips
S2
S1
PIVOT
R1 R2
ADANIENT 3,878 3,897
3,921
3,939
3,963
ADANIPORTS
875
883
890
897
904
APOLLOHOSP 4,664 4,720
4,757
4,813
4,850
ASIANPAINT
3,143
3,161
3,179
3,197
3,215
AXISBANK
894
899
904
909 914
BAJAJ-AUTO 3,532 3,620
3,682
3,770
3,832
BAJFINANCE
6,679
6,713
6,742
6,776
6,805
BAJAJFINSV 1,617 1,628
1,635
1,646
1,653
BPCL
333
336
340
343
347
BHARTIARTL
836
842
848
854
859
BRITANNIA 4,307 4,354
4,382 4,429
4,458
CIPLA
1,101
1,113
1,129
1,141
1,157
COALINDIA 222 224
227
229
233
DIVISLAB
3,372
3,390
3,408
3,426
3,444
DRREDDY 4,399 4,437
4,484
4,522 4,569
EICHERMOT 3,386 3,412
3,456 3,482
3,526
GRASIM
1,742
1,771
1,789
1,818
1,837
HCLTECH
1,116
1,126
1,138
1,149
1,161
HDFCBANK
1,602
1,611
1,624
1,633
1,646
HDFCLIFE
584
590
595
602
607
HDFC
2,666
2,684
2,706
2,723
2,745
HEROMOTOCO 2,803 2,838
2,861
2,895
2,918
HINDALCO
449
456
461 469
474
HINDUNILVR 2,628 2,645
2,664 2,682 2,700
ICICIBANK
924
932
944
953
965
INDUSINDBK 1,153 1,164
1,172 1,183
1,191
INFY
1,640
1,649
1,661 1,669
1,681
ITC
334
337
339
342
344
JSW STEEL
738
742
747
752
757
KOTAKBANK
1,907
1,921
1,941
1,955
1,975
LT
2,067
2,086
2,098 2,116
2,128
M&M 1,271 1,282
1,299
1,311
1,328
MARUTI 8,876 8,917
8,971
9,012
9,066
NESTLEIND
19,697
19,873
20,111
20,288
20,526
NTPC
169
171
172
174
175
ONGC 138 139
141
141 143
POWERGRID 218 220
222
224
227
RELIANCE
2,692
2,708
2,731
2,747
2,770
SBILIFE
1,266
1,279
1,288
1,301
1,310
SBIN
598
603
606
611
615
SUNPHARMA
1,030
1,038
1,048
1,056
1,066
TCS
3,399
3,437
3,459 3,497
3,519
TATACONSUM
803
808
815 820
827
TATAMOTORS
433
436
440
442
446
TATASTEEL
107
109
110
112
113
TECHM
1,079
1,090
1,099
1,110
1,119
TITAN
2,610
2,624
2,645
2,659
2,680
ULTRACEMCO
6,939
7,106
7,203
7,370
7,467
UPL 769 774
781 786
794
WIPRO
409
411
414 416 419
www.angelone.in
Technical & Derivatives Report
DEC 02, 2022
*
Technical and Derivatives Team:
Sameet Chavan Chief Analyst – Technical & Derivatives sameet.chavan@angelone.in
Sneha Seth Senior Analyst – Technical & Derivatives sneha.seth@angelone.in
Rajesh Bhosale Technical Analyst rajesh.bhosle@angelone.in
Osho Krishan Senior Analyst – Technical & Derivatives osho.krishan@angelone.in
Research Team Tel: 022 – 39357600 Website: www.angelone.in
For Technical Queries E-mail: technicalresearch-cso@angelone.in
For Derivatives Queries E-mail: derivatives.desk@angelone.in
DISCLAIMER
Angel One Limited (hereinafter referred to as “Angel”) is a registered Member of National Stock Exchange of India Limited, Bombay
Stock Exchange Limited and Metropolitan Stock Exchange Limited. It is also registered as a Depository Participant with CDSL and
Portfolio Manager and investment advisor with SEBI. It also has registration with AMFI as a Mutual Fund Distributor. Angel One
Limited is a registered entity with SEBI for Research Analyst in terms of SEBI (Research Analyst) Regulations, 2014 vide registration
number INH000000164. Angel or its associates has not been debarred/ suspended by SEBI or any other regulatory authority for
accessing /dealing in securities Market.
This document is solely for the personal information of the recipient, and must not be singularly used as the basis of any investment
decision. Nothing in this document should be construed as investment or financial advice. Each recipient of this document should
make such investigations as they deem necessary to arrive at an independent evaluation of an investment in the securities of the
companies referred to in this document (including the merits and risks involved), and should consult their own advisors to determine
the merits and risks of such an investment.
Angel or its associates or research analyst or his relative may have actual/beneficial ownership of 1% or more in the securities of
the subject company at the end of the month immediately preceding the date of publication of the research report. Neither Angel or
its associates nor Research Analysts or his relative has any material conflict of interest at the time of publication of research report.
Angel or its associates might have received any compensation from the companies mentioned in the report during the period
preceding twelve months from the date of this report for services in respect of managing or co-managing public offerings, corporate
finance, investment banking or merchant banking, brokerage services or other advisory service in a merger or specific transaction
in the normal course of business. Angel or its associates did not receive any compensation or other benefits from the companies
mentioned in the report or third party in connection with the research report. Neither Angel nor its research analyst entity has been
engaged in market making activity for the subject company.
Reports based on technical and derivative analysis center on studying charts of a stock's price movement, outstanding positions and
trading volume, as opposed to focusing on a company's fundamentals and, as such, may not match with a report on a company's
fundamentals. Investors are advised to refer the Fundamental and Technical Research Reports available on our website to evaluate
the contrary view, if any.
The information in this document has been printed on the basis of publicly available information, internal data and other reliable
sources believed to be true, but we do not represent that it is accurate or complete and it should not be relied on as such, as this
document is for general guidance only. Angel One Limited or any of its affiliates/ group companies shall not be in any way responsible
for any loss or damage that may arise to any person from any inadvertent error in the information contained in this report. Angel One
Limited has not independently verified all the information contained within this document. Accordingly, we cannot testify, nor make
any representation or warranty, express or implied, to the accuracy, contents or data contained within this document. While Angel
One Limited endeavors to update on a reasonable basis the information discussed in this material, there may be regulatory,
compliance, or other reasons that prevent us from doing so.
This document is being supplied to you solely for your information, and its contents, information or data may not be reproduced,
redistributed or passed on, directly or indirectly.
Neither Angel One Limited, nor its directors, employees or affiliates shall be liable for any loss or damage that may arise from or in
connection with the use of this information. Angel or its associates or Research Analyst or his relative might have financial interest
in the subject company. Research analyst has not served as an officer, director or employee of the subject company.
