SEP 02, 2022
www.angelone.in
Technical & Derivatives Report
xOOOOOOOO
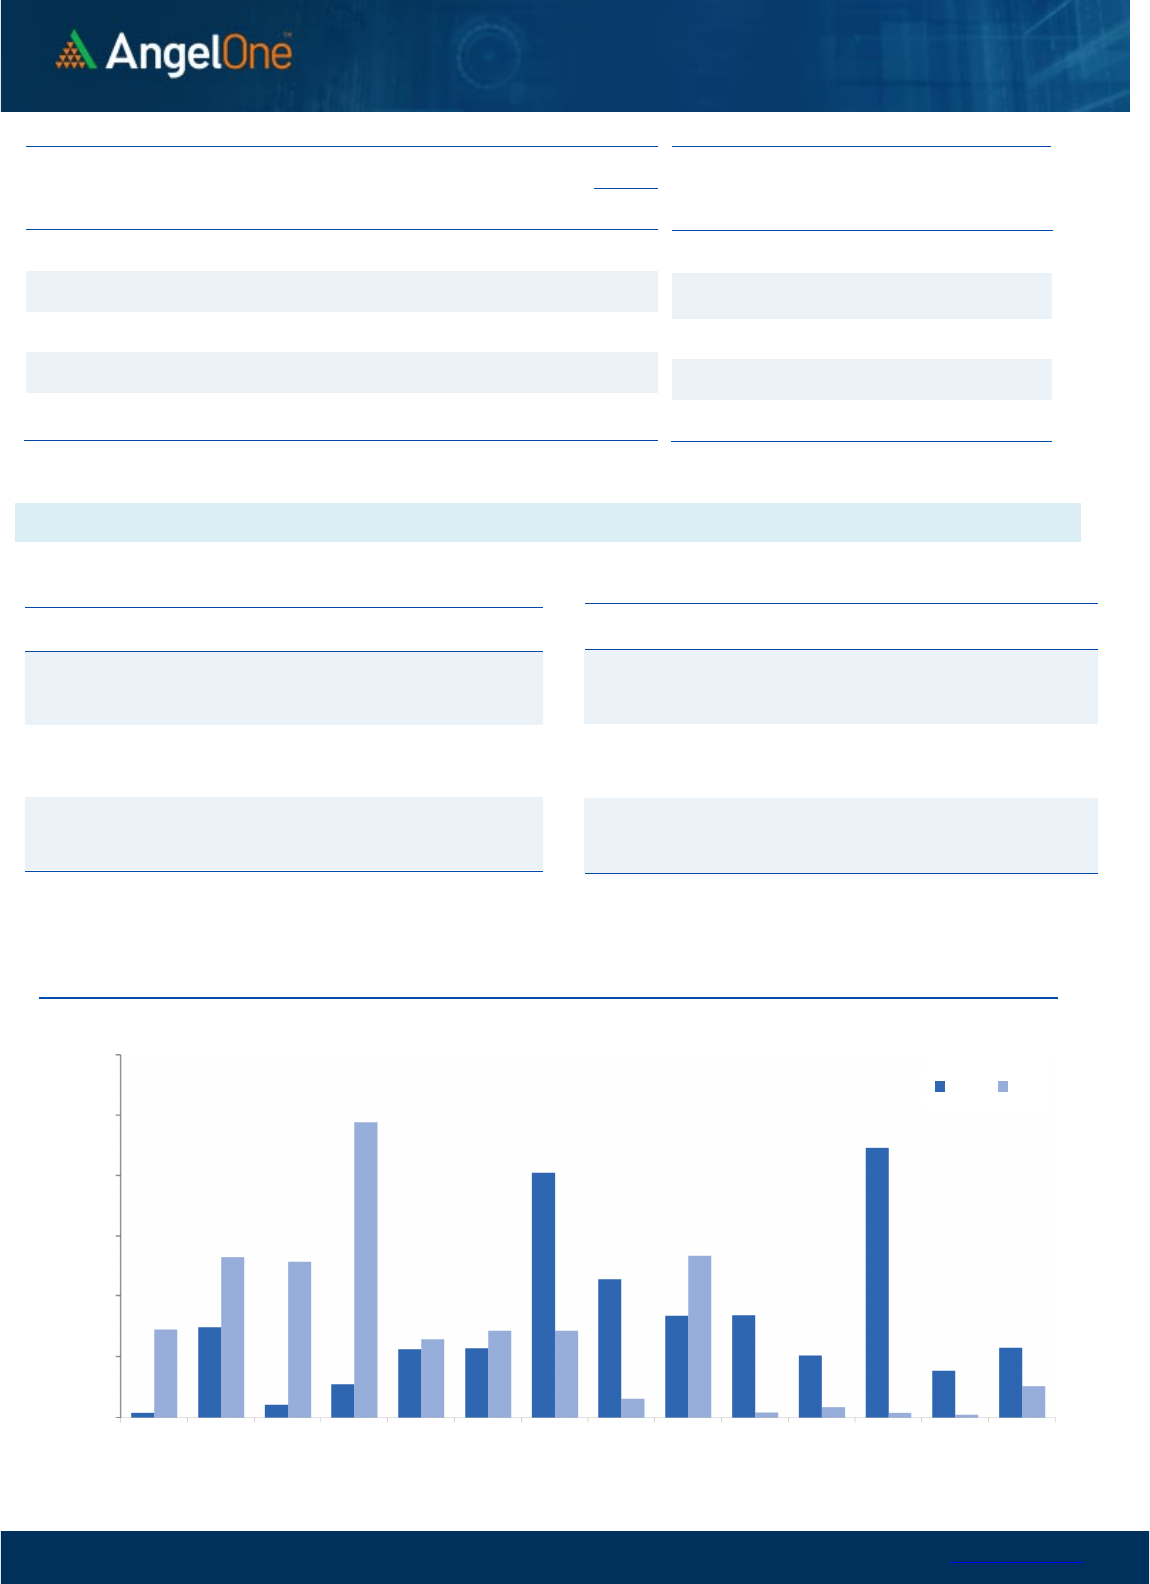
Nifty Bank Outlook (39301)
After a mid-week break, the BANKNIFTY started with a massive gap
down in tandem with benchmark. However, we saw almost complete
recovery in the initial hour, catching most of the complacent bears in
the wrong foot. Since it was an expiry session, market was not done
with it’s swings as we witnessed yet another bout of selling to
eventually conclude the session with more than half a percent cut.
We saw complete roller coaster move in key indices and in the midst
of all this, the BANKNIFTY appeared slightly stronger. Going ahead, we
continue to see a decent demand zone around 39000-38800; whereas
on the flipside, a cluster of resistances are visible at 39600-39800-
40000. Traders are advised to take a directional call only outside this
range; until then exiting as close as resistance levels and vice versa
should the apt strategy.
Key Levels
Support 1 – 39000 Resistance 1 – 39600
Support 2 – 38800 Resistance 2 – 39800
Exhibit 1: Nifty
Daily
Chart
Exhibit 2: Nifty Bank
Daily
Chart
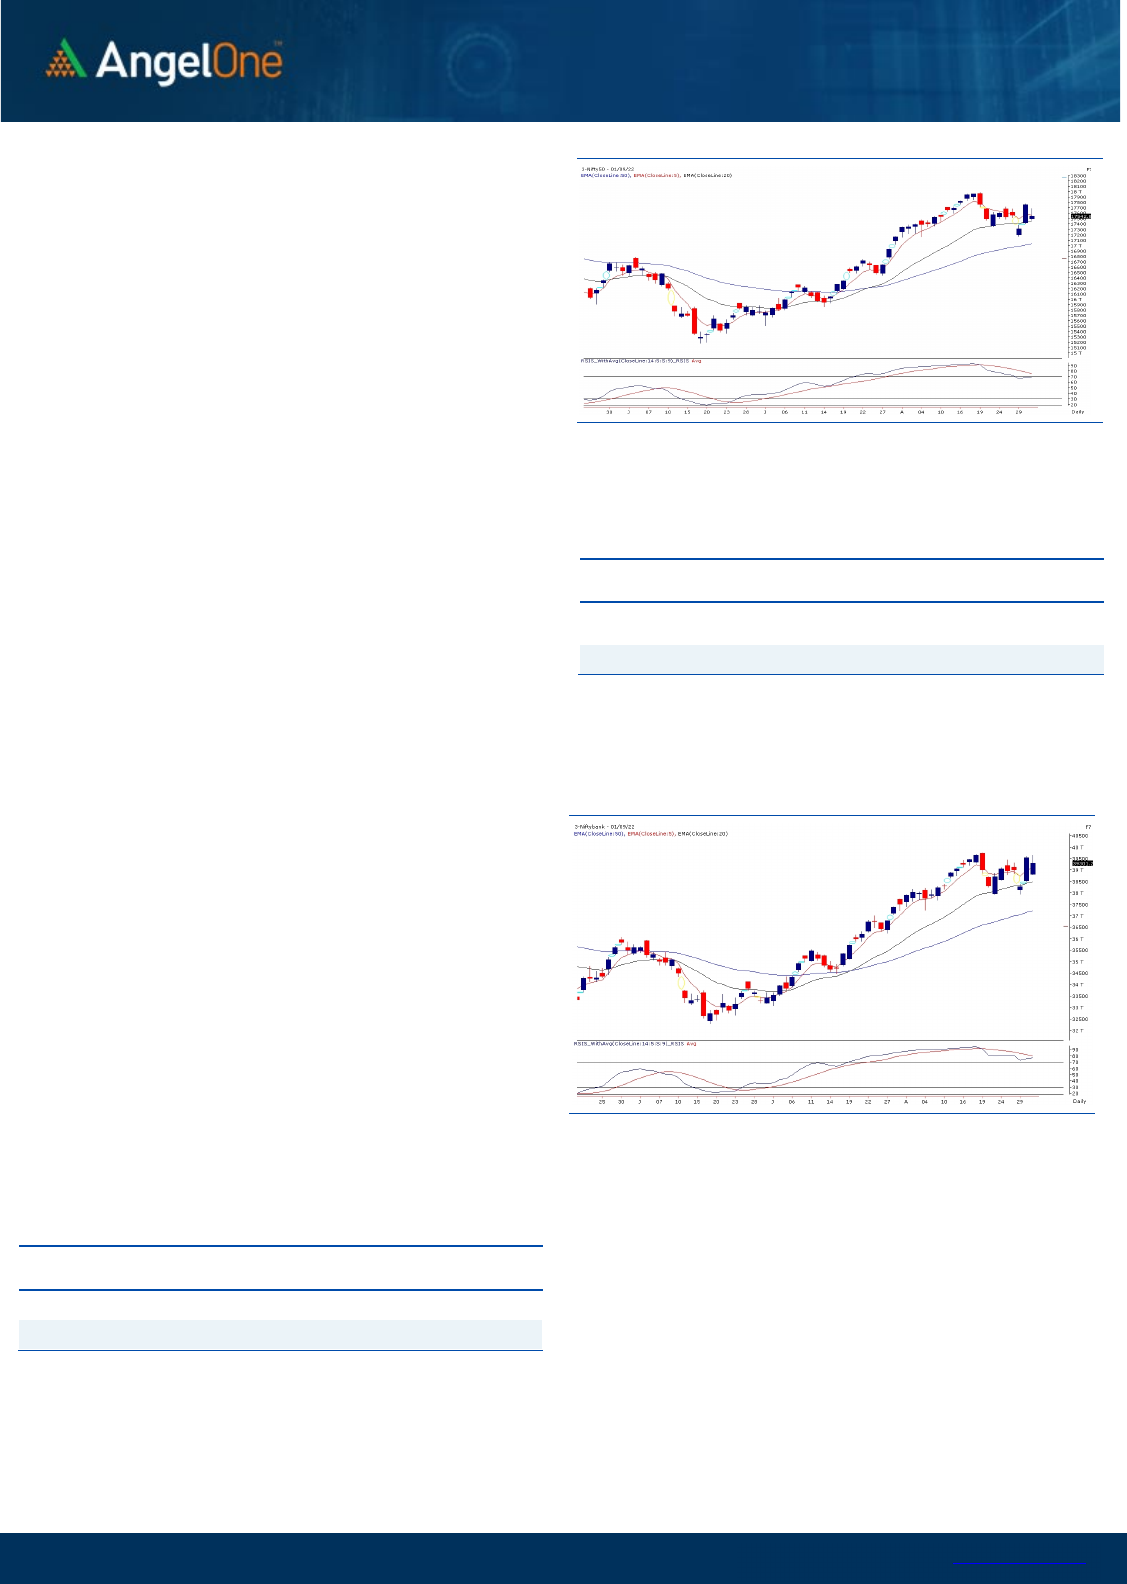
Sensex (58767) / Nifty (17543)
The weakness in the global bourses led to a weak start of our equity
market, wherein the benchmark index initiated the day with a gap
down. However, our market retaliated soon after the opening bell and
gradually gauged momentum to march upwards. Though a
tentativeness at the higher level was sensed among participants, that
triggered a sell-off in the second half. And with the whipsaw
movements in the market, the benchmark index Nifty50 concluded the
day in red with a cut of 1.22 percent, a tad above the 17500 zone.
On the technical perspective, the crucial support of the 17500 was
firmly safeguarded, implying the resilience of the technical support.
Though some tentativeness was seen in our domestic market during
the weekly expiry session, but any sign of respite from the global
bourses could trigger strong momentum from hereon. In terms of
technical levels, any breach below the mentioned support could drag
the market towards the 17350 zone, which is likely to be seen as the
sheet anchor. At the same time, on the higher end, the 17700-17750
could be seen as immediate resistance, followed by the 17850-17900
zone.
We would advocate avoiding aggressive overnight bets for the time
being and keeping a close tab on global developments. Meanwhile,
identifying the thematic movers should be the key to better trading
opportunities in the current market condition.
Key Levels
Support 1 – 17500 Resistance 1 – 17700
Support 2 – 17350 Resistance 2 – 17750

www.angelone.in
Technical & Derivatives Report
SEP 02, 2022
View
We started the proceeding with a downside gap
amidst selling seen in the global market. During the
day, index recovered a bit but bears were not ready
to give up hence we concluded the day with the cut
of more than a percent.
FIIs were net sellers in the cash market segment to
the tune of Rs. 2290 crores. Simultaneously, in Index
futures, they sold worth Rs. 4189 crores with a
increase in open interest, indicating short formation.
Yesterday, we observed fresh short formation in Nifty,
whereas long unwinding took place in banking index.
Stronger hands too turned net seller not only in
equities but also in index and stock futures segment.
We observed huge pile up of positions in 17550-17650
call strikes, which we believe are shorts. On the
contrary, put writer covered their shorts in ATM as
well as OTM strikes, which is certainly not an
encouraging sign for market. At present, we could
advocate trader’s too stay light and prefer trading
outside index.
Comments
The Nifty futures open interest has increased by
8.49%. and Bank Nifty futures open interest has
decreased by 11.16% as the market closed at 17542.80.
The Nifty Sep future closed with a premium of 49.60
point against a premium of 68.2 point in the last
trading session. The Oct series closed at a premium
of 95.85 point.
The INDIA VIX increased from 18.70 to 19.87. At the
same time, the PCR-OI of Nifty has decreased from
1.37 to 1.03.
Few of the liquid counters where we have seen high
cost of carry are IDEA, PEL, METROPOLIS, L&TFH,
AND FSL
Historical Volatility
SCRIP HV
GMRINFRA 50.23
ASHOKLEY 48.32
SRF 44.83
ABB 41.57
TATACOMM 46.05
Nifty Vs OI
17200
17300
17400
17500
17600
17700
17800
17900
18000
18100
6,000
8,000
10,000
12,000
14,000
16,000
18,000
8/11 8/16 8/18 8/22 8/24 8/30
Openinterest Nifty
OI Gainers
SCRIP OI
OI
CHG. (%)
PRICE
PRICE
CHG. (%)
BAJAJFINSV 838550 14.92 17406.25 2.31
RELIANCE 36406000 13.49 2560.40 -2.83
ASHOKLEY 53845000 12.80 162.75 5.45
HINDALCO 25389350 10.83 421.95 -3.82
VOLTAS 3805500 10.14 979.95 -1.91
PERSISTENT 518850 9.53 3400.00 -3.40
NATIONALUM 59840000 8.90 77.70 -3.52
SBILIFE 6177000 8.54 1296.55 -2.09
OI Losers
SCRIP OI
OI
CHG. (%)
PRICE
PRICE
CHG. (%)
GUJGASLTD 4421250 -14.87 478.05 1.94
ESCORTS 1595550 -10.55 2020.75 1.89
COROMANDEL 1157100 -9.97 1081.65 2.59
GSPL 3397500 -6.60 240.00 -0.31
RBLBANK 52535000 -5.78 122.15 -0.32
BEL 22986200 -4.98 319.80 3.87
POLYCAB 841200 -4.46 2483.45 0.26
SUNTV 10398000 -4.45 501.55 -0.01
Put-Call Ratio
SCRIP PCR (OI) PCR (VOL)
NIFTY 1.03 0.97
BANKNIFTY 1.04 0.96
RELIANCE 0.51 0.53
ICICIBANK 0.67 0.55
INFY 0.40 0.40
www.angelone.in
Technical & Derivatives Report
SEP 02, 2022
Note: Above mentioned Bullish or Bearish Spreads in Nifty (Sep Series) are given as an information and not as a recommendation.
Nifty Spot =
17,
542.80
FII Statistics for
September
01
, 2022
Detail Buy
Contracts
Open
Interest
Value
(in Cr.)
Sell
Net
CHANGE
INDEX
FUTURES
4420.13 8609.39 (4189.26) 133037 12117.26 34.07
INDEX
OPTIONS
2290909.15 2280718.06 10191.09
862975 77398.75
(43.94)
STOCK
FUTURES
13370.13 16832.81 (3462.68) 2087852 145898.62 1.07
STOCK
OPTIONS
8002.46 8114.17 (111.71) 92801 6553.24 10.84
Total 2316701.87
2314274.43
2427.44
3176665
241967.87
(16.14)
Turnover on
September
01
, 2022
Instrument
No. of
Contracts
Turnover
( in Cr. )
Change
(%)
Index
Futures
580916 53703.80 26.01
Index Options
329041952
31079021.33 116.25
Stock
Futures
903792 66121.71 6.62
Stock
Options
2555988 198486.07 -9.04
Total
2,555,988
198486.07 113.67
Bull-Call Spreads
Action Strike Price Risk Reward BEP
Buy
17600 329.20
50.55
49.45
17650.55
Sell
17700 278.65
Buy
17600 329.20
96.50
103.50
17696.50
Sell
17800 232.70
Buy
17700 278.65
45.95 54.05 17745.95
Sell 17800 232.70
Bear
-
Put Spreads
Action Strike Price Risk Reward BEP
Buy 7500 306.55
38.40
61.60
7461.60
Sell
7400 268.15
Buy 7500 306.55
73.40
126.60
7426.60
Sell 7300 233.15
Buy
7400 268.15
35.00 65.00 7365.00
Sell 7300 233.15
Nifty Put
-
Call Analysis
,0
500,000
1000,000
1500,000
2000,000
2500,000
3000,000
16900 17000 17100 17200 17300 17400 17500 17600 17700 17800 17900 18000 18100 18200
Call Put

www.angelone.in
Technical & Derivatives Report
SEP 02, 2022
`
Daily Pivot Levels for Nifty Constituents
Scrips
S2
S1
PIVOT
R1 R2
ADANIPORTS
823
831
839
846
854
APOLLOHOSP
4,198
4,238
4,283 4,323
4,368
ASIANPAINT 3,253 3,350
3,412
3,509
3,571
AXISBANK 723 733
744
755
766
BAJAJ-AUTO
3,951
4,014
4,073
4,135
4,194
BAJFINANCE
7,027
7,104
7,219
7,296
7,411
BAJAJFINSV 16,417 16,912
17,299
17,794
18,182
BPCL
321
326
330
335
338
BHARTIARTL
716
726
736
745
755
BRITANNIA
3,639
3,678
3,712
3,752
3,785
CIPLA
1,004
1,014
1,029
1,038
1,054
COALINDIA
225
228
232
235
239
DIVISLAB 3,554 3,576
3,600
3,623
3,647
DRREDDY
4,175
4,189
4,211
4,224
4,246
EICHERMOT
3,169
3,290
3,363
3,484 3,556
GRASIM
1,638
1,661
1,684
1,708
1,730
HCLTECH
910
918
924
933
939
HDFCBANK
1,443
1,458
1,474
1,488
1,504
HDFCLIFE
563
569
575
581
587
HDFC
2,369
2,386
2,412
2,429
2,455
HEROMOTOCO
2,761
2,819
2,851
2,908 2,940
HINDALCO 414 418
425
429
436
HINDUNILVR 2,557 2,582
2,618
2,643
2,679
ICICIBANK
852
863
874
886
897
INDUSINDBK
1,083
1,097
1,109 1,123
1,135
INFY
1,444
1,454
1,461
1,471
1,478
ITC
313
315
319
321
324
JSW STEEL
645
653
662
670
678
KOTAKBANK 1,851 1,877
1,901 1,927
1,952
LT
1,873
1,893
1,912 1,932
1,950
M&M
1,260
1,286
1,306
1,332
1,352
MARUTI 8,774 8,899
9,066
9,192
9,359
NESTLEIND 19,310 19,522
19,786
19,997
20,261
NTPC 158 159
162
163
166
ONGC
133
134
135
136
137
POWERGRID 222 224
227
229
232
RELIANCE
2,518
2,539
2,572
2,593
2,626
SBILIFE
1,278
1,287
1,300
1,309
1,322
SHREECEM 21,221 21,404
21,727
21,910 22,233
SBIN 514 523
532
542 551
SUNPHARMA
850
861
881 892
913
TCS
3,079
3,105
3,148
3,174
3,217
TATACONSUM
793 816
829
852
865
TATAMOTORS
456
461
468
473
480
TATASTEEL 105 106
107
107
109
TECHM
1,032
1,042
1,054
1,064
1,076
TITAN 2,530 2,576
2,612
2,658
2,693
ULTRACEMCO 6,511 6,572
6,666
6,727
6,821
UPL
743
750
758
765
773
WIPRO
402
406
409
413 416

www.angelone.in
Technical & Derivatives Report
SEP 02, 2022
*
Technical and Derivatives Team:
Sameet Chavan Chief Analyst – Technical & Derivatives sameet.chavan@angelone.in
Sneha Seth Senior Analyst – Technical & Derivatives sneha.seth@angelone.in
Rajesh Bhosale Technical Analyst rajesh.bhosle@angelone.in
Osho Krishan Senior Analyst – Technical & Derivatives osho.krishan@angelone.in
Research Team Tel: 022 – 39357600 (Extn. 6844) Website: www.angelone.in
For Technical Queries E-mail: technicalresearch-cso@angelone.in
For Derivatives Queries E-mail: derivatives.desk@angelone.in
DISCLAIMER
Angel One Limited (hereinafter referred to as “Angel”) is a registered Member of National Stock Exchange of India Limited, Bombay
Stock Exchange Limited and Metropolitan Stock Exchange Limited. It is also registered as a Depository Participant with CDSL and
Portfolio Manager and investment advisor with SEBI. It also has registration with AMFI as a Mutual Fund Distributor. Angel One
Limited is a registered entity with SEBI for Research Analyst in terms of SEBI (Research Analyst) Regulations, 2014 vide registration
number INH000000164. Angel or its associates has not been debarred/ suspended by SEBI or any other regulatory authority for
accessing /dealing in securities Market.
This document is solely for the personal information of the recipient, and must not be singularly used as the basis of any investment
decision. Nothing in this document should be construed as investment or financial advice. Each recipient of this document should
make such investigations as they deem necessary to arrive at an independent evaluation of an investment in the securities of the
companies referred to in this document (including the merits and risks involved), and should consult their own advisors to determine
the merits and risks of such an investment.
Angel or its associates or research analyst or his relative may have actual/beneficial ownership of 1% or more in the securities of
the subject company at the end of the month immediately preceding the date of publication of the research report. Neither Angel or
its associates nor Research Analysts or his relative has any material conflict of interest at the time of publication of research report.
Angel or its associates might have received any compensation from the companies mentioned in the report during the period
preceding twelve months from the date of this report for services in respect of managing or co-managing public offerings, corporate
finance, investment banking or merchant banking, brokerage services or other advisory service in a merger or specific transaction
in the normal course of business. Angel or its associates did not receive any compensation or other benefits from the companies
mentioned in the report or third party in connection with the research report. Neither Angel nor its research analyst entity has been
engaged in market making activity for the subject company.
Reports based on technical and derivative analysis center on studying charts of a stock's price movement, outstanding positions and
trading volume, as opposed to focusing on a company's fundamentals and, as such, may not match with a report on a company's
fundamentals. Investors are advised to refer the Fundamental and Technical Research Reports available on our website to evaluate
the contrary view, if any.
The information in this document has been printed on the basis of publicly available information, internal data and other reliable
sources believed to be true, but we do not represent that it is accurate or complete and it should not be relied on as such, as this
document is for general guidance only. Angel One Limited or any of its affiliates/ group companies shall not be in any way responsible
for any loss or damage that may arise to any person from any inadvertent error in the information contained in this report. Angel One
Limited has not independently verified all the information contained within this document. Accordingly, we cannot testify, nor make
any representation or warranty, express or implied, to the accuracy, contents or data contained within this document. While Angel
One Limited endeavors to update on a reasonable basis the information discussed in this material, there may be regulatory,
compliance, or other reasons that prevent us from doing so.
This document is being supplied to you solely for your information, and its contents, information or data may not be reproduced,
redistributed or passed on, directly or indirectly.
Neither Angel One Limited, nor its directors, employees or affiliates shall be liable for any loss or damage that may arise from or in
connection with the use of this information. Angel or its associates or Research Analyst or his relative might have financial interest
in the subject company. Research analyst has not served as an officer, director or employee of the subject company.
