March 02, 2023
www.angelone.in
Technical & Derivatives Report
Nifty Bank
Outlook (
40
698
)
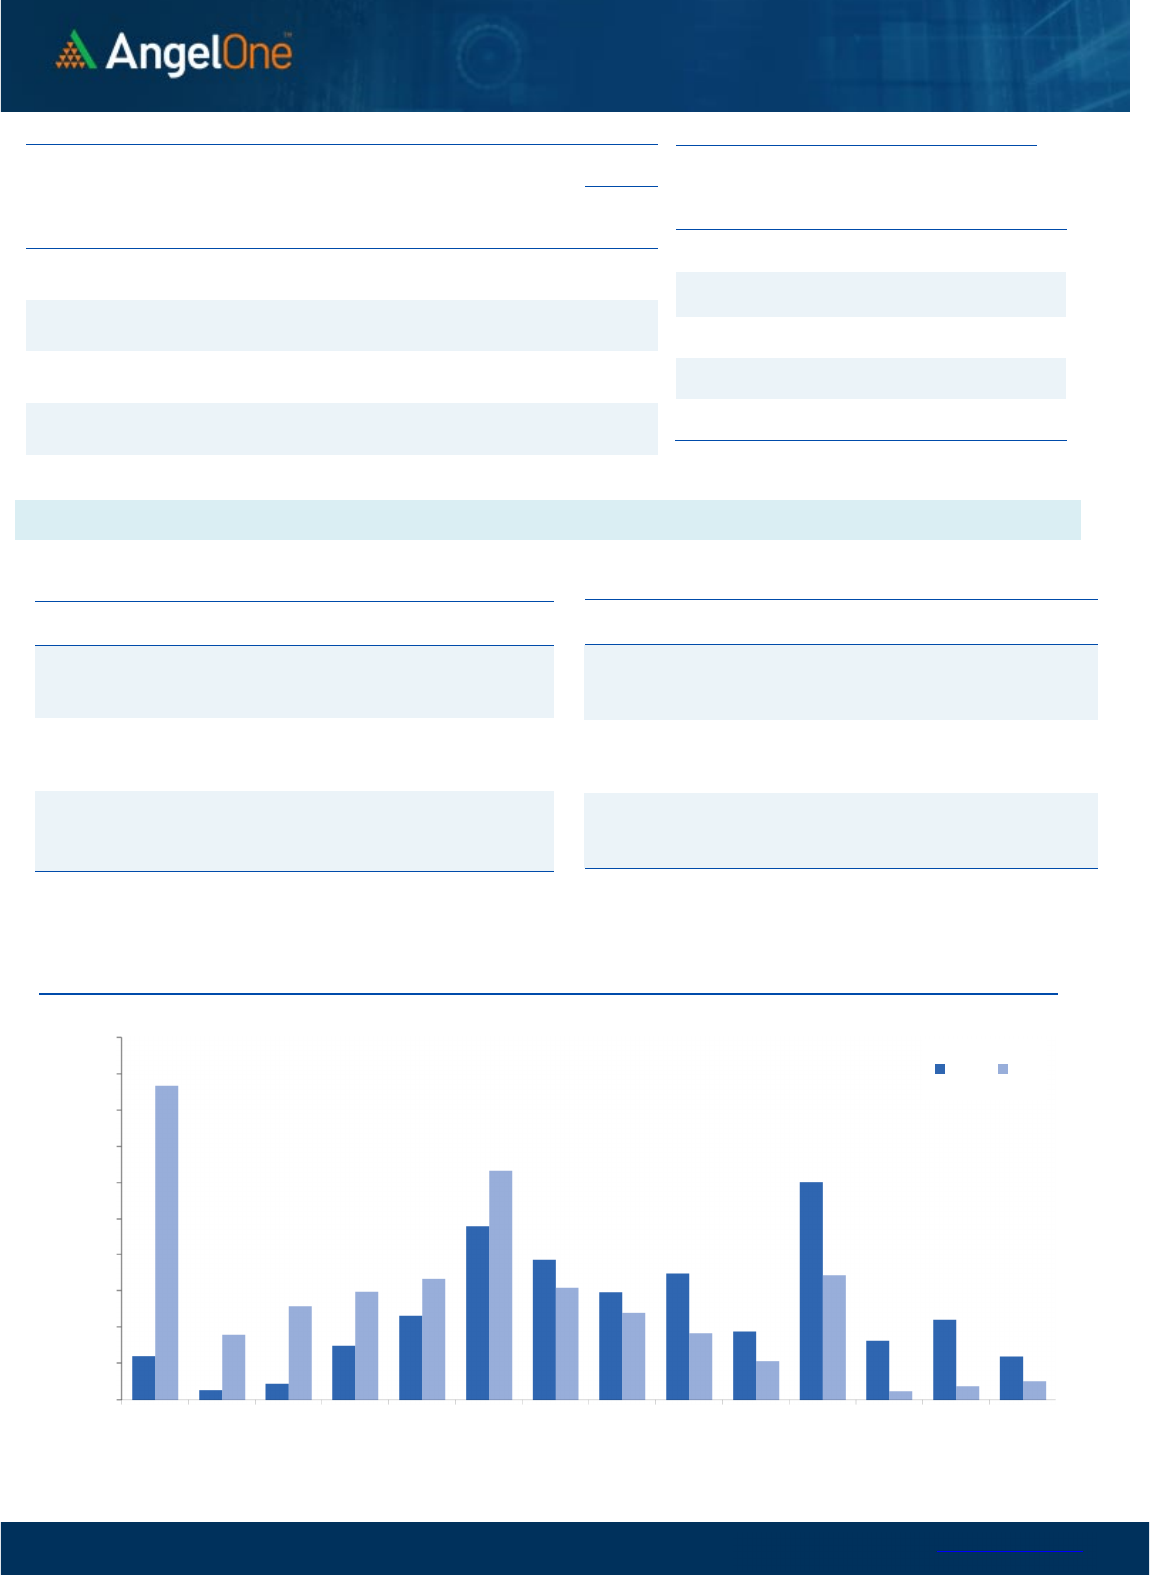
Bank Nifty started on a positive note and post an initial dip the
positive momentum continued throughout the session. The bank
index added another percent of gains to eventually end a tad
below 40700.
The bank index continues to outperform and yesterday it was the
charioteer to pull broader markets higher. Even though the Index
specific move post the gap up opening was not that significant but
the stock-specific move within the basket was very encouraging for
the traders. Going ahead, considering the chart structure of major
heavyweight counters we expect this up move to continue where
the next key level to watch out for would be in the zone of 41000 -
41300 that coincides with a descending trend line and 89EMA
resistance. Once these levels are taken out comfortably then one
can technically say that the recent tide of bearishness turns in favor
of bulls. On the flip side, on the weekly expiry day, traders are
advised to use dips as a buying opportunity where 40500 should be
considered as immediate support followed by 40300.
Key Levels
Support 1 – 40500 Resistance 1 – 41000
Support 2 – 40300 Resistance 2 – 41300
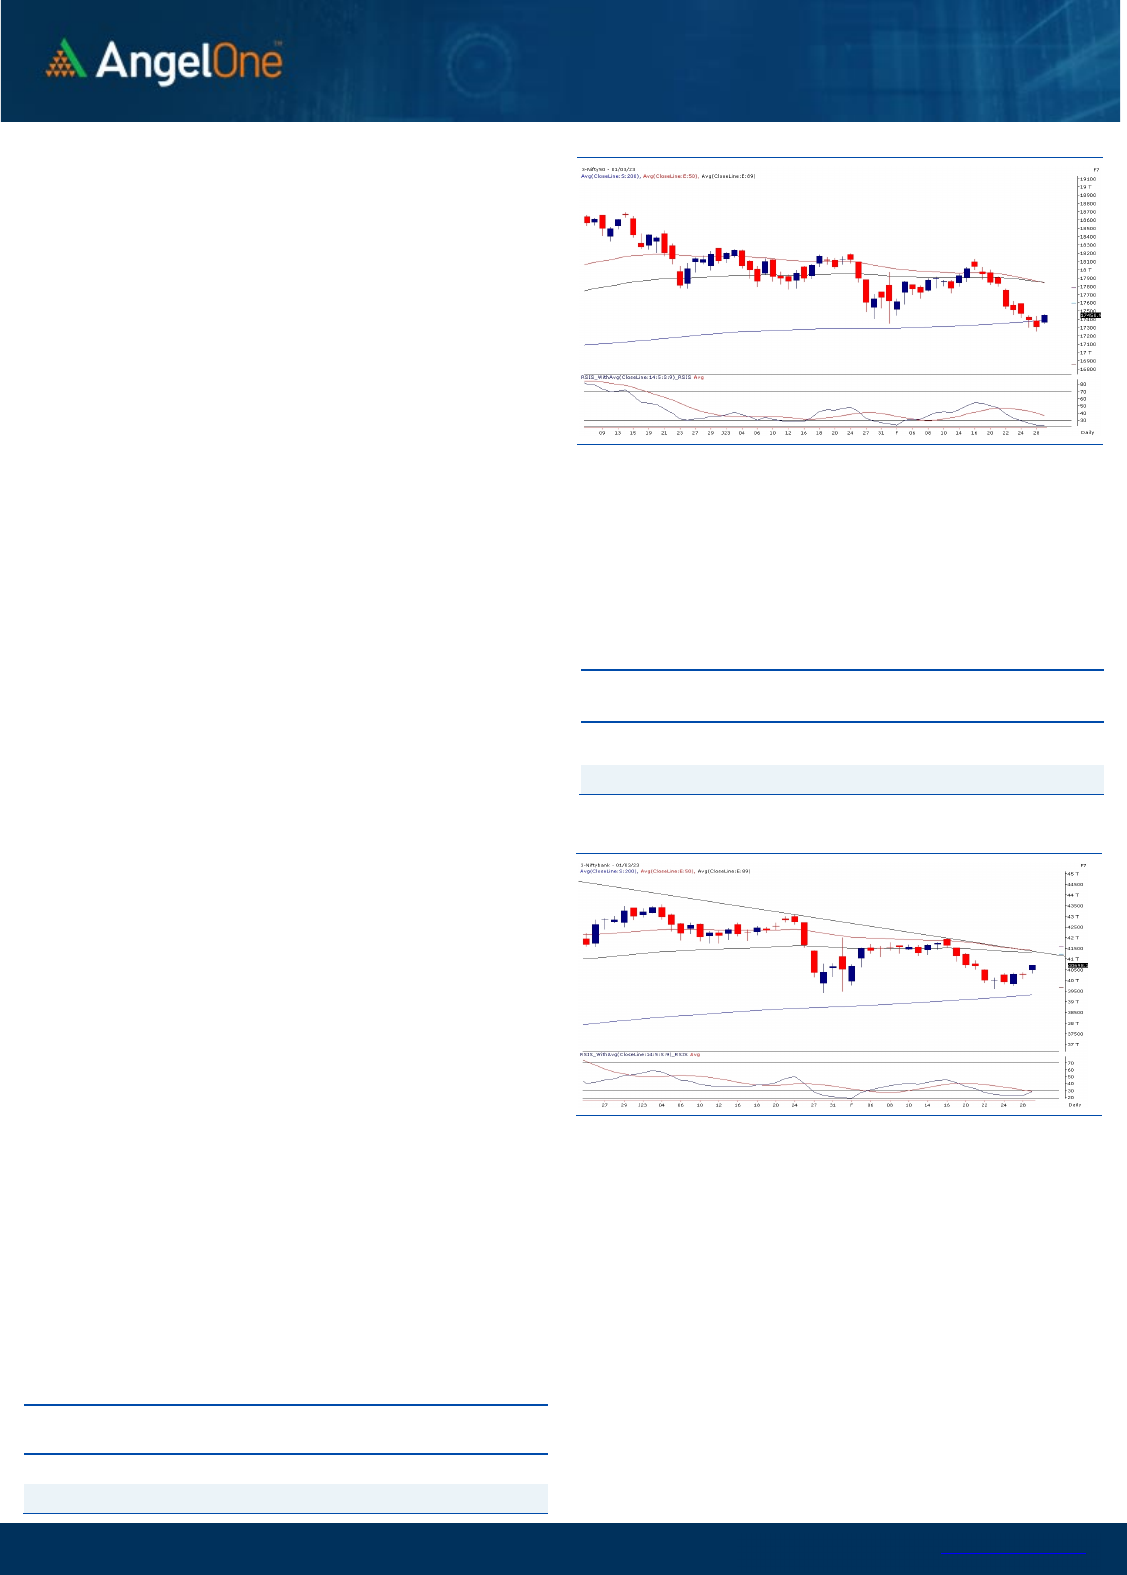
Exhibit 1: Nifty Daily Chart
Exhibit 2: Nifty Bank Daily Chart
Sensex (
5
9411
) / Nifty (
1
7
451
)
The Indian equity market snapped its selling spree and made a
modest recovery in yesterday’s session. The benchmark index
kickstarted the session on a positive note and stayed on the upward
trajectory throughout the day. The bulls showed their presence post
the strong correction of eight consecutive sessions and levitated
market sentiments. The Nifty concluded near the day’s high,
procuring nearly nine-tenth of a percent, and settled around the
17450 level.
As we allude to our previous commentary of not being carried away
with the sell-off, it aligns precisely with the market move. Also, the
buying emergence in the beaten-down counter could be seen as a
constructive development in the market. On the technical front, the
200 SMA has shown its significance as Nifty kept hovering near the
same. As far as levels are concerned, 17350-17300 is likely to
cushion any short-term blip, while the swing low of the 17250 odd
zone is expected to act as a sheet anchor for Nifty. While on the
higher end, an authoritative breach beyond 17600 could trigger the
next leg of rally in the comparable period.
Going forward, many stock-specific adjustments are likely to
continue and provide substantial trading opportunities.
And even though the indices may not be doing much, the
individual stocks are not at all short of action. Hence one should
continue to identify such potential movers and trade accordingly
and stay abreast with global and domestic developments on a
regular basis.
Key Levels
Support 1 – 17350 Resistance 1 – 17500
Support 2 – 17300 Resistance 2 – 17640

www.angelone.in
Technical & Derivatives Report
March 02, 2023
View
On Wednesday, market had a positive start and
buying interest accelerated right from the word go.
Index maintained its posture for the entire day and
concluded the day in green at 17450.
FIIs were net sellers in the cash market segment to
the tune of Rs. 425 crores. Simultaneously, in Index
futures, they buyers worth Rs. 638 crores with some
rise in open interest, indicating long formation.
Yesterday, we witnessed blend of short covering and
long formation in both the key indices. Stronger
hands continue selling streak in equities but added
longs in index futures segment. Their index futures
Long Short Ratio stands at 18% from 15%. Put writers
shifted to 17400, which is an encouraging sign for
Bulls. On the other side, call writers of 17300 and
17400 strikes ran for shelter seeing smart recovery.
For now, base formation is seen around 17200 –
17300 odd zone and on the upside 17600 will be the
important level to watch out.
Comments
The Nifty futures open interest has decreased by 1.71%
and Bank Nifty futures open interest has increased by
0.97% as the market closed at 17450.90.
The Nifty March future closed with a premium of 81.8
point against a premium of 99.45 point in the last
trading session. The April series closed at a premium of
183.15 point.
The INDIA VIX decreased from 14.02 to 12.99. At the
same time, the PCR-OI of Nifty has decreased from 0.67
to 0.92.
Few of the liquid counters where we have seen high
cost of carry are COALINDIA, AARTIIND, CUB,
RAMCOCEM and CANBK.
Historical Volatility
SCRIP HV
RAIN 53.13
ADANIENT 92.72
NATIONALUM 50.47
ABCAPITAL 43.42
FEDERALBNK 39.66
Nifty Vs OI
17400
17500
17600
17700
17800
17900
18000
18100
18200
4,000
6,000
8,000
10,000
12,000
14,000
16,000
2/8 2/10 2/14 2/16 2/20 2/23 2/27
Openinterest Nifty
OI Gainers
SCRIP OI
OI
CHG. (%)
PRICE
PRICE
CHG. (%)
POLYCAB 1081800 23.03 3116.00 1.06
MFSL 3303300 18.10 699.60 0.98
INDIAMART 331950 18.09 4951.25 3.45
GUJGASLTD 4398750 14.70 511.20 1.30
ADANIENT 14522250 12.60 1564.30 14.34
RAIN 11840500 11.95 166.30 8.45
TATASTEEL 205903500 9.17 105.50 1.53
PEL 6842550 6.58 778.50 1.22
OI Losers
SCRIP OI
OI
CHG. (%)
PRICE
PRICE
CHG. (%)
DIXON 746875 -16.63 2929.85 1.00
DELTACORP 16492000 -9.16 196.10 4.46
GNFC 8087300 -8.93 541.60 3.19
BAJAJ-AUTO 1169500 -7.62 3731.40 1.71
SHRIRAMFIN 4155000 -5.49 1221.65 1.09
BANKBARODA 103065300 -5.20 164.40 3.96
NESTLEIND 254080 -4.65 18779.00 0.55
AXISBANK 47521200 -4.10 865.15 2.23
Put-Call Ratio
SCRIP PCR (OI) PCR (VOL)
NIFTY 0.92 0.91
BANKNIFTY 1.14 0.90
RELIANCE 0.61 0.43
ICICIBANK 0.72 0.58
INFY 0.54 0.42
www.angelone.in
Technical & Derivatives Report
March 02, 2023
Note: Above mentioned Bullish or Bearish Spreads in Nifty (March Series) are given as an information and not as a recommendation.
Nifty Spot =
1
7
450.9
0900
Lot Size = 75
FII Statistics for
March 01
, 202
3
Detail Buy
Contracts
Open
Interest
Value
(in Cr.)
Sell
Net
CHANGE
INDEX
FUTURES
3129.60
2491.17
638.43
197164
17899.01
4.23
INDEX
OPTIONS
1089344.21
1086990.69
2353.52
2739518
251879.64
4.39
STOCK
FUTURES
9547.20
8571.43
975.77
2173518
143046.71
(0.02)
STOCK
OPTIONS
7235.01
7481.02
(246.01) 105693
6924.14
4.93
Total 1109256.02
1105534.31
3721.71
5215893
419749.50
2.51
Turnover
on
March
01
, 202
3
Instrumen
t
No. of
Contracts
Turnover
( in Cr. )
Change
(%)
Index Futures
275107
26044.88 -12.09
Index Options
1719926
73
44116.02 -16.33
Stock Futures
742676
46510.70 -12.45
Stock Options
2524288
3596.65 -7.78
Total
2,524,28
8
3596.65 -13.71
Bull-Call Spreads
Action Strike Price Risk Reward BEP
Buy
17500 231.15
52.80
47.20
17552.80
Sell
17600 178.35
Buy
17500 231.15
97.95
102.05
17597.95
Sell
17700 133.20
Buy
17600 178.35
45.15 54.85 17645.15
Sell
17700 133.20
Bear-Put Spreads
Action Strike Price Risk Reward BEP
Buy
17400 163.00
32.55
67.45
17367.45
Sell 17300 130.45
Buy 17400 163.00
58.45
141.55
17341.55
Sell
17200 104.55
Buy
17300 130.45
25.90 74.10 17274.10
Sell 17200 104.55
Nifty Put-Call Analysis
,0
500,000
1000,000
1500,000
2000,000
2500,000
3000,000
3500,000
4000,000
4500,000
5000,000
17000 17100 17200 17300 17400 17500 17600 17700 17800 17900 18000 18100 18200 18300
Call Put

www.angelone.in
Technical & Derivatives Report
March 02, 2023
`
Daily
Pivot Levels for Nifty Constituents
Scrips
S2
S1
PIVOT
R1
R2
ADANIENT
1,349
1,457
1,518
1,626
1,687
ADANIPORTS 583 592
604
614
626
APOLLOHOSP
4,290
4,352
4,399
4,461
4,508
ASIANPAINT
2,800
2,820
2,837
2,857
2,874
AXISBANK 836 851
860
874
883
BAJAJ-AUTO
3,594
3,663
3,706
3,774
3,817
BAJFINANCE
6,049
6,102
6,153
6,206
6,257
BAJAJFINSV
1,321
1,333
1,346
1,358
1,371
BPCL 312 314
317
319
323
BHARTIARTL 736 743
748
755
761
BRITANNIA
4,297
4,338
4,397
4,438
4,496
CIPLA 888 894
902
908
916
COALINDIA 213 216
217
220
222
DIVISLAB
2,808
2,827
2,842
2,861
2,876
DRREDDY
4,273
4,308
4,333
4,369
4,393
EICHERMOT
3,066
3,102
3,123
3,160
3,180
GRASIM
1,557
1,575
1,587
1,605
1,617
HCLTECH
1,068
1,084
1,094
1,111
1,121
HDFCBANK
1,585
1,592
1,602
1,609
1,620
HDFCLIFE
482
486
488
492
495
HDFC
2,597
2,608
2,618
2,628
2,638
HEROMOTOCO
2,400
2,416
2,430
2,445
2,459
HINDALCO 397 405
410
418
423
HINDUNILVR
2,439
2,453
2,461
2,475
2,483
ICICIBANK 845 851
857
863
870
INDUSINDBK
1,056
1,078
1,092
1,115
1,129
INFY
1,473
1,485
1,493
1,504
1,512
ITC 371 375
378
382
384
JSW STEEL 664 670
675
681
685
KOTAKBANK
1,716
1,730
1,741
1,755
1,765
LT
2,085
2,100
2,115
2,130
2,145
M&M
1,246
1,259
1,282
1,295
1,319
MARUTI
8,564
8,664
8,720
8,820
8,876
NESTLEIND
18,480
18,629
18,725
18,874
18,970
NTPC 169 170
172
174
175
ONGC 151 153
154
156
157
POWERGRID 215 217
220
222
224
RELIANCE
2,315
2,330
2,338
2,352
2,360
SBILIFE
1,100
1,109
1,118
1,127
1,136
SBIN 518 527
532
542
547
SUNPHARMA 944 952
959
967
974
TCS
3,289
3,337
3,363
3,411
3,437
TATACONSUM
707 711
714
718
721
TATAMOTORS 419 422
425
429
432
TATASTEEL 103 104
106
107
108
TECHM
1,086
1,106
1,118
1,138
1,150
TITAN
2,352
2,367
2,382
2,397
2,411
ULTRACEMCO
7,155
7,215
7,279
7,339
7,403
UPL 688 700
707
720
727
WIPRO 386 388
390
393
394

www.angelone.in
Technical & Derivatives Report
March 02, 2023
*
Technical and Derivatives Team:
Sameet Chavan Chief Analyst – Technical & Derivatives sameet.chavan@angelone.in
Sneha Seth Senior Analyst – Technical & Derivatives sneha.seth@angelone.in
Rajesh Bhosale Technical Analyst rajesh.bhosle@angelone.in
Osho Krishan Senior Analyst – Technical & Derivatives osho.krishan@angelone.in
Research Team Tel: 022 – 39357600 Website: www.angelone.in
For Technical Queries E-mail: technicalresearch-cso@angelone.in
For Derivatives Queries E-mail: derivatives.desk@angelone.in
DISCLAIMER
Angel One Limited (hereinafter referred to as “Angel”) is a registered Member of National Stock Exchange of India Limited, Bombay Stock Exchange
Limited and Metropolitan Stock Exchange Limited. It is also registered as a Depository Participant with CDSL and Portfolio Manager and investment
advisor with SEBI. It also has registration with AMFI as a Mutual Fund Distributor. Angel One Limited is a registered entity with SEBI for Research
Analyst in terms of SEBI (Research Analyst) Regulations, 2014 vide registration number INH000000164. Angel or its associates has not been
debarred/ suspended by SEBI or any other regulatory authority for accessing /dealing in securities Market.
This document is solely for the personal information of the recipient, and must not be singularly used as the basis of any investment decision.
Nothing in this document should be construed as investment or financial advice. Each recipient of this document should make such investigations
as they deem necessary to arrive at an independent evaluation of an investment in the securities of the companies referred to in this document
(including the merits and risks involved), and should consult their own advisors to determine the merits and risks of such an investment.
Angel or its associates or research analyst or his relative may have actual/beneficial ownership of 1% or more in the securities of the subject
company at the end of the month immediately preceding the date of publication of the research report. Neither Angel or its associates nor
Research Analysts or his relative has any material conflict of interest at the time of publication of research report.
Angel or its associates might have received any compensation from the companies mentioned in the report during the period preceding twelve
months from the date of this report for services in respect of managing or co-managing public offerings, corporate finance, investment banking or
merchant banking, brokerage services or other advisory service in a merger or specific transaction in the normal course of business. Angel or its
associates did not receive any compensation or other benefits from the companies mentioned in the report or third party in connection with the
research report. Neither Angel nor its research analyst entity has been engaged in market making activity for the subject company.
Reports based on technical and derivative analysis center on studying charts of a stock's price movement, outstanding positions and trading
volume, as opposed to focusing on a company's fundamentals and, as such, may not match with a report on a company's fundamentals. Investors
are advised to refer the Fundamental and Technical Research Reports available on our website to evaluate the contrary view, if any.
The information in this document has been printed on the basis of publicly available information, internal data and other reliable sources believed
to be true, but we do not represent that it is accurate or complete and it should not be relied on as such, as this document is for general guidance
only. Angel One Limited or any of its affiliates/ group companies shall not be in any way responsible for any loss or damage that may arise to any
person from any inadvertent error in the information contained in this report. Angel One Limited has not independently verified all the information
contained within this document. Accordingly, we cannot testify, nor make any representation or warranty, express or implied, to the accuracy,
contents or data contained within this document. While Angel One Limited endeavors to update on a reasonable basis the information discussed
in this material, there may be regulatory, compliance, or other reasons that prevent us from doing so.
This document is being supplied to you solely for your information, and its contents, information or data may not be reproduced, redistributed or
passed on, directly or indirectly.
Neither Angel One Limited, nor its directors, employees or affiliates shall be liable for any loss or damage that may arise from or in connection
with the use of this information. Angel or its associates or Research Analyst or his relative might have financial interest in the subject company.
Research analyst has not served as an officer, director or employee of the subject company.
